AN ASSESSMENT OF LABOR MANAGEMENT STANDARDS FOR THE RESTAURANT INDUSTRY
←
→
Page content transcription
If your browser does not render page correctly, please read the page content below
25 years customizing restaurant labor management systems. This is the consulting and
implementation experience with chain operators that we’ve drawn upon to document the state
of labor management standards in the restaurant industry. This White Paper describes how
new labor systems bring labor standards to life by putting them “in context” while making fixed,
picture-in-time labor standards obsolete. Ponder the possibilities and enjoy!

              AN ASSESSMENT OF LABOR MANAGEMENT STANDARDS
                       FOR THE RESTAURANT INDUSTRY
             Introducing a New Era of “Contextual” Labor Management

New Labor Systems Flex Staffing Targets to Accommodate Guest Preferences
In a restaurant world heaving with marketing promotions and guests demanding customized
experiences, labor staffing targets must flex with differing guest preferences and company
marketing programs. New labor systems now afford a way of personalizing a store's labor
targets based on guest needs and marketing programs outside the restaurant managers'
control.
In a "contextual" labor management system, the dynamics of labor targets change depending
on who is in the store and how they wish to use the experience. Labor requirements expand
and contract depending on differing seating arrival rates, party sizes, service requests, table
turn durations, marketing promotions, menu item choices and bar sales mixes. Everyday
managers must adjust their staffing deployment in real time based on customer decisions about
how they want to use the experience, in other words, in the context of meeting their needs.
Contextual labor systems, like the Deterministics Labor System, now offer operators credible
labor guidelines that they can believe in and adhere to because they are based on a brand's
standards and flex with the needs of each guest experience.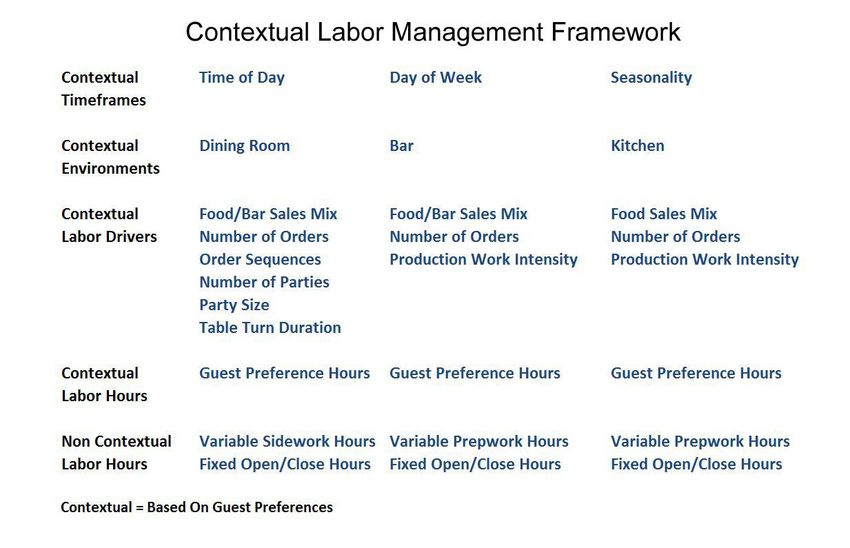
Deterministics White Paper
                                                   Introducing a New Era of “Contextual” Labor Management

The Case for Contextual Labor Management (CLM)
Restaurants are complex enterprises where the variables of combining customer service and
food manufacturing under the same roof lead to labor staffing challenges. Throw into this mix
the variability of demand factors displayed below and you can see the cocktail of customization
managers face to effectively staff each day.

Demand Variability Factors
Macro environments that impact when and how many guests will patronize
      Store location - freestanding, office building, shopping strip, mall, airport, concession
      Seasonality
      Day of week
      Daypart
      Demographics - gender, age
      Purpose of visit - refuel, reward, special occasion, business occasion, neighborhood
      occasion
Restaurant environments that impact how guests will use the experience
       Seasonal menu rotation
       Daily menu rotation
       Variable menu pricing
       Limited time offers - new menu items, item discounting, menu bundling
       Daily specials - early bird, happy hour
       Service offerings - bar, dining room, take out - all with differing labor economics and
       differing service durations
       Menu offerings with differing labor economics - e.g. Salad X takes 1.5 minutes to
       prepare while Salad Y takes 3.1 minutes
       Prep sub recipes - each food recipe requires a corresponding Labor Recipe™ to calculate
       the amount of replenishment and the amount of work time based on menu item
       purchases

All these factors combine to affect the variability of business patterns that determine where,
when, why and how the guest will use the restaurant experience. Each of these factors forms a
kaleidoscope of operating environments that change the mix of guest arrival rates, party sizes,
service steps, table turn durations, menu item choices and bar sales mixes that exhibit differing
labor economics. This in turn impacts the number and duration of restaurant staff based on
their contribution in the service-and-production-delivery chain on a shift by shift and minute by
minute basis. All restaurant managers will tell you that no restaurant experience is the same.
 They will say "a guest is not a guest, a plate is not a plate, a check is not a check, a table is not a
table and therefore...one restaurant's performance is not a good proxy for another."

                                                   2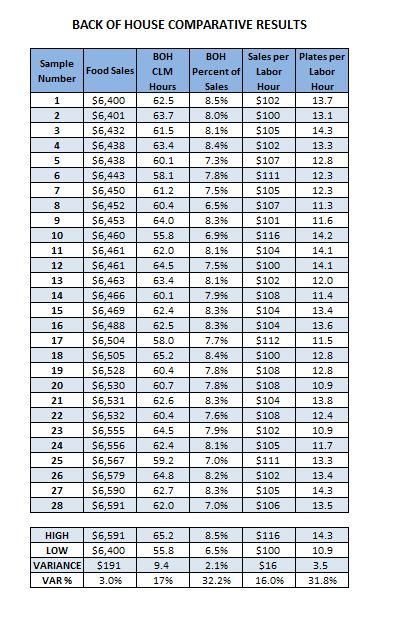
Deterministics White Paper
                                               Introducing a New Era of “Contextual” Labor Management

Metrics of Labor Management
To effectively plan and staff for business needs, restaurant companies have employed a variety
of metrics to calculate required labor hours. The most common are a labor percent of sales,
followed by productivity metrics such as sales/hour, guests/hour, checks/hour, plates/hour,
and tables/hour. At a companywide level these can be important benchmark metrics for “C”
level management and investors. However, they are not useful in day to day staffing decisions
since they do not reflect the dynamic nature of marketing promotions and differing guest
experiences in each restaurant, each day.

The Contextual Labor Management (CLM) Solution
Work Content and Work Context: Bringing Labor Standards to Life
Accurate labor management requires a combination of time studied work tasks and technology
configured for each restaurant's operating environment. The value of CLM systems, like the
Deterministics Labor System, comes from the accuracy of recipe based labor standards that
can account for guest purchases (content) and guest behaviors (context). It also accounts for
the complex interrelationships of a food manufacturing facility with layers of shared sub recipe
prep work that supports final menu item execution in each cook station.
Contextual Labor Management reflects the labor dynamics of each store based on actual guest
purchase patterns. For example, a CLM System can report the correct staffing of Host, Server,
Cooks, Bus and Bartender accommodating the following scenarios.

       Table 26
       Party of five seated at 11:45am
       Ordered one round of alcoholic drinks
       Ordered three appetizers to share
       Ordered entrees after appetizers consumed
       Ordered second round of alcoholic drinks
       Two desserts ordered after entrees consumed
       Paid bill via credit card
       Departed 1:14 for a table turn time of 89 minutes
       Sales: $162.80           Server Hours: 1.5  Sales Per Labor Hour: $109

       Table 31
       Party of two seated at 12:23pm
       Ordered one round of non-alcoholic drinks and entrées in one Server trip
       Paid bill with cash left on table
       Departed 1:08 for a table turn time of 45 minutes
       Sales: $33.00            Server Hours: .75  Sales Per Labor Hour: $44

Needless to say, a CLM Report of required staffing is much different than a fixed Sales Per Labor
Hour Report since the actual sales per labor hour was $109 for table 26 and $44 for table 31.

                                                3
Deterministics White Paper
                                               Introducing a New Era of “Contextual” Labor Management

Each of these tables were occupied for different meal durations and required differing amounts
of time for service, food production, drink production and cleaning at different times of day by
different staff. CLM Systems can report the correct staffing levels for all participants based on
these two very different scenarios.

The Components of a CLM System
The process illustrated below show the steps to setting up the CLM System and the
components used to calculate required hours by employee position.

Define Employee Positions and Labor Drivers
The first step is to define what Employee Positions will be managed by the system. The next
step is to identify transaction-level information obtained from the point-of-sale system that can
be correlated with the work content of each position. Data that determines when and where
labor is allocated, we refer to these as Labor Drivers. The “when” refers to labor driver data
that is “time stamped.” It reflects the timing and sequence of guest requests that represent the
work context of the meal experience. This is critical for accuracy because work is performed
before the meal, during the meal, and after the meal is completed. The “where” refers to each
driver connected to an Employee Position who performs work. In this process, an Employee
Position may be connected to one or many Labor Drivers depending on the work. For example,
Bus staffing may be driven by a single driver of departing guests, while Grill Cook staffing is
driven by all grill orders on the menu – each a separate driver with its own work content.
Examples of service and production drivers are as follows:

       Service Labor Drivers
           Host/Seaters – check open times backset five minutes
           Waitlist Host staff – 85% dining room tables occupied
           Servers - check open and check close time stamp denotes occupied tables per server
           at any point in time (validates staffing is within section size goals)
           Server - order drink time stamp triggers production work and order delivery
           Server - order appetizer/entrée/dessert time stamp triggers order delivery offset by
           throughput time
           Bus - check close time stamp to trigger table bussing and resetting

       Production Labor Drivers
           Food menu items are drivers for Line Cooks and Dishwashers
           Food menu item sub recipes are drivers for Prep Cooks and Dishwashers
           Beverage orders from the bar are drivers for Bartenders
           Beverage orders by the Server are drivers for Servers

                                                4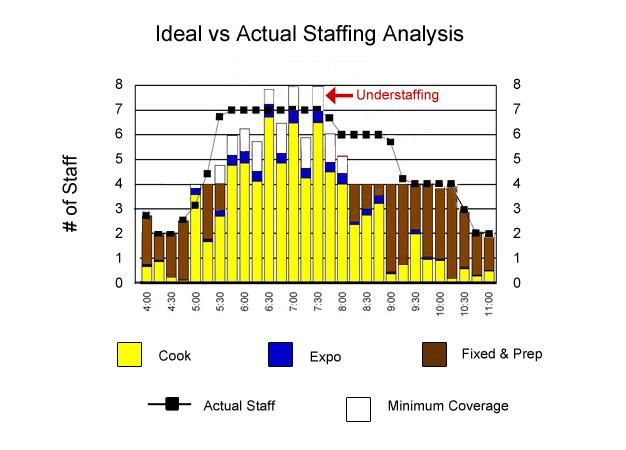
Deterministics White Paper
                                               Introducing a New Era of “Contextual” Labor Management

Assign Labor Recipes
The third step is to measure all work content through time and motion studies of each position
to establish standard work times for all tasks performed in the restaurant. We call these Labor
RecipesTM because just as restaurants have standard food recipes with correct procedures to
follow, so too should they have labor recipes that reflect the correct work sequence and
quantity (in time) to meet their brand standards.
The following example details a food recipe and a labor recipe for a cheeseburger produced at
the Grill Station. The colorized work elements identify prep sub recipes that also involve work
content in support of the menu item. The work content of these recipes is summarized and the
pro rata work time, or portion of the prep recipe time that goes into the menu item, is detailed
to reflect the total work time required to produce a single cheeseburger.

                                               5
Deterministics White Paper
                                               Introducing a New Era of “Contextual” Labor Management

Apply Deployment Rules
With each Employee Position assigned Labor Drivers and Labor Recipes, Deployment Rules are
applied to reflect brands standards in the context of how work is to be performed. These are
perhaps the most challenging assumptions that CLM Systems can manage…the ability to
configure labor drivers with employee positions and display when the work can be shared
based on business volumes, position availability, work rules and physical constraints. For
example, Host and Seater positions may be collapsed into a single position in slow periods as
will Cooks in adjacent stations who can help each other out. Line Cooks slide up and back
between the cookline and the prep kitchen depending upon business volumes and the time of
day. However, Cooks working at opposite ends of the cookline cannot share work in the peak
rush because the physical barriers of crossing other stations and the risk of leaving a station
unattended is an unacceptable risk. Further examples of deployment rules include minimum
staffing during slow periods for Hosts at the front door and Bartenders in the bar.

Analyze Staffing Performance by Position
With each CLM component linked, the CLM System can be forward looking and predict labor
requirements for scheduling by simply forecasting the Labor Drivers based on historical
purchase patterns. It can also generate after-the-fact reports of how much “ideal” labor should
have been used based on actual guest purchases recorded through the point-of-sale from the
prior day. This is contrasted with time attendance data of the “actual” numbers of employee
positions on the clock throughout the day. A variance analysis contrasting Ideal vs. Actual
Staffing gives management an expedient picture of their staffing performance based on, and
this is key: when guests arrived, what and when orders are placed, how long they occupy tables
in a section, and when they depart the restaurant. Logically this is performed by revenue
center – reporting the bar separate from the dining room for example.

                                               6
Deterministics White Paper
                                               Introducing a New Era of “Contextual” Labor Management

Manager Interpretation
The next step for managers is to review data. The graphical illustration below shows previous
day business patterns. This validates for management that the output from the labor recipes is
correct. In other words, the shape of the graph matches their memory of the previous day
business patterns in arriving guests, occupied tables, kitchen orders, bar orders and so forth.
The Server data shows occupied tables in the dining room by fifteen minute segments. A
Manager may remember that after the peak dinner rush from 5:30 to 7:15 there was a second
push at 8:30. Note how quick and easy it is to interpret staffing performance with a graphical
illustration. In this case, the manager can see she was overstaffed by one Server from 6:00 to
7:45. The calculation of Occupied Tables per Server in blue at the top of the graph indicates
Server utilization reaching just 3.5 tables of the Server’s 4 table capacity.

                                               7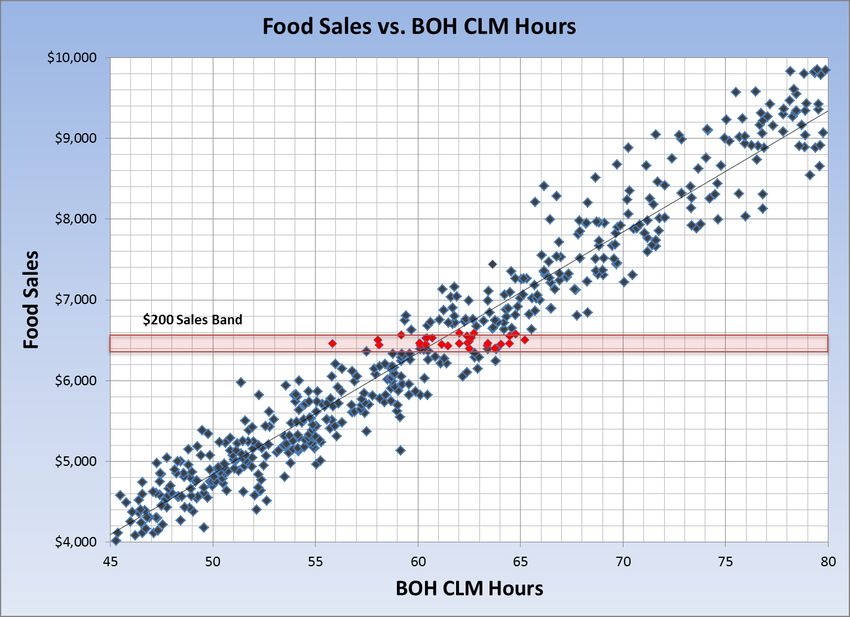
Deterministics White Paper
                                              Introducing a New Era of “Contextual” Labor Management

Allocation of Non Contextual Work
Full function CLM Systems have the ability to display when fixed work (set up / tear down) and
prep work should be performed throughout the day. This is a good example of where the
Deployment Rules play a role. If certain pre-opening fixed and prep work must be completed
prior to opening the doors, the system will show the time staff must be scheduled for the work
to be completed. In the graphic below, Back of House (BOH) fixed and prep work is displayed in
brown with guest preference work in yellow. Note that three Cooks had to be scheduled in at
4:00 for pre-opening work, and that the kitchen was understaffed by one Cook from 6:30 to
7:30.

                                              8
Deterministics White Paper
Introducing a New Era of “Contextual” Labor Management
Contextual Labor Management Framework
The CLM Framework provides language for describing the components of the system and
distinction between contextual and non contextual work:
Aren’t Sales and Productivity Metrics Close Enough?
Some will argue that in the absence of a CLM solution, and with only point-of-sale metrics to
work with, the metrics available will get them “close enough.” So we decided to measure if
“close enough” is “good enough” and let the reader decide.
For purposes of this study we have used a hypothetical 100 unit full service restaurant chain.
The analysis is based on actual data which has been modified to eliminate the impact of wage
rate variances, menu pricing variances and any similarities to existing operations.
Choosing Labor Metrics
Restaurant companies typically use labor percent of sales (Labor %) and productivity metrics
segmented in “sales bands” for labor standards. Productivity metrics for the Front of House
(FOH) include Sales per Labor Hour (SPLH) and Guests per Labor Hour (GPLH). Productivity
metrics for the BOH include Sales per Labor Hour (SPLH) and Plates per Labor Hour (PPLH).
9Deterministics White Paper
Introducing a New Era of “Contextual” Labor Management
Restaurants have relatively high fixed hour requirements for opening and closing activities, pre-
preparation of products and general cleaning regardless of business volumes. As such,
productivity of low volume stores is penalized with minimum fixed hours that make up a larger
proportion of total work hours. By contrast, high volume stores exhibit higher productivity as
fixed hours become a smaller proportion of total work hours. For this reason, companies will
develop productivity standards in sales bands where the productivity metric is assumed to be
stable. If all guest purchases and behaviors were stable this method would work. But the
reality is that guest preference for customization results in divergent outcomes, both
productivity and labor % within sales bands. This is due to differences in arrival rates, party
size, table turn speed, order sequencing and timing, work intensity of menu items, sub-recipes
and so on. To understand the degree of variability that guest preferences impact, we selected a
group of stores in a similar sales band to compare the outcomes.
In the absence of a CLM System, restaurant companies must rely on historical performances
from which to base their productivity models. These may be based on significant empirical
data, cherry picked metrics by seasoned management, or a combination of both. In any case,
the ability to choose standards that reflect the true potential of the brand is hard work and, in
the absence of contextual information, an educated guess. We have the advantage of using
contextual-based data to display the results of different stores. The variances can then be
considered a “best case” scenario of outcomes over and above metrics chosen by a seasoned
management team.
CLM versus Labor Metric Standards Comparisons
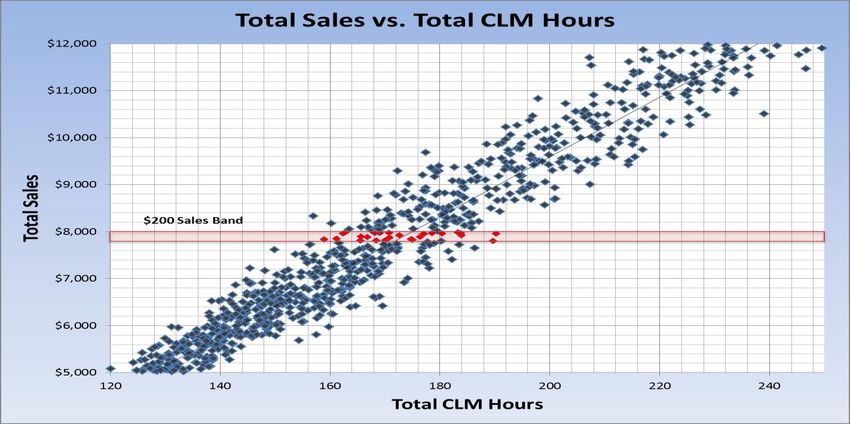
Daily sales by restaurant and recipe-based CLM hours are plotted below for a sample week of
all company stores. The distribution of food and beverage sales and CLM hours reveal
differences in staffing driven solely by differences in guest preferences and guest behaviors.
10Deterministics White Paper
Introducing a New Era of “Contextual” Labor Management
Front of House Comparisons
For FOH comparisons, a band of stores sharing comparable daily sales within $200 of each
other was selected. The group was made up of 18 stores ranging in daily food and beverage
sales from $7,804 to $7,988. FOH positions for this company included Host, Server, Runner,
Busser, Bartender and Take Out. In the chart below, daily food and beverage sales are plotted
against CLM hours to reveal recipe driven variances in store required hours at nearly identical
sales volumes.
11Deterministics White Paper
Introducing a New Era of “Contextual” Labor Management
The chart below provides a view of FOH required hours and the corresponding labor % and
productivity within the $200 sales band. The high, low and high/low variance for each metric
show the variability of output and cost associated with each store’s performance.
FRONT OF HOUSE COMPARATIVE RESULTS
FOH FOH Sales per Guests Average
Sample Total Average
CLM Percent of Labor per Labor Table
Number Sales Party Size
Hours Sales Hour Hour Turn
1 $7,804 126.9 6.58% $61 4.1 64 3.3
2 $7,814 106.0 5.49% $74 4.4 56 2.8
3 $7,827 115.8 5.98% $68 3.9 72 3.7
4 $7,838 100.5 5.19% $78 4.5 67 3.1
5 $7,841 111.8 5.76% $70 4.6 59 3.1
6 $7,854 102.0 5.25% $77 5.0 66 3.3
7 $7,892 114.9 5.89% $69 4.5 51 3.0
8 $7,897 105.5 5.40% $75 3.8 73 2.9
9 $7,924 121.9 6.22% $65 4.4 59 3.2
10 $7,924 112.9 5.76% $70 4.6 60 3.4
11 $7,960 127.9 6.50% $62 4.3 56 3.0
12 $7,962 115.8 5.88% $69 4.2 58 3.0
13 $7,968 120.3 6.11% $66 4.3 58 2.8
14 $7,969 114.9 5.83% $69 4.4 51 3.2
15 $7,973 106.6 5.41% $75 3.9 67 3.1
16 $7,974 113.0 5.73% $71 3.3 95 3.7
17 $7,978 111.5 5.65% $72 3.7 62 2.5
18 $7,988 122.9 6.22% $65 4.4 60 2.7
HIGH $7,988 127.9 6.58% $78 5.0 95 3.7
LOW $7,804 100.5 5.19% $61 3.3 51 2.5
VARIANCE $184 27.4 1.39% $17 1.7 44 1.2
VAR % 2.4% 27% 27% 27% 52% 87% 50%
12Deterministics White Paper
Introducing a New Era of “Contextual” Labor Management
Back of House Comparisons
For BOH comparisons, the different band of stores sharing comparable daily sales within $200
of each other was selected. The group was made up of 28 stores ranging in daily food sales
from $6,400 to $6,591. BOH positions for this company included Line Cook, Prep Cook,
Expeditor and Dishwasher. Food sales are plotted against required hours to reveal recipe-
driven variances in store, required hours at nearly identical sales volumes.
13Deterministics White Paper
Introducing a New Era of “Contextual” Labor Management
The chart below provides a view of BOH CLM hours and the corresponding labor % and
productivity within the $200 sales band. The high, low and high/low variance for each metric
show the variability of output and cost associated with each store’s performance.
14Deterministics White Paper
Introducing a New Era of “Contextual” Labor Management
CLM Versus Labor Metric Standards Conclusion
It is clear from the CLM and metrics comparisons that a one-size-fits-all metric, even within
bands of comparable sales volumes, will yield unreliable results in most cases. Labor standards
such as labor % and productivity metrics are historical measures developed “top down”, in
absence of more accurate methods. Time study-based CLM data that reflects guest
preferences and a manager’s operating environment is a “bottom up” approach that presents
an unambiguous and inarguable portrayal of staffing requirements.
Reconciling CLM with the Profit & Loss Statement
We all understand that labor costs are a major component of restaurant company profitability.
Under the CLM approach labor cost reflects the real cost of doing business according to
established brand standards. To the extent that labor costs exceed an acceptable level, CLM
provides the tools to understand and correct the root cause of inflated labor cost beyond the
impact of wage rates. This way an intelligent review of all cause and effect labor variables that
affect profitability can help the company redirect the outcomes in a way that are acceptable,
and achievable, for all stakeholders. This important topic will be explored in detail in a
subsequent installment.
Summary
CLM Systems give restaurant companies the keys to the kingdom of labor standards accuracy by
basing staffing performance on how guests choose to use the experience. In an era of
increasing customization, labor standards that reflect the customer experience will achieve a
higher degree of buy-in from management. They also enable zero based modeling of labor cost
for the company P&L. CLM Systems provide a new path forward for achieving staffing success
for the manager, the customer, and the company.
######
Deterministics is the leading provider of CLM based labor management consulting services and
software solutions for the multiunit restaurant operator.
For more information, visit www.deterministics.com or call 1.800.322.4146.
© 2012 Deterministics, Inc. All rights reserved.
15You can also read