The shifting nature of South Africa's landscape: a 24 year snapshot of land and ecosystem change - Africa Natural Capital Accounting Community of ...
←
→
Page content transcription
If your browser does not render page correctly, please read the page content below
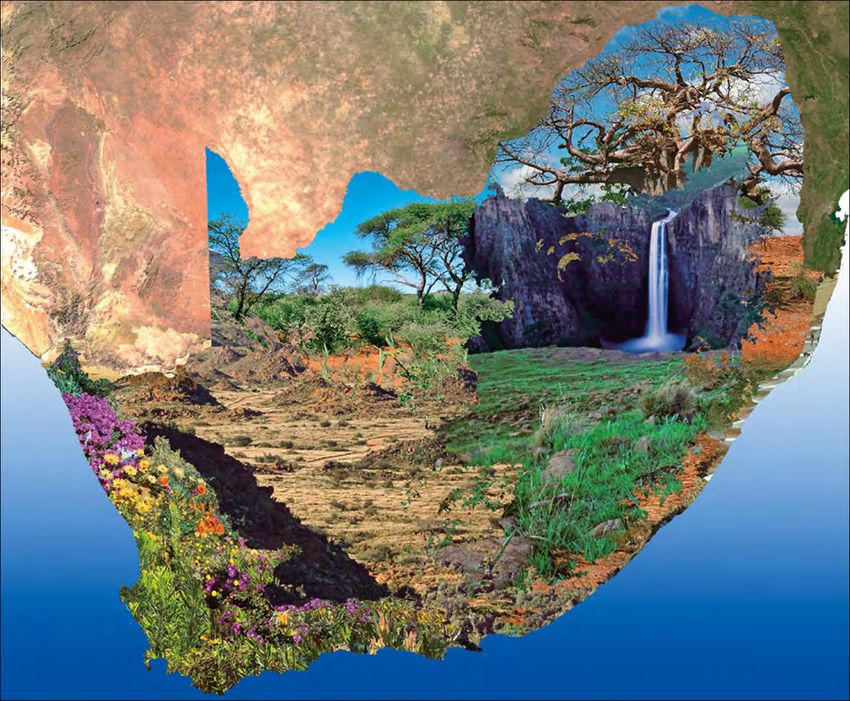
The shifting nature of South Africa's
landscape: a 24 year snapshot of land
       and ecosystem change
                     10 December 2020

 Africa Natural Capital Accounting Community of Practice
         New Country Experiences Webinar Series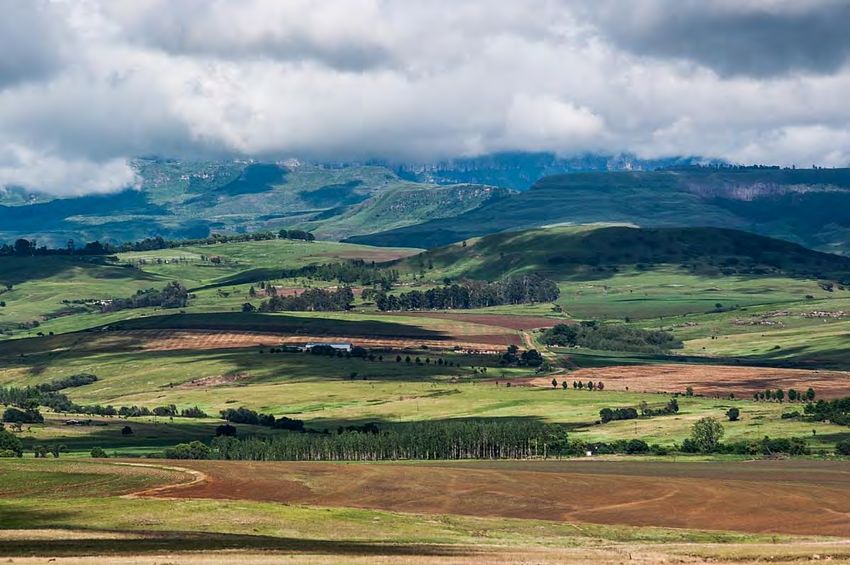
Land and Terrestrial Ecosystem Accounts,
1990 to 2014
• Released on 2 Dec 2020 in Natural Capital series

• Natural Capital Accounting and Valuation of Ecosystem Services (NCAVES) project

• In South Africa, led jointly by Statistics South Africa (Stats SA) and the South
  African National Biodiversity Institute (SANBI), in collaboration with the
  Department of Environment, Forestry and Fisheries (DEFF) and a range of
  national and sub-national stakeholders.
Shifting nature of SA’s landscape: a 24 year
snapshot of land and ecosystem change

• Aimee Ginsburg, SANBI: Introduction

• Gerhardt Bouwer, Stats SA: Developing the land and terrestrial
  ecosystem accounts: process and partnerships

• Nokuthula Mahlangu, SANBI: South Africa’s approach and
  methods for compiling the land and terrestrial ecosystem
  accounts

• Mandy Driver, SANBI: The shifting nature of South Africa’s
  landscape: key indicators and findings from the accounts

• Department of Environment, Forestry and Fisheries (DEFF):
  Reflections on value and application of the accounts
Developing the land and terrestrial ecosystem
    accounts: process and partnerships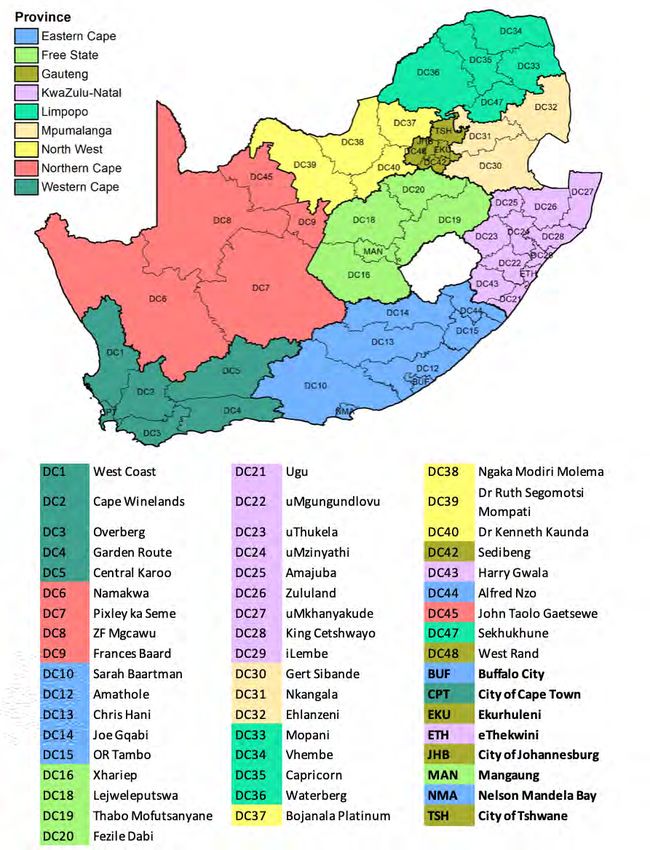
“The future of policymaking and implementation is upon us and
experience has taught us that without measurement, our boat will not
     sail far.” (Mr Jackson Mthembu, Minister in the Presidency)

 Stats SA Strategic Plan (20/2021 – 2024/25) vision: ‘Improving lives
                       through data ecosystems’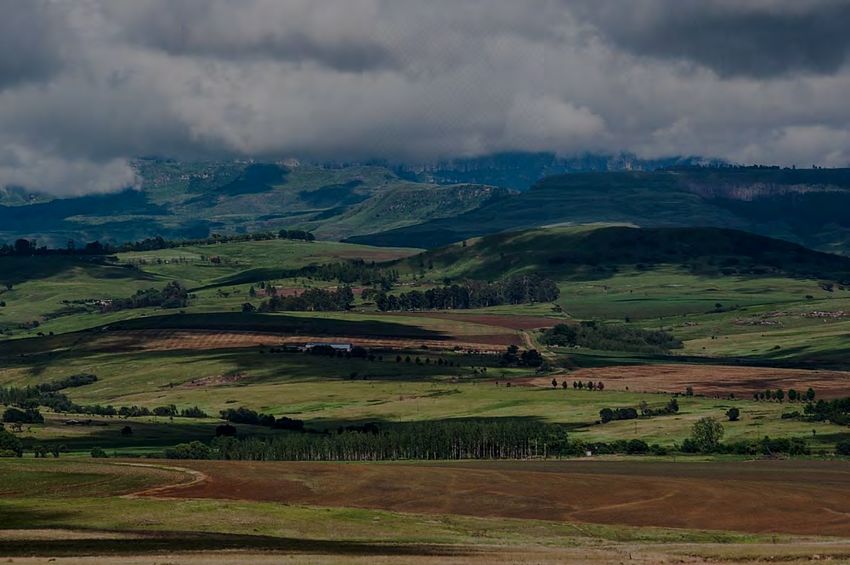
Statistics South Africa investment in NCA                                                                       Updated Water
                                                                                                                Accounts for SA
                                                                                                                                                 Biodiversity
                                                                           Land and Terrestrial                                                    Tourism
                                                                               Ecosystem
                                                                                Accounts           Accounts for
                                                      Water accounts for
                                                                                                  Protected Areas           3. More
                                                             SA
                                                                                                                             4. Going
                                                                                                                            recently
                                                                                                                                                         Accounts for
                                                                                                                                                        Strategic Water
                                 Mineral                                                                                      forward                    Source Areas
                               accounts for
                 Energy
                                   SA                                            3. More
               accounts for
   Water                                                                         3. More
                   SA                                                            recently
accounts for                                                                     recently                                                        Marine Ecosystem
    SA                                                                                                                                               Accounts
                                                                                                                                    Satellite
                                                                                                        Land accounts for         Account for
                                 2. Little                                                                Metropolitan            Biodiversity
                              steps added                                                                 Municipalities           Economy
                                                               National River
                                                            Ecosystem Accounts        Accounts for
 1. Small                                                                            Species: Rhino
beginnings                                                                             & Cycads
                                   Fishery accounts
                                        for SA

 2000                                                                                2020                           2021                         2022

                                  Advancing NCA (ANCA) Project                       NCA & Valuation of ES (NCAVES) Project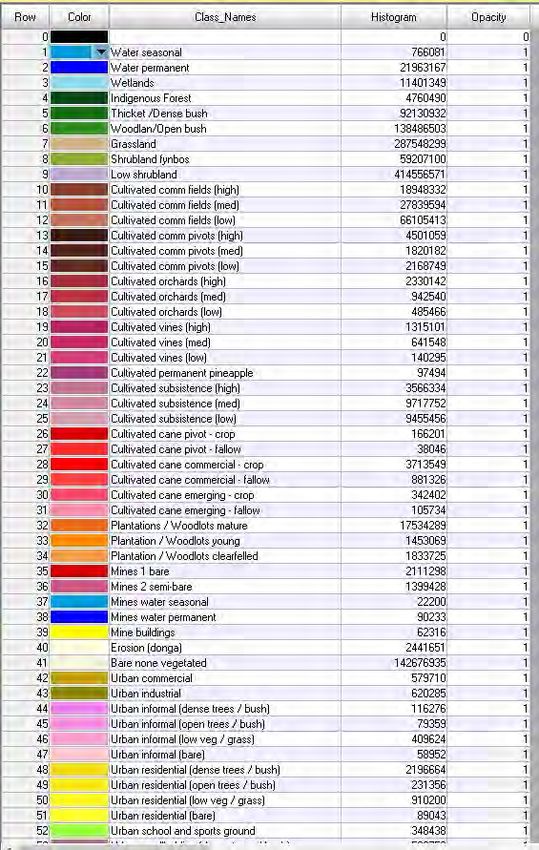
How did we coproduce the Land and
Terrestrial Ecosystem Accounts?
1. Different institutional mechanisms to deal with different parts of
   the project, enabling involving a broader group of people without
   burdening everyone in the same way.
2. Meetings facilitated in a way that enables sharing of perspectives,
   discussion and learning.
3. Focused responsibilities.
4. Sharing with an ever broader audience as we went to share, get
   feedback and stretch ourselves.
Institutional mechanisms for the NCAVES Project
in SA     Project
          Reference
                        5
                                                    EU          UNSD       UN Environment
                                                                                                 Dept of Environment,
                                                                                                 Forestry & Fisheries
                             Group

                                       Reports
                                                                                                                             Would also create short-term

                                         to
     PMU+                                                       1
                                                                                                                             task teams to tackle specific
                     Project Management Unit                                           Global project team     4             technical issues, as needed.
2                                                                      Reports to       support meetings
                              (PMU)
                     Gerhardt Bouwer             Mandy Driver
                        (Stats SA)                 (SANBI)                     Other SA support to NCAVES Project

                    Robert Parry               Thuli Mahlangu                       Stats SA             SANBI
                     (Stats SA) Aimee Ginsburg    (SANBI)
    Report to

                                 (UN contract)
                                                                               Department of         Department of
                                                                              Environment and       Agriculture, Rural
                SANBI consultants                                                                   Development and
                                                        Stats SA                  Fisheries
                       NCA specialists                    staff                                       Land Reform
         NCA                                            regularly                                    (National Geo-
        expert      •Anchor Environmental                                      Department of             spatial
                                                       supporting
        advisor          Consultants                                           Monitoring and         Information)
                                                       the project
                       •GeoTerraImage                                           Evaluation

                                                                                                                         3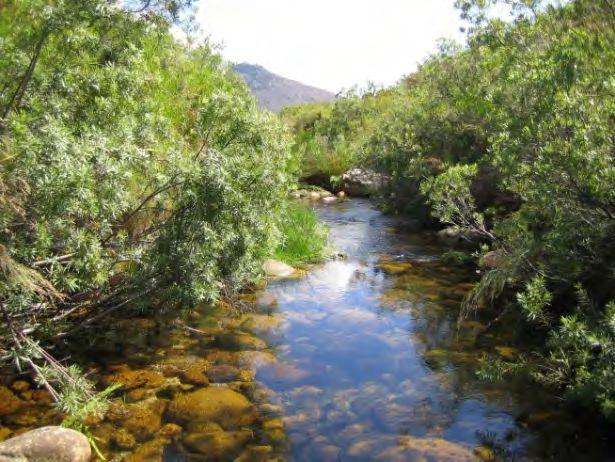
2. Meetings facilitated to enable social
 process of learning and information sharing
 • Meetings of the different groups mentioned in previous slide
 • Also involved wider stakeholders in the process

National Stakeholder Workshop (19 March)   National Training Workshop
      • >70 people & 30                    • 21-23 May 2019
            organisations
                                           • 27 participants across 14 institutions
 • Used voting/ranking,
    in combination with
     assessment of data
  availability and policy
         applications, to
   prioritise accounts to
            be produced.
Focused responsibilities
• Enabled by allocation of resources (skill sets where it was applicable
  and needed from different resource persons and different line
  ministries and institutions).

• Project Manager (Aimee Ginsburg) was crucial for coordination and
  the success of the NCAVES project (Land and Terrestrial Ecosystem
  Accounts were a deliverable of the NCAVES project).
Sharing with a wider audience including users
of the information from accounts
 • E.g. at the National NCA Forum in 2019:
    • 131 Forum participants
    • 24 institutions
 • presenting the draft results and getting feedback highlighted a range
   of useful things that made the final accounts better.
 • Feedback helps!
What worked well about multi-institutional meetings • A platform that bring together various partners together to take ownership on NCA. • Working together with the national partners in mainstreaming NCA through an official platform that brings people together. • Provided really valuable strategic guidance and helped to clarify roles. • Virtual meetings worked well. • It was useful to have a relatively small Project Reference Group (PRG) with consistent membership over the course of the project. • Communication (constant information sharing and role-players involvement).
Concluding comments: collaborative coproduction

               • Would not have been possible without
                 partnership and collaboration
               • Meets Stats SA’s standards through application
                 of the SEEA and national classification systems
               • At a time of resource constraint, even more
                 important to collaborate and build
                 partnerships with strategic entities in the state,
                 private sector, in Africa and internationally to
                 further advance NCA in SA
Concluding comments: Future partnering • Embrace partners as data providers, compilers of accounts or users of information from accounts to drive advancement of NCA. • Able to inform partners on the link between economy, society and environment. • Able to coordinate among producers of official and other statistics in order to advance quality, comparability and optimum use of official statistics and to avoid duplication.
South Africa’s approach and methods for
compiling land and terrestrial ecosystem
        accounts, 1990 to 2014
Outline 1. Spatial framework for accounts 2. Foundational data layers 3. Summary of the methodology
Spatial framework for accounts in
           South Africa
Spatial framework for accounting • Spatial framework provides the key for integrating environmental, social and economic information to inform decision-making. • A key feature is the integration of spatially referenced data, such as • data about the location, • size and condition of ecosystems within a given area, and • change occurring over time. • The spatial framework for accounting in South Africa includes: 1. A basic spatial unit to divide the country up into the smallest units practicable 2. Ecosystem accounting area 3. Sub-accounting areas
Basic Spatial Unit
• A geospatial construct to which a range of                               BSU layer
  different spatial data and information can be                            100m x 100m
                                                                           = unit for analysis to
  attributed
                                                                           which all data gets
• Set of grids with a standardised set of coordinates                      synthesized
  & known projection that fully overlaps the
  country’s terrestrial and marine areas
• Consistent and independent framework
                                                            1990                 2014
• Used to look at change in                                 *                    *

  each cell over time
                                                                       *                    *

                                                                       *                    *

                                                                       *                    *

                                                        *                   *

                                                            *      *             *      *
South Africa’s sovereignty includes • the mainland and its Exclusive Economic Zone (EEZ), • sub-Antarctic territory of Prince Edward Islands (PEI) and its EEZ, and • The continental shelf claim
BSU 1 (728 million 100m cells):
South Africa + EEZ + Transboundary basins
                                                            Basic Spatial Unit (BSU) in SA
                           BSU grid 1                           •   Two grids to cover SA’s extent = complete possible
                                                                    ecosystem accounting area.

                                                                •   Available from Stats SA

                                                                •   This spatial framework (BSU) has been adopted as
                                     1                              part of part of National Spatial Data Infrastructure

                           2

                          Ecosystem accounting area
                         for the Land and Terrestrial
                       Ecosystem Accounts
          1: SA mainland                                3

          2: SA marine (EEZ and continental shelf
          claim)                                            4
                                                                                        BSU grid 2
          3: Prince Edward Islands
                                                                                BSU 2 (624 million 100m cells):
          4: Prince Edward Islands marine (EEZ                                  South Africa’s Prince Edward Islands + EEZ
          and continental shelf claim)
Delineating the mainland ecosystem accounting area
• Inland borders:
• Determined official data from the Demarcation
Board.
• Coastline: SA mainland
• Defined based on the National Ecosystem
Classification System.
• The dune base separates the backshore and the
shore and is considered the ecologically
meaningful interface between the terrestrial
and marine realm.
Source: Harris et al. 2019Geospatial
• Refers to a nested hierarchy of administrative units
information frame • Provides sub-accounting areas: Provinces and Municipalities
for SA
Province Spatial data from the Municipal Demarcation Board (MDB)
District Municipality
Metro and Local Municipality
Main place Spatial data from Statistics SA Geography Unit
Sub-place Place names specify location using a name
Small area Small Area Layer (SAL) EAs aggregated to confidentiality levels for dissemination
Enumeration area Enumeration Area (EA) a manageable workload for one enumerator
Structures Dwelling Frame a register of the spatial location of structures
Source: Statistics South AfricaFoundational data layers
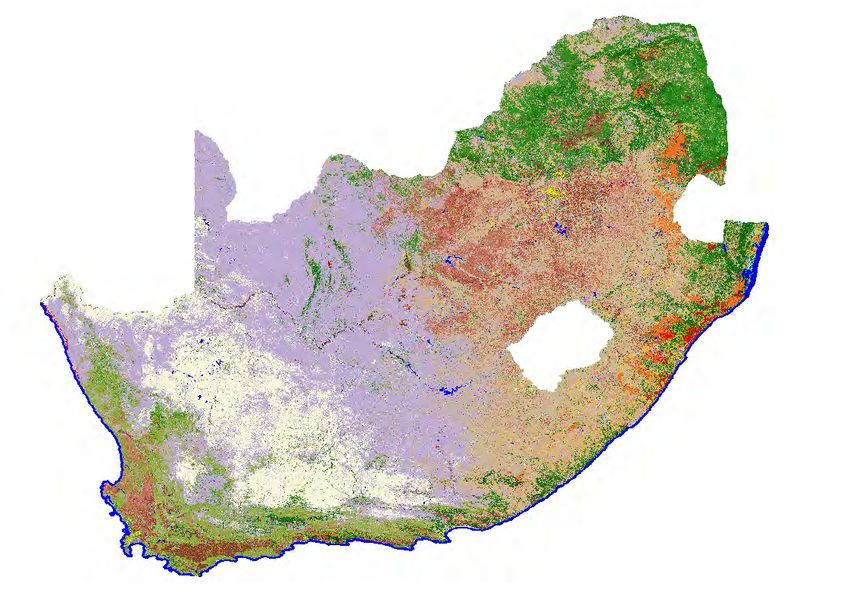
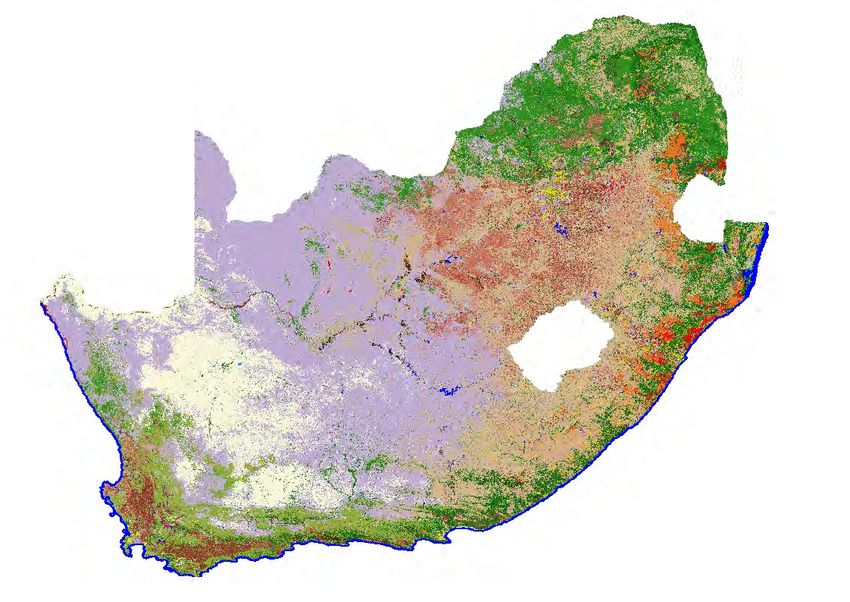
Foundational data layer: National Land Cover

 1990                            2014
  Developed
retrospectively
    in 2016

                                     Recently available
                                              for 2018
Foundational data layer: National Land Cover (cont.) National Land Cover datasets for 1990 and 2014: 72 classes 30m, resampled to 100m BSU
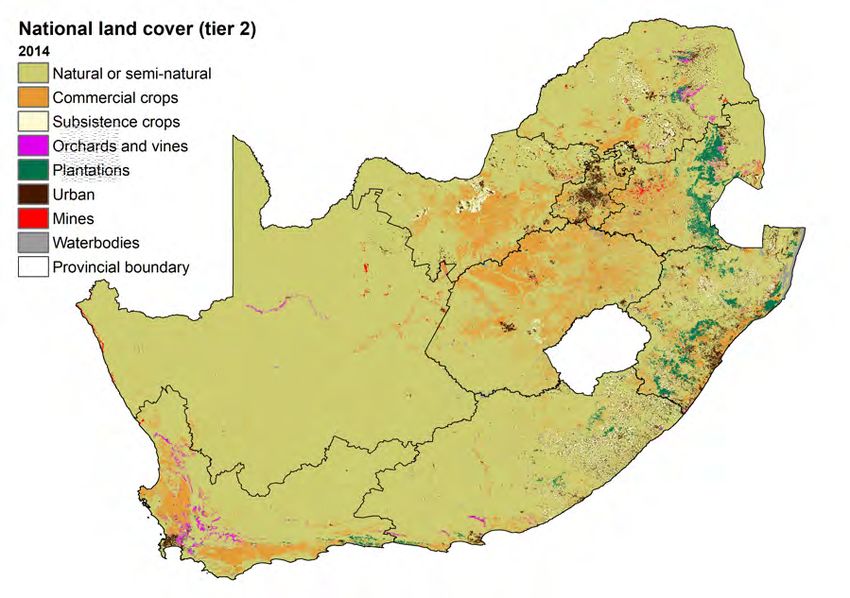
Foundational data layer: National Land Cover (cont.)
Grouping of 72 National Land Cover classes into nested tiers for land accounts

                                                                Natural or semi-natural
                                                                classes grouped as a single
                                                                class at Tier 1, 2 and 3

                                                                Classes in tiers 1, 2 and 3:
                                                                • aligned with intensity
                                                                   of ecological impact
                                                                • link to socio-economic
                                                                   drivers in the landscape
                                                                   as far as possible
Foundational data layer: National Vegetation Map
458 terrestrial ecosystem types,
represented by vegetation types
à Ecosystem types
delineated based on
historical extent,
prior to major
human modification
Terrestrial ecosystem types
are grouped into 9 biomes àSouth African National Ecosystem Classification System (SA-NECS)
integrates ecosystem classification and mapping across realms
Realm Classification system name
Terrestrial National Vegetation Map
Inland aquatic Classification system for
(freshwater) wetlands and rivers
Estuarine Ecosystem Classification for
South African Estuaries
Marine Marine Ecosystem Classification
The coast is a cross-realm zone that
includes elements from all four realms
Approach broadly equivalent across all realmsCompiling accounts
Compiling the accounts
consistent spatial framework for
integrating data

                                       Environmental Systems Modelling
                                       Platform                           Preparing   •   Pre-processing of baseline spatial data (ArcGIS)
                                                                          accounts-   •   Verification of spatial data (EnSym)
                                                                         ready data   •   Conditioning of spatial data (EnSym)

                                   •     Land cover
                                   •     Terrestrial ecosystem                        Producing
                                   •     Demographic and Economic
                                                                                                      •   Production of accounts (EnSym)
                                                                                      accounts        •   Export accounts tables and change matrices (Excel)
                                                                                        tables

                                                                                                       Table            •   Additional formatting and analysis of
                                                                                                    formatting &            accounts tables (Excel)
                                                                                                      analysis

                                                                                                                        Visual          •    Produce graphics (Excel)
                                                                                                                     presentation       •    Create maps (ArcGIS)
                                                                                                                       of results
The shifting nature of South Africa’s landscape: key indicators and findings from the accounts
More on South Africa’s approach to
land and terrestrial ecosystem accounts
Land accounts and terrestrial ecosystem extent
accounts are two separate sets of accounts
• Land account
   • Focuses on changes in extent of intensively modified land cover classes, such
     as cultivated, urban and mined areas
   • Requires only the National Land Cover as foundational data layers

• Terrestrial ecosystem extent account
   • Focuses primarily mainly on changes in extent of natural or semi-natural
     ecosystem types
   • Mapped based NOT on current land cover but rather on the National
     Vegetation Map
Separating the land account from the terrestrial
ecosystem extent account requires…
1. Stable reference extent for natural ecosystem types
• In South Africa this reference extent is provided by historical extent (prior to
major human modification of the landscape)
• Delineated in National Vegetation Map
• Historical extent is contrasted with remaining extent in 1990 and 2014
• Remaining extent means the extent that is still in a natural or semi-natural
state
2. Dual perspective on intensively managed ecosystem typesDual perspective on intensively modified areas
à Seen as land cover classes in à Seen as intensively modified ecosystem types
the land account in the ecosystem extent account
• Tier 1 land cover classes • Intensively modified “biomes”
• Cultivated • Cultivated
• Built-up • Built-up
• Tier 2 land cover classes • Intensively modified “ecosystem
• Commercial crops functional groups”
• Subsistence crops • Commercial crops
• Orchards & vines • Subsistence crops
• Timber plantations • Orchards & vines
• Urban • Timber plantations
• Mines • UrbanNational-level accounting tables
This is the most
Land account for broad land cover classes (tier 1)     aggregated form of
                                                       the land account.
at the national level, 1990–2014, in hectares          It can be broken down
                                                       by province or
                                                       municipality.
                                                       The broad land cover
                                                       classes can be
                                                       disaggregated to tier 2
                                                       or tier 3 classes.

                                                        13%
By far the majority of South Africa’s
land area is natural or semi-natural
Not much change between 1990 and 2014
at the national level for tier 1 – BUT this
hides a lot of sub-national variation and
                                                                          83%
changes at tier 2 and 3                              2014
Extent account for terrestrial ecosystems summarised by biome
This is the most aggregated form of the ecosystem extent account.
Intensively modified biomes derived
Natural biomes derived from National Vegetation Map from National Land CoverIn addition to national-level accounting tables… • Many additional tables, maps and graphs included in the document, including: • Land accounts at provincial level • Summary of net change in land cover at the district level • Change matrices that show which land cover classes changed to which • Ecosystem extent account tables per biome • Underlying spreadsheets are freely accessible on Stats SA’s website for users who want to do additional analyses
Indicators and findings
drawn from the accounts
Indicators drawn from the accounts

                                                                                      Align fully with Chapter 14 of SEEA EA
                                                                                           (global consultation version)
1   Proportion of accounting area (SA mainland/province/municipalities)
    covered by specific ecosystem types or land cover classes
2   Net change in area covered by specific ecosystem types or land cover
    classes (ha and %)
3   Percentage of area unchanged for specific land cover classes
4   Percentage turnover in specific land cover classes

5   Ecosystem Extent Index for ecosystem types
                                        Suggested addition to Chapter 14 of SEEA EA
                                               (global consultation version)
6% 5%
1 Proportion of accounting area covered by
specific ecosystem types or land cover classes 28% 27%
Example for biomes 20%
2014 Historical reference
(prior to major human modification of the landscape)
Intensively modified
biomes have replaced
portions of natural
biomes
6% 13%
7%
32%
18%
20%2 Net change in area covered by specific ecosystem types or land cover classes
(expressed in absolute or percentage terms)
Example
Largest changes in natural
biomes 1990 – 2014
• Largest absolute decrease in
Grassland biome,
from 33m ha to 22m ha
• Largest percentage decrease
in Indian Ocean Coastal Belt,
from 1.2m ha to 0.6m ha2 Net change in area covered by specific ecosystem types or land cover classes
(expressed in absolute or percentage terms)
Examples: Some remarkable changes in intensively modified land cover classes 1990 – 2014
Centre-pivot irrigated cultivation increased
by 220%, from 240 000 ha to 770 000 ha
• Large ecological impacts including on water
Area of informal urban settlements almost doubled,
from 31 000 ha to 60 000 ha
• Significant challenges for urban planning and service
provision4 Percentage turnover in specific land cover classes
• Net change can disguise switches between land cover classes
• Small net change combined with high turnover indicates that although the total area of that land cover
class remained quite stable, there were probably locational shifts – the spatial distribution of the land
cover class may have changed
• This can indicate socio-economic changes in the landscape
Example: subsistence crops
• Net change in subsistence crops of only 1.1%
• from 1.95 million ha in 1990 to 1.97 million ha
in 2014
• BUT turnover was 46% - indicating substantial
changes in where cropping took place
• Change matrix and maps can provide
additional info to help interpret these shifts5 Ecosystem Extent Index for ecosystem types
• The percentage of an ecosystem type that remains intact relative to its reference
extent
• In SA the reference extent is the historical distribution of the ecosystem type
• Shows which ecosystem types have most declined in extent
• Tracked over time, shows which ecosystem types are declining in extent most
rapidlyEcosystem Extent Index can be evaluated against thresholds,
for example, a threshold for ecological functioning
100%
90% 67%
80%
Ecosystem Extent Index
48%
70%
60% Ecological
function threshold
50%
40%
30%
20%
10%
0%
o
nd
t
na
os
t
t
CB
oo
es
ke
r
o
se
nb
n
sl a
IO
r
ar
r
ic
Ka
De
va
Fo
tK
Th
Fy
as
a-
Sa
n
Gr
ny
m
le
Na
ba
ccu
Al
Su
Historical 1990 2014
Biomes or ecosystem types that falls below an ecological function threshold have
less ability to provide services and benefits to peopleEcosystem Extent Index can be evaluated against biodiversity targets
11 of South Africa’s 458 terrestrial ecosystem types have an Ecosystem Extent Index that is
less than their biodiversity target
100%
Proportion of historical extent
90%
80%
70%
Intensively modified ecosystem types
60% have replaced large proportions of the
50% historical extent of these ecosystem types
40%
30%
20%
10% Remaining natural or semi-natural area
0%
)
s)
s)
s)
s)
s)
s)
o)
a)
t)
s)
nd
er
bo
bo
bo
bo
bo
bo
bo
ro
nn
Biodiversity target = minimum proportion of the
la
es
Ka
yn
yn
yn
yn
yn
yn
yn
a
ss
av
(D
(F
(F
(F
(F
(F
(F
(F
ra
t
(S
en
1
(G
1
2
0
1
2
3
s9
historical extent of an ecosystem type that must
Dn
s5
c
c
s1
s1
s1
s1
l
cu
FR
FR
FR
14
FR
FR
FR
FR
SV
uc
Gh
(S
remain in natural condition in order to conserve
k8
Natural or semi-natural Cultivated
SK
the majority of species associated with that
Built-up Waterbodies ecosystem typeEcosystem Condition Index
Ecosystem Condition Index
      Ecosystem condition account has been compiled for rivers and estuaries in South Africa
      Consistent with three stage approach in draft Chapter 5 of revised SEEA EEA
      Ecosystem Condition Index based on several ecosystem condition indicators

                                        National River Ecosystem Condition Index
                                        Declined from 83% in 1999 to 72% in 2011

                                                                           National Estuarine Ecosystem Condition Index: 64% in 2018
                                                                                       Aggregated from nine estuary functional types

Driver & Nel 2015

                                                                                                           Van Niekerk et al 2020
Ecosystem Condition Index still challenging for terrestrial realm –
available data and methods are not consistent or reliable
For example…
Assumes that increase in NDVI indicates improvement in condition
Gives very different results
but often the opposite is the case in South Africa
Productivity ‘state’ 2014 using MODIS NDVI data Best available national estimate of rangeland
comparing 2001-2008 with 2009-2014, based on condition based on percentage change in NDVI over
Trends.Earth 30 years (Desmet & Venter 2019)Ecosystem Extent Index and Ecosystem Condition Index complement each other
Reference extent and condition Closing extent and condition
Impacted by
1 1 1 1 2 2 1 1 C C 2 2
Ecosystem accounting area (EEA) = 42 ha
invasive
Still close to woody trees
1 1 1 1 2 2 1 1 C C 2 C
natural state
1 1 1 2 2 2 1 1 C C 2 C
1 1 2 2 2 2 1 1 C 2 C 2 Impacted by
pesticide run-off
1 2 2 2 2 2 Parts of ecosystem 1 2 C 2 C 2 from nearby
fragmented by
cultivated fields cultivated fields
2 2 2 2 2 2 2 2 C C C 2
2 2 2 2 2 2 2 2 C C C 2
Ecosystem types Reference extent: Closing extent: Ecosystem Extent Index (EEI):
ET1: Historical = 14 ha (EEI = 100%) ET1 = 9 ha ET1: EEI = 9/14 = 64%
1 Savannah (ET1)
ET2: Historical = 28 ha (EEI = 100%) ET2 = 13 ha ET2: EEI = 13/28 = 46%
2 Grassland (ET2) Reference condition: Closing condition: Ecosystem Condition Index (ECI):
ET1: Natural (ECI = 100%) ET1: Still largely natural ET1: ECI = 86% (for example)
C Cultivated* ET2: Natural (ECI = 100%) ET2: Range of negative impacts ET2: ECI = 50% (for example)
* This diagram doesn’t deal with how an Ecosystem Extent Index and Ecosystem Condition index would be established for an intensively managed ecosystem type such as cultivated landFoundational data layer of ecosystem types…not out of reach
Partnership project between SANBI and UNEP-WCMC, 2017-2019
Mapping Biodiversity Priorities in Africa                Factsheet (recently available)

 Guidance book in 2016: includes spatial
    assessment of ecosystem status –
 intended for data constrained contexts

                                       Piloted in collaboration with
                                       Botswana, Ethiopia, Malawi
Maps of ecosystem types developed in all three countries, with modest resources, drawing on the expertise of in-country ecologists
A peek at what’s in the pipeline
Stats SA’s Natural Capital series

                                                                 • First publication in Stats SA’s new Natural Capital
                                                                   series
                                                                 • Upcoming publications:
                                                                    •   Accounts for Protected Areas, 1900 to 2014
                                                                    •   Accounts for species: Cycads, 1970 to 2010
                                                                    •   Accounts for species: Rhinos, 1970 to 2017
                                                                    •   Land accounts for Metropolitan Municipalities, 1990 to 2014
                                                                    •   Accounts for Strategic Water Source Areas, 1990 to 2018
                                                                    •   Updated national water accounts
  NATURAL CAPITAL 1
  National Land and Terestrial Ecosystem Accounts 1990 to 2014
                                                                                           NATURAL CAPITAL 4
                                                                                           Accounts for Species: Rhinos, 1970 to 2017
National NCA Strategy
A ten-year strategy for advancing NCA in South Africa
• Purpose: to focus the efforts of Stats SA and partners engaged in NCA
on
• developing priority national-level natural capital accounts
• to inform South Africa’s sustainable development policy objectives.
• 10-year time frame with a 5-year review.
GOAL 5 GOAL 1
GOAL 4 GOAL 2
GOAL
3VISION: NCA is widely used to provide credible evidence for integrated planning and decision-making
in support of the development needs of the country
1.1. Increase the use of natural capital accounts-
5.1. Strengthen institutional based indicators and information for high-level
arrangements to advance NCA…… and sectoral policies and planning
GOAL 5 GOAL 1
5.2. Collaborate to increase national and NCA is well NCA is used for
resourced under- integrated planning, 1.2. Stimulate public discourse with
donor-funded support for NCA…. information from NCA
pinned by effective and decision-making,
collaborative institutional monitoring and evaluation
arrangements across a range of sectors
2.1. Analyse and interpret NC
Cham- Commu- GOAL 2 accounts to provide useful stats
GOAL 4 pion nicate
Capacity and NCA offers and info
4.1. Gather, synthesize and improve Co- Collabo- credible evidence
data for 2.2. Make NC accounts and
accounts-ready data accounts are create rate of how nature
associated data and information
well developed supports people
and the
widely available
and robust
4.2. Increase capacity and skills to… GOAL 3 economy 2.3. Contribute lessons & guidance
produce and advance NCA An integrated suite of to national, regional and global
NC accounts are produced community
based on best available
methods
3.2. Adopt, develop, standardise and document 3.1. Regularly produce and publish an
methodologies for producing NC accounts integrated system of NC accountsReflections on value and application of the
accountsThank you for listening!
The shifting nature of South Africa's
landscape: a 24 year snapshot of land and
ecosystem change
Discussion, reflections and comments welcomeYou can also read