GENDER IN THE 2011 SOUTH AFRICAN LOCAL GOVERNMENT ELECTIONS
←
→
Page content transcription
If your browser does not render page correctly, please read the page content below
GENDER IN THE 2011 SOUTH AFRICAN LOCAL
              GOVERNMENT ELECTIONS
                         By Colleen Lowe Morna and Ntombi Mbadlanyana
                                                      Gender Links

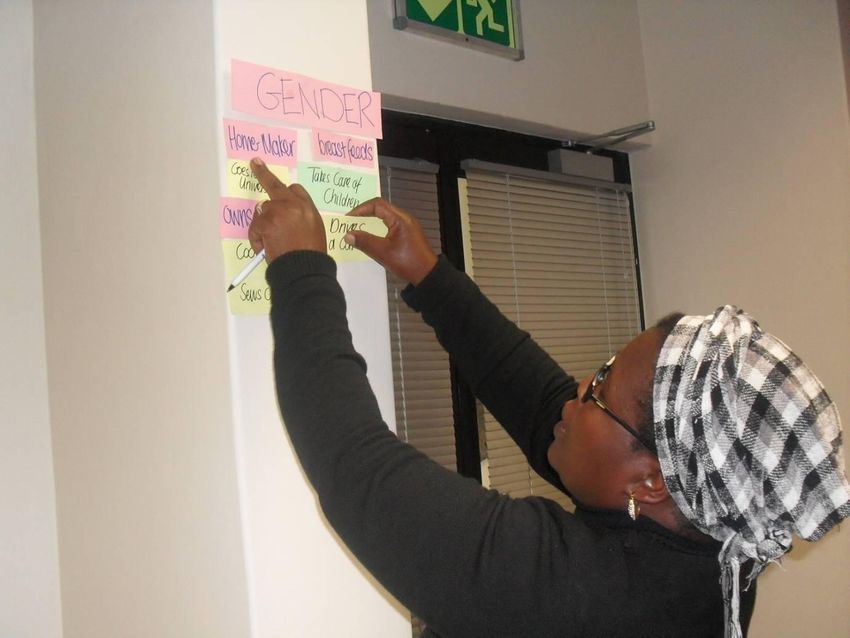
Centres of Excellence Gender Mainstreaming Workshop                  Ntombi Mbadlanyana

                                                                                          1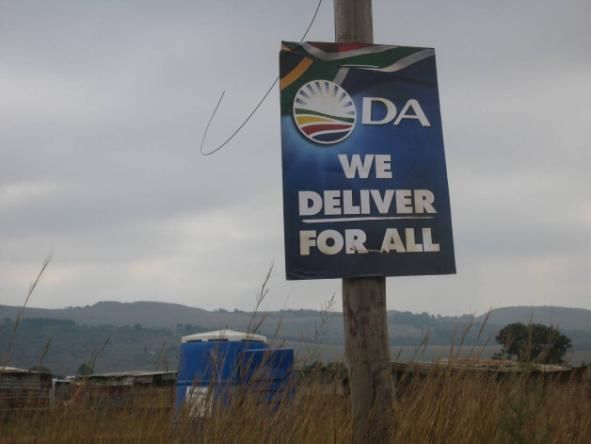
2
EXECUTIVE SUMMARY

                                                 The 2011 local government elections that
                                                 witnessed a decline in women’s representation
                                                 at the very moment that South Africa should
                                                 be redoubling its efforts to achieve gender
                                                 parity underscores the need for a legislated
                                                 quota for women in national and local
                                                 elections. This is the conclusion reached by
                                                 Gender Links (GL), the Johannesburg-based
                                                 research and advocacy organisation following a
                                                 gender analysis of the 18 May 2011 local
                                                 government election results.

                                                   The analysis shows that women now constitute
                                                   38% of councillors following the 18 May polls,
down from 40% in 2006. GL predicted this outcome to the exact percentage point, based on an
analysis of the likely decline in support for the African National Congress (ANC), the only party
that endeavoured (but even then did not quite succeed) in fielding equal numbers of women
and men candidates in both ward and PR seats.

Table one: Gender and local government in South Africa

           % women % women                % women
Year       ward    PR                     overall

1995       11%           28%              19%

2000       17%           38%              29%

2006       37%           42%              40%

2011       33%           43%              38%

Source: Gender Links 2011

Table one summarises gender and local government election results over the four municipal
elections since 1995. The table shows steady progress in the first three elections, with women’s
representation increasing from 19% in 1995 to 29% in 2000; up further to 40% after the ANC
adopted a 50/50 quota in 2006. Of particular significance in 2006 was the increase in the
representation of women in ward seats (where women traditionally do not do as well as in
Proportional Representation or PR seats) from 17% in 2000 to 37% in 2006. The decline in
women’s representation in ward seats from 37% in 2000 to 33% in 2011, and corresponding
overall decline of women’s representation by two percentage points is a bitter blow for the
50/50 campaign.

While the main opposition Democratic Alliance (DA) is led by two prominent women, Helen Zille
and Patricia de Lille (formerly leader of the Independent Democrats), the party opposes quotas.
The local elections again witnessed a war of words between Zille and the ANC over her having

                                                                                               3
an all-male cabinet in the Western Cape where she is premier, after de Lille moved from the
provincial cabinet to become mayor of Cape Town. Zille counter accused the ANC of fielding
very few women for mayors of the new councils.
The decline in women at all levels of local government comes against the backdrop of the 2008
Southern African Development Community (SADC) Protocol on Gender and Development (to
which South Africa is a signatory) that calls for gender parity in all areas of decision-making by
2015. Unless the ANC succeeds in its current endeavours to get national and local election
dates synchronised leading to an unexpected round of local elections along with the scheduled
national elections in 2014, South Africa has missed the chance (so tantalizingly possible) of
achieving the parity target at the local level on time, since the next local elections would
ordinarily be in 2016.
Ironically, as South Africa prepared for the 2011 local elections, Minister of Women, Children
and People with Disabilities Lulu Xingwana was put the finishing touches to the Gender Equality
Bill that would result in punitive measures for companies and individuals that do not meet the
government’s gender equality targets.
Yet the government did not seize the call made by NGOs, the Independent Electoral
Commission (IEC) and the Commission on Gender Equality (CGE) to legislate quotas for
women’s representation in South African elections so that this is not left to the whims of
political parties.
The gender analysis of the 2011 elections contained in this report demonstrates clearly how
leaving women’s representation to political parties is fraught with challenges, and why a
legislated quota is urgently required if South Africa is to meet its 2015 obligations.
4BACKGROUND
Municipalities in South Africa are a division of local government that lie one level down from
provincial government, forming the primary level of democratically elected government
structures in the country. South Africa has 284 municipalities, divided into three categories.
Municipalities can belong to one of three categories: metropolitan, district and local (referred to
in the constitution as categories A, B and C).
Metropolitan Municipalities
(Category A)
District Municipalities
(Category C)
Local Municipalities
(Category B)
Metropolitan- (or category A) municipalities represent large regions that encompass some
urbanised region or regions that might be regarded as a city
For example, the City of Cape Town in the Western Cape encompasses the city of Cape Town
other and surrounding towns.
There are six metropolitan municipalities in South Africa:
City of Cape Town
City of Tshwane
City of Johannesburg
eThekwini
Nelson Mandela Bay
Ekhuruleni
District Municipalities-(or category C)
A district municipality is a designation for a class of municipalities found in several
locations
A district council has municipal executive and legislative authority over a large area
For example, Aganang Local Municipality is contained within the District Municipality of
Capricorn, in the province of Limpopo.
Local Municipalities- (or category B)
Local municipalities share authority with the district municipality under which they fall.
5Electoral system
There are two main types of electoral system:
In the Proportional Representation (PR) or “list system” citizens vote for parties that
are allocated seats in parliament according to the percentage of vote they receive.
Individual candidates get in according to where they sit on the list. In an open list
system, voters determine where candidates sit on the list. In a closed list system,
the party determines where candidates sit on the list, although this is usually based on
democratic nomination processes within the party.
In the constituency or “First Past the Post” (FPTP) system, citizens vote not just for
the party, but also for the candidate who represents the party in a geographically
defined constituency. Thus a party can garner a significant percentage of the votes, but
still have no representative in parliament, because in this system “the winner takes all”.
In South Africa, national elections are conducted on a simple PR basis while local elections are
conducted on a mixed system that involves both the PR and FPTP system.
The mixed PR and FPTP system in South Africa is designed to harness the best of both electoral
systems (with the PR system more friendly to women and minorities and the FPTP enhancing
individual accountability). Initially however, this system disadvantaged women, as they
performed worse than men in the ward seats.
For metropolitan councils, each voter has two votes: one for the ward councillor (or candidate
of their choice) and the other for the PR vote (or party of their choice). For local councils, voters
have three votes: one for the ward, the other for the PR and the third for the district PR vote.
District councils are constituted on the basis of two PR votes by District Management Area
Voters plus one PR vote by local council voters and one representative from local councils. In
sum, metropolitan and local councils have an even split of ward and PR councillors while in the
case of district councils the split is 60:40.
Gender and local government elections
Initially, gender took a low priority in the complex
negotiations on how to restructure and transform local
government and did not feature in the debates on how the
electoral system would affect women’s representation.
As reflected in Table one, in the first local government
elections in 1995, women won a mere 11 percent of the
ward seats and 28 percent of the of the PR seats, for an
overall total of 19 percent (significantly less than in the 1994
national elections in which women won 27 percent of the
400 seats in the National Assembly).
At the time of negotiations on the White Paper on Local Government in 1998, the Cape Town-
based Gender Advocacy Project (GAP) raised a number of concerns with regard to women’s
representation as well as facilitating their effective participation in local government. GAP and
the Commission on Gender Equality (CGE), a constitutional body established to “promote and
6protect” gender equality, made a submission to the then minister responsible for local
government, Valli Moosa, on how the situation might be rectified.
The outcome of these negotiations is reflected in the Municipal Structures Act 1998. Given
women’s poor performance in the ward seats, one significant gain was to adjust the balance of
ward/PR seats in local and municipal councils from the original 60:40 ratio to the equal balance
described earlier in this chapter for local and municipal elections.
The Act fell short of legislating a quota as advocated by GAP and the CGE. However it required
that parties “seek to ensure that 50 percent of the candidates on the party list are women, and
that women and men candidates are evenly distributed though (sic) the list.” 1 The weakness
of this wording is that it encourages, but does not oblige parties to adopt a zebra system for the
PR seats, and places no obligation on them to field women candidates in the ward seats.
The influence has been especially felt within the ANC. While the party has shied away from
legislated quotas, it has been at the forefront of promoting women’s participation where it has
the influence to do so.
The ANC adopted a voluntary 30 percent quota for women in all three provincial and
parliamentary elections since 1994 and in local government in 1995 and 2000. While the quota,
used in combination with the PR system at provincial and national level, ensured over thirty
percent women in these spheres of politics, local government lagged behind because women
struggled to get in on the ward seats in local government.
However, in the 2006 local elections the ANC adopted a 50 percent quota for women.
Furthermore, it made a particular effort to ensure that women were elected on their own merit
in ward seats, narrowing the gender gap between the PR and ward seats and increasing the
overall representation of women in local government from 29 percent in 2000 to 40 percent in
2006. The ANC also adopted a 50/50 quota for national elections in 2009, resulting in an
increase in the proportion of women from 33% to 44%.
The ANC’s big achievement in the 2006 elections was not only to field 53 percent women
candidates overall (of whom 46 percent won) but to substantially increase the proportion of
women ward councillors to 40 percent of the total ANC ward councillors. The upshot (see Table
One) is that women ward councillors increased from 17 percent in 2000 to 38 percent in 2006
while PR councillors increased from 38 percent in 2000 to 43 percent in 2005 for an overall total
of 40 percent (compared to 29 percent in 2000).
1
Municipal Structures Act 1998, Schedule 2, Part 1, section 5(3).
7GENDER IN THE 2011 ELECTIONS
Women as voters
The IEC began voter registration from the 5 - 8 February
2011. Table two shows that a total of 547,651 voters
registered: 53% women. Western Cape, Limpopo and Kwa
Zulu-Natal registered the most female voters. Women
traditionally take an active interest in elections, especially
at the local level, as water, electricity and sanitation have a
direct bearing on their lives. The youth responded in full
force to the call to register and to the campaign to “Love
Your South Africa” endorsed by local celebrities and
musicians. Many political parties also made an effort to
target younger voters by creating campaigns specifically targeting these groups.
Table two: Women voters in the 2011 local elections
Province Female Male Total Women Men
Eastern Cape 34,944 31,704 66,648 52% 48%
Free State 13,097 11,336 24,433 53% 47%
Gauteng 56,630 52,413 109,043 51% 49%
Kwa Zulu-Natal 80,865 69,479 150,344 54% 46%
Limpopo 27,303 22,418 49,721 55% 45%
Mpumalanga 17,673 16,023 33,696 52% 48%
Northwest 16,147 14,336 30,483 53% 47%
Northern Cape 7,852 7,134 14,986 53% 47%
Western Cape 36,908 31,389 68,297 54% 46%
Total 291,419 256.232 547,651 53% 47%
Source: Independent Electoral Commission
Gender analysis of party manifestos
Political parties released their political manifestos pre the
election period to canvas their policies and programmes
to the voting public. These manifestos all promised to
improve the lives of people with infrastructural
development, housing, sanitation and improvement of
services. On the other hand, these manifestos failed to
indicate how they would l promote the mainstreaming of
gender into their various planned programmes and
projects, they also failed to show how they would
improve the status of women, whilst ensuring that
women had access to services and amenities to improve their living conditions. Some political
parties mentioned gender vaguely; some did not mention gender at all, whilst only one gave a
detailed account. Table three is a detailed analysis of gender in party manifestos:
8Table three: Gender analysis of election manifestos
PARTY QUOTA GENDER SPECIFIC GENDER MAINSTREAMED IN
REFERENCES IN MANIFESTOS MANIFESTOS
African National Committed to the 50: 50% More women are represented in The manifesto says that the ANC led
Congress quota to achieve gender – local government than ever before government will build a local government
(ANC) equality after the 2011 (42% of councilors are women) system that will give power to
local government elections. communities to make their voices hear
and to work with municipalities to make
change happen. In doing so municipalities
will need to ensure that there is equal
access to employment and skills
development for women and youth.
African Christian No Quota Only mentions women in terms of
No specific mention of how it plans to
Democratic Party increasing safety- ACDP will mainstream gender into the daily
(ACDP). prioritise efforts to increase the
activities. And it mentions these plans
safety and well-being of womenrather very vaguely by indicating that an
and children elected local councilor will support
community initiatives to help prevent
teen-pregnancy and offer assistance for
young mothers.
Democratic No Quota No mention of women in the Not mainstreamed at all no plans or
Alliance entire manifesto, not even in indications of how they plan to ensure
(DA) the introduction of the that effective service delivery will improve
manifesto. the lives of women.
Only focused on service delivery, No strategies in place main focus is on
reducing crime and providing service delivery and infrastructural
houses development
There is mention of providing
services to the poor and disabled
9PARTY QUOTA GENDER SPECIFIC GENDER MAINSTREAMED IN
REFERENCES IN MANIFESTOS MANIFESTOS
persons, and assisting them by
having rebate rates.
Freedom Front Plus No quota. No mention of women in the Not mainstreamed , the focus is on
(FFP). manifesto not in the building Christian Values and promoting
introduction as well. multi-lingual society and service delivery
Focus is mainly on ensuring that
there is better service delivery,
and also promoting moral values
in accordance to the Christian
value system.
Inkhata Freedom No quota No mention of women in the Not mainstreamed
Party manifesto not in the
(IFP). introduction,
No projects/ plans to improve
services for the poor/youth/
marginalised.
Instead the IFP is solely focusing
on rooting out corruption and
holding municipalities accountable
for funds spent.
United Christian No quota The UCDP does recognise that No clear mention of how the UCDP will
Democratic Party corruption within municipalities ensure that women are offered
(UCDP) can hinder the plan to bring on opportunities for growth within these
par gender equity. municipalities, and to also address the
However this is mentioned very issue of how corruption will be rooted.
oddly, no clear plan as to how
they are willing to address this
issue.
10PARTY QUOTA GENDER SPECIFIC GENDER MAINSTREAMED IN
REFERENCES IN MANIFESTOS MANIFESTOS
United Democratic No quota The UDM has an integrated Although there is mention that a UDM
Movement environmental management plan council will promote women participation
(UDM) which does include women. and have opportunities for jobs there is
no clear plan or indication of how this will
It states that a UDM led council be implemented.
will promote women and youth
participation in environmental
projects that create job
opportunities.
11The analysis shows that the ANC is the only party that has made an effort to mainstream
gender in its manifesto. The African Christian Democratic Party (ACDP) did not have any clear
vision in terms of how women will be empowered, instead they refer to women being offered
the opportunity to be supported if they fall pregnant and will assist with teenage pregnancy
issues. COPE also did not have a clear plan as to how the councilors who will form sub-
committees will have projects or programmes to ensure that women are empowered.
Several parties including the DA, IFP, and the FFP do not even mention women in their
manifestos, not even in their introductory paragraphs. The references to service delivery,
rooting out corruption, infrastructural development are gender blind.
Women as candidates
Table 4: Key comparative data on municipal elections
Comparison 2000 2006 2011
Parties contesting 79 97 121
Party list candidates 16,573 21,507 23,278
Ward candidates 13,214 23,672 29,570
Independents 690 667 748
Total candidates 30,477 45,179 53,596
Gender breakdown Male 66% Male 65% Male 63%
Female 34% Female 35% Female 37%
Uncontested Wards 75 11 7
Compiled by GL with data from the IEC
Table 4 provides key comparative data on the last three municipal elections in South Africa. The
2011 elections witnessed a record number of political parties participating, with a total of 121
contesting political parties, up from 79 in 2000 and 97 in 2006. According to the Independent
Electoral Commission (IEC) women comprised 19 731 of the 53, 000 candidates; 37% of the
total, up just two percent compared to 2006.
Table 5: Gender analysis of candidates by province
Province Female % Male % Total
Eastern Cape 2,743 38 4,477 62 7,220
Free State 1,167 35 2,115 65 3,282
Gauteng 3,571 40 5,483 60 9,054
Kwa Zulu-Natal 3,554 34 6,836 66 10,390
Limpopo 2,593 39 4,095 61 6,688
Mpumalanga 1,571 36 2,797 64 4,368
Northwest 1,608 40 2,428 60 4,036
Northern Cape 649 40 951 60 1,600
Western Cape 2275 33 4,683 67 6,958
Total 19,731 37.2% 33,865 62.8% 53,596
12Political party candidates lists by province and gender
Source: Independent Electoral Commission
Table 5 and the accompanying graph indicate that the proportion of female candidates varied
per province, with gender parity not achieved in any one of the provinces. Gauteng (40%),
Northwest (40%), and the Northern Cape (40%) had the highest proportion of women
candidates. The DA dominated Western Cape which had the lowest proportion of female
candidates (33%) despite being led by a female premier, Hellen Zille, and her partner, Patricia
de Lille formerly leader of the Independent Democrats (ID).
Table six: Women in PR party lists for the 2011 SA local elections
Party Women Men
ACDP 36.0% 64.0%
ANC 47.0% 53.0%
COPE 38.0% 62.0%
DA 33.0% 67.0%
IFP 32.0% 68.0%
UDM 37.0% 63%
1380
60
40 Women
20 Men
0
ACDP ANC COPE DA IFP UDM
Source: IEC
Table six and the accompanying graph show the proportion of women and men on the PR lists
of the six political parties analysed. The ANC had the highest proportion of women (47.0%)
followed by COPE (38.0%). The UDM came in third at 37%; the ACDP next at 36.0%, followed
by the DA (33.0%) and the IFP last at 32%. Only the ANC came close to meeting the 50/50
quota by having the largest proportion of women on their party lists. COPE, the ACDP and the
UDM also came close to achieving parity without quotas.
Election outcomes
South Africa experienced a calm pre-
election period, with the exception of
Kwa Zulu-Natal where the ANC and
the IFP clashed periodically during
campaigns and at rallies, though not
to the same degree as previously.
The dominant ANC was widely
expected to lose some ground in the
elections as a result of service
delivery protests. In the end this loss
(from 66.3% in 2006 to 63.65% in
2011) was not as wide as expected
as the ANC picked up support in the
IFP stronghold of Kwa Zulu Natal.
IFP support declined from 8.1% in
2006 to 3.94% in 2011. KwaZulu
Natal is the only province in which
the ANC picked up support, losing ground elsewhere to the DA.
The main opposition DA aimed to achieve greater stability in marginal municipalities and to
retain the Western Cape as its stronghold, as well as make inroads in other provinces especially
the Northern Cape, the only other province without a black majority. It is also targeted other
14provinces such as the Eastern Cape and the Free State. The DA registered the strongest gains
in the elections, from 14.8% in 2006 to 21.97% in 2011.
Following the national elections in 2009 the Congress of the People (COPE) lost considerable
ground, with many of its cadres crossing over to the ANC. The party garnered a mere 2.33% of
the vote. The new twist in the elections concerned the formation of the National Freedom Party
(NFP) by Zanele ka Mgwaza Msibi, a woman leader who broke away from the IFP and whose
new party unexpectedly garnered 2.58% of the vote
Table seven: Overview of the gender outcomes of the 2011 SA local elections
Female Male Total % women
PR 2086 2727 4813 43%
WARD 1408 2869 4277 33%
TOTAL 3494 5596 9090 38%
Source: Independent Electoral Commission
Table seven provides a snapshot of the outcomes of the 2011 election results, with women
constituting 43% of those who won the 4813 PR seats, and 33% of the 4277 ward seats.
PR seats
Table eight is a detailed analysis of the PR seats by party and province. It shows that the ANC
has the highest proportion of women who would occupy these seats - 55%, or over half,
showing that the ANC actually exceeded its 50/50 quota with regard to PR seats. The IFP at
(34%) is followed by the NFP (31%); COPE (29%) and the DA (27%).
These results clearly demonstrate the impact of voluntary party quotas in a PR system in which
parties determine where women are on the lists. The ANC came close to parity in its PR lists
and had more women than men in the upper levels of the list, resulting in more women than
men PR councilors. Where parties had no quota, and did not place women in winning positions
on their PR lists, they did not fare as well as men. The DA’s poor performance with regard to
women in PR lists is a classic example of what happens when parties fail to adopt quotas of
their own and where they are under no legal obligation to do so.
15Table eight: Gender analysis of PR seats in the 2011 SA local elections
Province Seats ANC COPE DA IFP NFP OTHER M F TOTAL
%
M F T M F T M F T M F T M F T M F T M F T W
Eastern 44%
Cape 799 257 264 521 38 23 61 86 34 120 1 1 2 68 27 95 450 349 799
Free State 359 84 122 206 20 9 29 78 19 97 17 10 27 199 160 359 43%
Gauteng 537 135 159 294 9 4 13 139 47 186 8 8 5 5 30 6 36 321 216 537 45%
Kwa-Zulu 44%
Natal 937 160 243 403 2 2 68 25 93 147 80 227 128 59 187 20 5 25 525 412 937
Limpopo 628 211 243 454 38 9 47 49 13 62 57 8 65 355 273 628 43%
Mpumalanga 466 119 201 320 8 1 9 71 20 91 1 1 2 4 1 5 31 8 39 234 232 466 50%
North-West 449 126 164 290 18 8 26 64 25 89 1 1 28 15 43 236 213 449 47%
Northern 41%
Cape 215 43 51 94 32 17 49 47 18 65 5 2 7 127 88 215
Western 34%
Cape 418 88 72 160 16 3 19 127 62 189 44 6 50 275 143 418
TOTAL 1223 1519 2742 181 74 255 729 263 992 156 81 237 138 62 200 300 87 387 2727 2086 4813
55% 29% 27% 34% 31% 22% 43%
16Table nine: Gender analysis of the ward seats in the 2011 SA local elections
Province Seats ANC COPE DA IFP NFP OTHER M F TOTAL
M F T M F T M F T M F T M F T M F T %W
Eastern 39%
Cape 715 383 260 643 38 20 58 13 1 14 434 281 715
Free State 317 199 82 281 22 12 34 2 2 223 94 317 29%
Gauteng 508 217 136 353 91 63 154 1 1 309 199 508 39%
Kwa-Zulu 17%
Natal 828 464 115 579 44 10 54 128 14 142 36 4 40 12 1 13 684 144 828
Limpopo 543 292 218 510 9 8 17 16 16 317 226 543 42%
Mpumalanga 402 244 118 362 20 16 36 4 4 268 134 402 34%
North-West 383 217 120 337 1 1 27 12 39 1 1 5 5 251 132 383 34%
Northern 36%
Cape 194 100 64 164 3 0 3 20 6 26 1 1 124 70 194
Western 33%
Cape 387 90 33 123 2 0 2 158 93 251 9 2 11 259 128 387
TOTAL 4277 2206 1146 3352 6 0 6 429 240 669 129 14 143 37 4 41 61 5 66 2869 1408 4277
34% 0% 36% 10% 10% 8% 33%
17Ward seats
Table nine shows how in all provinces women’s representation in the ward seats is lower than
in the PR seats, and is 33% overall (lower than the 37% achieved in the 2006 elections). What
is interesting, and in keeping with the DA’s argument that women in the party are accorded
seats on merit rather than through quotas is that the DA achieved a higher proportion (36%)
women in ward seats than the ANC (34%).
The showing of women in ward seats in other parties, at ten percent or less, is shameful and
calls for serious introspection. Four elections later, women at the local level in South Africa
should be able to contest elections in ward seats with confidence. This is especially true of the
dominant ANC party that made steady gains in the last elections with fielding women in ward
seats. That women should constitute more than half in the ANC’s PR seats (55%) and
substantially less than half (34%) in ward seats should be a serious cause for concern in the
ruling party.
Women's representation in local government in South Africa by province
60%
50%
50% 47% 45% 44% 44% 43% 43%
42% 43% 41%
39% 39% 36%
40% 34% 34% 33% 34%
33%
29% PR
30%
17% Ward
20%
10%
0%
l
e
t
ll
ng
ga
e
a
e
e
po
es
ra
p
at
at
ap
ap
Ca
te
an
po
-W
ve
St
N
C
C
au
al
O
m
lu
th
n
ee
n
m
G
n
er
Li
Zu
r
or
er
te
Fr
pu
th
N
a-
st
es
or
M
Ea
Kw
W
N
The graph summarises the representation of women in local government by PR/ward seat, by
province following the 2011 elections. It shows that:
The proportion of women in PR seats is higher than in ward seats overall and in all
provinces.
The province with the lowest proportion of women in ward seats (17%) is Kwa Zulu
Natal, a largely rural and traditional province, where support is split between the ANC
and the IFP.
Overall the ANC dominated provinces have the highest proportion of women.
The provinces with the lowest proportion of women overall are Kwa Zulu Natal and the
DA-dominated Western Cape.
What is however interesting about the Western Cape is that it has the narrowest
difference between the proportion of women in ward and PR seats. This is one positive
aspect of the DA’s argument that women must get into politics on their own steam. The
down side is that this evolutionary approach can take a long time and has resulted in
the province lagging behind with regard to women’s political participation.
18Table 10: Gender and local government in SA by political party
2006 2011
Political % W M T % Women
party Women Men Total women
ANC 2400 2852 5252 46% 2665 3429 6094 44%
DA 299 700 999 30% 503 1158 1661 30%
IFP 196 480 676 29% 95 285 380 25%
COPE 74 187 261 28%
NFP 66 175 241 27%
NP
ID 41 106 147 28%
UDM 22 68 90 24%
ACDP 22 65 87 25%
PAC 13 78 91 14%
VFP 9 62 71 13%
AZAPO 2 20 22 9%
Others 65 198 263 25% 92 361 453 20
TOTAL 3069 4629 7698 40% 3495 5595 9090 38%
Source: Gender Links 2011
Table 10 is a comparative analysis of women per political party following the 2006 and 2011
local elections in South Africa. The table shows that overall, as a result of the decline of women
in ward seats, the proportion of women councilors in the ANC has dropped from 46% in 2006 to
44% in 2011. The proportion of DA women councilors has remained constant at 30%. The
proportion of women councilors in the IFP dropped from 29% to 25%. Newcomers COPE and
the NFP ( a woman led party) had an unimpressive showing, with women constituting 28% and
27% of their total candidates in the 2011 elections.
19Women as mayoral candidates
Two additional metropolitan municipalities came into being during the elections: Buffalo City,
and Mangauang. The previous six metropolitan councils have remained the same. They are:
City of Cape Town
City of Tshwane
City of Johannesburg
eThekwini
Nelson Mandela Bay
Ekhuruleni
Of these eight metros, only two have women mayors, Patricia de Lille of the DA in Cape Town
and Zukiswa Ncitha of the ANC in Buffalo City. Tshwane and Ekhuruleni have lost women
mayors. The ANC Women’s League complained vocally about the absence of women mayoral
candidates in the ANC, but these cries appear to have fallen on deaf ears.
Gender in election discourse
While gender did not feature prominently in the campaigns, it did feature in the mud slinging
that followed the elections. Referring to the DA’s female leadership but lack of women in the
Western Cape provincial cabinet after de Lille became mayor of Cape Town the ANC said that
the DA saw women as only fit to be “poster girls.” Zille hit back by saying: “I am a woman, so is
the mayor of Cape Town. So is the DA’s national spokesperson. So are many of our top shadow
ministers. So is half the mayoral committee in the City of Cape Town.” She noted that the ANC
had never had a woman leader and had failed to put up women mayoral candidates.
CONCLUSIONS
Although South Africa still scores third in the SADC region (after Lesotho, 58% and Namibia,
41%) with regard to women’s representation in local government, the 2011 local elections
proved to be a major disappointment. Rather than press home earlier gains, the ANC slid
backwards with regards to women’s representation in ward seats, and failed to champion a
legislated quota that would have resulted in all parties fielding equal proportions of women and
men candidates. Although the DA is to be commended for having a higher proportion of women
in ward seats than the ANC, the party’s staunch opposition to quotas and anomalies like an all
male cabinet in the Western Cape give rise to cynicism about the example set by female led
parties.
Urgent action is needed if South Africa is to honour the commitment that it has made by signing
the SADC Protocol on Gender and Development that calls for gender parity at all levels and in
all areas of decision making by 2015. At this stage South Africa’s only hope of honouring this
commitment is if the local and national elections are merged, and local elections held again in
2014 rather than 2016. Even then, as demonstrated clearly in this report, parity is unlikely to be
achieved in the absence of a legislated gender quota. This would be in keeping with the Gender
Equality Bill that is being championed by the government with a great deal of reference to the
private sector. It is time to bring women’s political representation into this conversation as well.
20You can also read


