Climatization-Negligent Attribution of Great Salt Lake Desiccation: A Comment on Meng (2019)
←
→
Page content transcription
If your browser does not render page correctly, please read the page content below
climate
Comment
Climatization—Negligent Attribution of Great Salt
Lake Desiccation: A Comment on Meng (2019)
Michael L. Wine 1, * , Sarah E. Null 2 , R. Justin DeRose 3 and Wayne A. Wurtsbaugh 2
 1    Geomorphology and Fluvial Research Group, Ben Gurion University of the Negev, Beer Sheva 8410501, Israel
 2    Department of Watershed Sciences & Ecology Center, Utah State University, Logan, UT 84322, USA;
      sarah.null@usu.edu (S.E.N.); wayne.wurtsbaugh@usu.edu (W.A.W.)
 3    Rocky Mountain Research Station, US Forest Service, Ogden, UT 84401, USA; rjderose@fs.fed.us
 *    Correspondence: mlw63@me.com

 Received: 29 March 2019; Accepted: 11 May 2019; Published: 14 May 2019

 Abstract: A recent article reviewed data on Great Salt Lake (Utah) and concluded falsely that climate
 changes, especially local warming and extreme precipitation events, are primarily responsible for lake
 elevation changes. Indeed climatically influenced variation of net inflows contribute to huge swings
 in the elevation of Great Salt Lake (GSL) and other endorheic lakes. Although droughts and wet
 cycles have caused lake elevation changes of over 4.5 m, they have not caused a significant long-term
 change in the GSL stage. This recent article also suggests that a 1.4 ◦ C rise in air temperature and
 concomitant increase in the lake’s evaporative loss is an important reason for the lake’s decline.
 However, we calculate that a 1.4 ◦ C rise may have caused only a 0.1 m decrease in lake level. However,
 since 1847, the lake has declined 3.6 m and the lake area has decreased by ≈50%, despite no significant
 change in precipitation (p = 0.52) and a slight increase, albeit insignificant, in river flows above
 irrigation diversions (p = 0.085). In contrast, persistent water extraction for agriculture and other uses
 beginning in 1847 now decrease water flows below diversions by 39%. Estimates of consumptive
 water use primarily for irrigated agriculture in the GSL watershed suggest that approximately 85%
 (2500 km2 ) of the reduced lake area can be attributed to human water consumption. The recent
 article’s failure to calculate a water budget for the lake that included extensive water withdrawals
 misled the author to focus instead on climate change as a causal factor for the decline. Stable stream
 flows in GSL’s headwaters, inadequate temperature increase to explain the extent of its observed
 desiccation, stable long-term precipitation, and the magnitude of increased water consumption from
 GSL together demonstrate conclusively that climatic factors are secondary to human alterations to
 GSL and its watershed. Climatization, in which primarily non-climatic processes are falsely attributed
 to climatic factors, is a threat to the credibility of hydrological science. Despite a recent suggestion
 to the contrary, pressure to support Earth’s rising human population—in the form of increasing
 consumption of water in water-limited regions, primarily to support irrigated agriculture—remains
 the leading driver of desiccation of inland waters within Earth’s water-limited regions.

 Keywords: Aral Sea Syndrome; Anthropocene; agriculture; water balance; saline lake; global change

1. Introduction
     Meng [1] examines the water balance of the Great Salt Lake (GSL), Utah, USA, and determines
that “climate changes, especially local warming and extreme weather including both precipitation and
temperature, drive the dynamics (increases and declines) of the GSL surface levels,” contradicting
a large body of research implicating human water consumption as the primary driver of shrinkage
among lakes in Earth’s water-limited regions [2–18]. We therefore critically examine the methods and
claims of [1].

Climate 2019, 7, 67; doi:10.3390/cli7050067                                       www.mdpi.com/journal/climate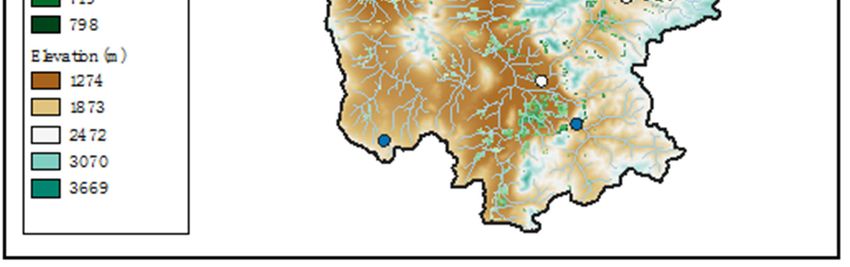
Climate 2019, 7, 67                                                                                   2 of 7

2. Errors of Prior Publication

2.1. Mistaken Water Balance
     Meng’s [1] definition of inflows is erroneous in that it fails to account for how human water
consumption reduces river discharge. Instead the river discharge term is mistakenly assumed to be
free of human influence. Water withdrawals for agricultural and municipal uses in the GSL watershed
can be substantial, and appropriately accounting for them is standard practice when developing stream
flow reconstructions. Reconstructions of important GSL tributaries (i.e., Logan River, Weber River,
and Bear River) have all focused on upper headwater gages for precisely this reason [19–21]. Meng [1]
incorrectly states the water balance of GSL as:
     “GSL water level = inflow (precipitation + river discharge)—outflow (human water use +
evaporation)”
     This water balance equation is in error as the units are inhomogeneous, with water level in units
of depth and flows in units of volume. The standard water balance equation balances changes in
storage in the control volume (∆S) with volumetric inflows (Q_IN) less outflows (Q_OUT), all in units
of volume per time: ∆S = Q_IN − Q_OUT. Consumptive water uses reduce inflows to Great Salt Lake
rather than increase outflows from the lake as [1] asserted.

2.2. Impacts of Rising Temperatures
      Meng [1] claims that “from the early 1970s, there is a significant trend of local climate warming
in the GSL region, which is primarily driving the declines of the GSL.” While the temperature trend
since the 1970s is legitimate, it is in part a local manifestation of global warming. Meng [1] provides
no quantitative evidence that lake evaporation flux rates have in fact increased or if so, by how
much. Nevertheless, a 1.4 ◦ C increase in air temperature has likely increased lake evaporation and
contributed to the decline in lake level, but far less than implied by [1]. Following the approach
of [22], a modified Penman equation was used to estimate open water evaporation as a consequence of
warming air temperature while accounting for reduced evaporation rates due to increased lake salinity.
The reported 1.4 ◦ C rise in temperature would have lowered the lake 0.12 m, whereas lake elevation
actually fell 0.81 m (USGS data) over the last 46 years. Consequently, increases in lake evaporation due
to temperature increases are important, but are insufficient to explain the decline in the Great Salt Lake.
Any future changes in air temperature due to global climate change would have additional impacts,
although these are likely to have a larger influence on evapotranspiration in the watershed than on the
lake itself [23]. Other studies have empirically correlated temperature increases with the shrinkage
of lakes [24–28]. However, those studies that have also quantified the role of rising temperature on
agricultural evapotranspiration have found that warming-driven lake evaporation changes remain of
lesser importance, relative to agricultural water consumption, given the level of observed warming at
present [17].
      Meng [1] makes a variety of additional claims concerning temperature increases that are
unsupported by past research:
      In contrast to the claim that “evaporation caused by the increases in temperature can be the
dominant water loss of saline lakes,” past work has shown that: (1) Predicted increases in lake
evaporation are small in the near-term (0.1–0.25% per year [29]); and (2) a range of factors control
evaporation from open water, of which temperature is only one. Thus, ref. [30] found that evaporation
was lower on warmer days when the wind was weaker as a result of synoptic weather conditions.
Additionally, lake evaporation is the product of lake area and evaporative flux. With lakes in
water-limited systems shrinking globally [18], evaporative fluxes decrease proportionally to lost lake
area [31], and with increasing salinity [22,32].
      The claim that “climate changes, especially increasing temperature, have caused significant water
loss through evaporation in semi-arid regions” confuses substantial future increases in lake evaporation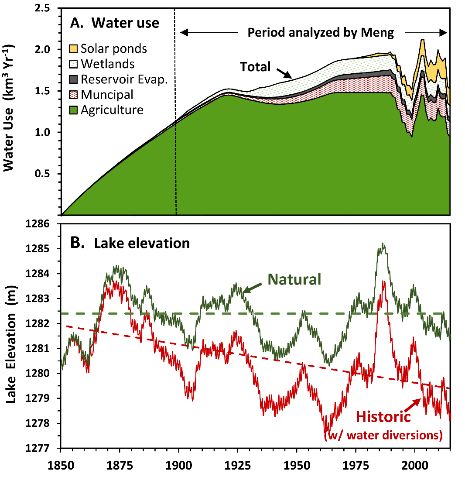
Climate 2019, 7, 67 3 of 7
Climate 2019, 7, x FOR PEER REVIEW 3 of 7
evaporation
predicted predicted
to transpire bytothetranspire bycentury
end of the the end[33]
of the century
with [33] with
substantially substantially
smaller increasessmaller increases
in evaporation
in evaporation
from lakes that mayfromhave
lakes that may
actually have actually
already occurredalready
[17,29]. occurred [17,29].
The suggestion that “increasing evaporation rates
The suggestion that “increasing evaporation rates caused causedby byclimate
climatewarming
warminghavehaveresulted
resultedinin
approximately 40% of Australia’s total water storage capacity loss every year” is also misleading asas
approximately 40% of Australia’s total water storage capacity loss every year” is also misleading
thisloss
this lossisisnot
notaaresult
resultofofanthropogenic
anthropogenicclimate
climatechange,
change,but
butrather
ratherprimarily
primarilyaaconsequence
consequenceofofnatural
natural
conditions of high evaporative demand
conditions of high evaporative demand [34]. [34].
2.3.Drivers
2.3. DriversofofChanging
ChangingStreamflow
Streamflow
Meng[1][1]
Meng postulates
postulates that “reduced
that “reduced river discharge
river discharge is directlyiscaused
directly caused
by the by the
declining declining
precipitation
precipitation
and snowfall,”and evensnowfall,”
though ref.even
[18]though
found ref.
that[18]
therefound that there
has been has been decline
no significant no significant decline in
in precipitation
inprecipitation
the basin over in the basintimeframe
a long over a long (1875–2015; = 0.52). They
timeframe p(1875–2015; p = 0.52). They also
also found thatfound
there that
wasthere was
a slight
a slighttrend,
upward upward trend,
albeit insignificant (p = 0.085),(pin=headwater
albeit insignificant 0.085), in streamflow
headwater streamflow above
above irrigation irrigation
diversions
diversions
since pioneers since pioneers
began began developing
developing waterinresources
water resources in the mid-1800s.
the mid-1800s. In contrast,Inriver
contrast,
flowsriver flows
reaching
reaching
the theLake
Great Salt GreathaveSaltdecreased
Lake havebydecreased
39% due tobywater
39% due to water development
development for agriculturefor
and agriculture
other human and
otherwhich
uses, human hasuses,
significantly < 0.0001) reduced
which has(psignificantly (p < 0.0001)
lake reduced
elevationlake elevation
by 3.6 by 3.6
m (Figure m (Figure
1) [18]. Meng’s1) [18].
[1]
Meng’s of
analysis [1]the
analysis of theprecipitation,
1904–2016 1904–2016 precipitation,
temperature,temperature,
and lake level and lake level
records records is because
is misleading misleadingit
because it ignores the data showing that approximately 80% of water development
ignores the data showing that approximately 80% of water development for agriculture and other uses for agriculture
and other
occurred uses 1904
before occurred before
(Figure 1904 (Figure 1) [18].
1) [18].
Figure 1. (A) Estimated water use for agriculture and other applications in the Great Salt Lake
Figure 1. (A) Estimated water use for agriculture and other applications in the Great Salt Lake
watershed from 1850–2013. Note that [1] failed to analyze the period from 1850–1903, during which
watershed from 1850–2013. Note that [1] failed to analyze the period from 1850–1903, during which
approximately 80% of water development occurred. See [18] for methods. (B) Yearly and long-term
approximately 80% of water development occurred. See [18] for methods. (B) Yearly and long-term
changes in the actual elevation of the south basin of Great Salt Lake derived from the U.S. Geological
changes in the actual elevation of the south basin of Great Salt Lake derived from the U.S. Geological
Survey data (red). Droughts and wet years emphasized by [1] cause large swings in lake elevation
Survey data (red). Droughts and wet years emphasized by [1] cause large swings in lake elevation
but cannot account for the significant (p < 0.001) decline since water development began in the basin.
but cannot account for the significant (p < 0.001) decline since water development began in the basin.
The green line shows [18] estimate of the natural lake elevation if consumptive water use had not
The green line shows [18] estimate of the natural lake elevation if consumptive water use had not
occurred. The lake has declined approximately 3.6 m due to consumptive water use.
occurred. The lake has declined approximately 3.6 m due to consumptive water use.Climate 2019, 7, 67 4 of 7
Climate 2019, 7, x FOR PEER REVIEW 4 of 7
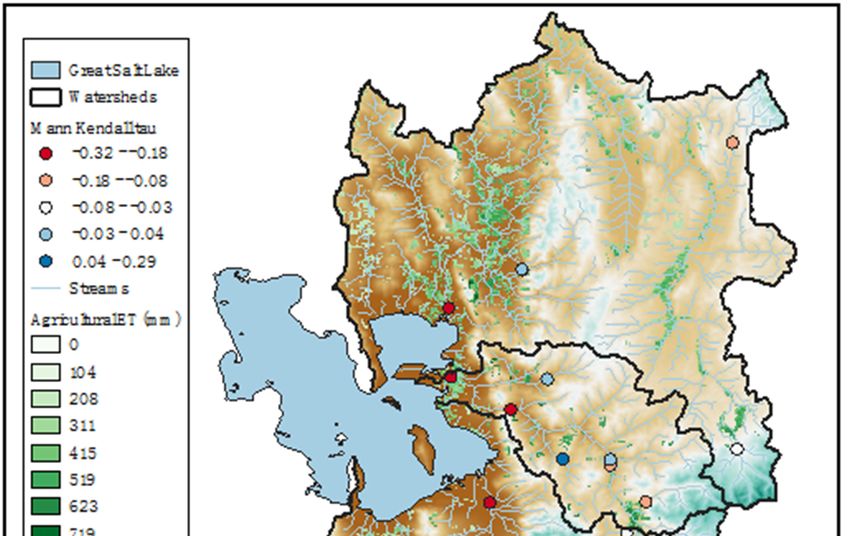
Additional analyses show that when all long-term and active stream gages in the Great Salt Lake
Additional analyses show that when all long-term and active stream gages in the Great Salt Lake
watershed are considered, Meng’s [1] assertion that decreasing precipitation is reducing streamflows
watershed are considered, Meng’s [1] assertion that decreasing precipitation is reducing streamflows is
is erroneous (Figure 2). In low order headwater streams above agricultural diversions, streamflow is
erroneous (Figure 2). In low order headwater streams above agricultural diversions, streamflow is
stable. In contrast, in higher order rivers proximal to irrigated agricultural areas, streamflow
stable. In contrast, in higher order rivers proximal to irrigated agricultural areas, streamflow decreases
decreases are observed. Indeed, such a pattern is a telltale sign of increasing agricultural water
are observed. Indeed, such a pattern is a telltale sign of increasing agricultural water consumption over
consumption over time [5]. As of 2015, GSL had shrunk by 2874 km2 from 5966 km2 [35]. In the Great
time [5]. As of 2015, GSL had shrunk by 2874 km2 from 5966 km2 [35]. In the Great Salt Lake watershed,
Salt Lake watershed, 3894 km2 of agricultural land is irrigated [36]. MODerate resolution Imaging
3894 km2 of agricultural land is irrigated [36]. MODerate resolution Imaging Spectroradiometer
Spectroradiometer (MODIS)-derived annual evapotranspiration (ET) for irrigated areas in the GSL
(MODIS)-derived annual evapotranspiration (ET) for irrigated areas in the GSL watershed suggest
watershed suggest mean ET is 370 mm∙yr−1 [37], implying an annual consumption of water for
mean ET is 370 mm·yr−1 [37], implying an annual consumption of water for irrigated agriculture in the
irrigated agriculture in the GSL basin of 1.5 × 10⁹ m3∙yr−1, similar to the estimate by [18]. If evaporation
GSL basin of 1.5 × 10⁹ m3 ·yr−1 , similar to the estimate by [18]. If evaporation excess (evaporation—direct
excess (evaporation—direct precipitation) from the lake’s surface is 0.61 m∙yr−1 on average [22], then
precipitation) from the lake’s surface is 0.61 m·yr−1 on average [22], then approximately 2500 km2 of
approximately 2500 km2 of the reduced lake area can be attributed to irrigated agriculture, over 85%
the reduced lake area can be attributed to irrigated agriculture, over 85% of the observed lake area loss.
of the observed lake area loss.
Figure 2. River discharge trends and irrigated agriculture in the Great Salt Lake watershed. Dots show
Figure 2. River discharge trends and irrigated agriculture in the Great Salt Lake watershed. Dots show
long-term (≥50 year) discharge trends through 2018 in 16 rivers. Streamflow is steady in low
long-term (≥50 year) discharge trends through 2018 in 16 rivers. Streamflow is steady in low order
order headwater streams. Only higher order rivers that discharge into the lake have sharply
headwater streams. Only higher order rivers that discharge into the lake have sharply decreasing
decreasing streamflow. This is consistent with increasing water consumption from irrigated agriculture.
streamflow. This is consistent with increasing water consumption from irrigated agriculture. (Mann
(Mann Kendall tau values indicate the strength and direction of a trend over time).
Kendall tau values indicate the strength and direction of a trend over time.)
2.4. Time Scales
Meng [1] highlights extreme weather events, which he suggests support an extremely changing
point analysis of “the so-called current declines of the world’s saline lakes”. He describes “extreme
weather events” as those that are more that ±2 S.D. of the mean. Meng [1] is correct that periods ofClimate 2019, 7, 67 5 of 7
extreme precipitation or drought cause large changes in runoff and the level of Great Salt Lake. This is
true for all closed-basin lakes (e.g., Lake Abert—[9]; Lake Urmia—[3]). For example, above average
precipitation in the Great Salt Lake watershed from 1967–1981 increased the lake level by 2.0 m and
then back-to-back 100-year precipitation events of 1982 and 1983 increased the lake level by another
2.4 m. This phenomenal increase, however, was followed by a 5.0 m decrease from 1987 to 2016,
when the lake reached its lowest recorded level of 1277.5 m [18]. Meng incorrectly indicated that the
lake’s lowest level was in 1963 because he failed to calculate changes in both the north and south
arms of the lake that are divided by a causeway [38]. Meng’s analysis highlights the importance of
weather-induced changes in the quasi-cyclic elevations of saline lakes, but without conducting a careful
water balance analysis, he failed to identify the more important long-term driver of change in most
saline lakes: persistent water withdrawals from their tributaries for agricultural and other forms of
evaporative consumption [2,5–10,12,18,39,40].
3. Conclusions
The dominance of water development, rather than climate change, for influencing most saline
lakes has important implications for managers. A warming climate and changes in precipitation
will have very important consequences for saline lakes and other ecosystems. Managers should
not, however, let climate change and the high variability of these ecosystems obscure the very
real desiccation of saline lakes caused by water development. Meng’s erroneous analysis is an
example of climatization, in which primarily non-climatic processes are falsely attributed to climatic
factors [13,15,16,41], thus absolving local governments of responsibility for sustainable management.
In many cases, discriminating between climate impacts and water development [2,12,18,42] will only
be understood with more thorough analyses than those attempted by [1]. Managers must be aware
of this issue and support thorough water balance analyses, and then take the appropriate actions to
preserve these ecosystems [43]. We support the recommendation of [44] that: “Aquatic ecosystems
may be most effectively managed in the context of global climate change if both the more pressing
anthropogenic threats [of water development] and the occurrence of extreme events are considered
and incorporated into management plans.”
Author Contributions: All authors contributed to conceptualization, investigation, and writing.
Acknowledgments: The comments of two anonymous reviewers were appreciated.
Conflicts of Interest: The authors declare no conflicts of interest.
References
1. Meng, Q. Climate Change and Extreme Weather Drive the Declines of Saline Lakes: A Showcase of the Great
Salt Lake. Climate 2019, 7, 19. [CrossRef]
2. AghaKouchak, A.; Norouzi, H.; Madani, K.; Mirchi, A.; Azarderakhsh, M.; Nazemi, A.; Nasrollahi, N.;
Farahmand, A.; Mehran, A.; Hasanzadeh, E. Aral Sea syndrome desiccates Lake Urmia: Call for action. J. Gt.
Lakes Res. 2015, 41, 307–311. [CrossRef]
3. Alborzi, A.; Mirchi, A.; Moftakhari, H.; Mallakpour, I.; Alian, S.; Nazemi, A.; Hassanzadeh, E.; Mazdiyasni, O.;
Ashraf, S.; Madani, K.; et al. Climate-informed environmental inflows to revive a drying lake facing
meteorological and anthropogenic droughts. Environ. Res. Lett. 2018, 13. [CrossRef]
4. Chaudhari, S.; Felfelani, F.; Shin, S.; Pokhrel, Y. Climate and anthropogenic contributions to the desiccation
of the second largest saline lake in the twentieth century. J. Hydrol. 2018, 560, 342–353. [CrossRef]
5. Fazel, N.; Haghighi, A.T.; Klove, B. Analysis of land use and climate change impacts by comparing river
flow records for headwaters and lowland reaches. Glob. Planet. Chang. 2017, 158, 47–56. [CrossRef]
6. Khazaei, B.; Khatami, S.; Alemohammad, S.H.; Rashidi, L.; Wu, C.; Madani, K.; Kalantari, Z.; Destouni, G.;
Aghakouchak, A. Climatic or regionally induced by humans? Tracing hydro-climatic and land-use changes
to better understand the Lake Urmia tragedy. J. Hydrol. 2019, 569, 203–217. [CrossRef]Climate 2019, 7, 67 6 of 7
7. Micklin, P.P. Desiccation of the Aral Sea—A Water Management Disaster in the Soviet-Union. Science 1988,
241, 1170–1175. [CrossRef]
8. Micklin, P. The Aral Sea Disaster. Annu. Rev. Earth Planet. Sci. 2007, 35, 47–72. [CrossRef]
9. Moore, J.N. Recent desiccation of Western Great Basin Saline Lakes: Lessons from Lake Abert, Oregon, U.S.A.
Sci. Total Environ. 2016, 554–555, 142–154. [CrossRef]
10. Morin, E.; Ryb, T.; Gavrieli, I.; Enzel, Y. Mean, variance, and trends of Levant precipitation over the past 4500
years from reconstructed Dead Sea levels and stochastic modeling. Quatern. Res. 2018. [CrossRef]
11. Rodell, M.; Famiglietti, J.S.; Wiese, D.N.; Reager, J.T.; Beaudoing, H.K.; Landerer, F.W.; Lo, M.H. Emerging
trends in global freshwater availability. Nature 2018, 557, 651–659. [CrossRef]
12. Wang, J.; Song, C.; Reager, J.T.; Yao, F.; Famiglietti, J.S.; Sheng, Y.; MacDonald, G.M.; Brun, F.; Schmied, H.M.;
Marston, R.A.; et al. Recent global decline in endorheic basin water storages. Nat. Geosci. 2018, 11, 926–932.
[CrossRef] [PubMed]
13. Wine, M.L. Under non-stationarity securitization contributes to uncertainty and Tragedy of the Commons.
J. Hydrol. 2019, 568, 716–721. [CrossRef]
14. Wine, M.L. Response to comment on “agriculture, diversions, and drought shrinking Galilee Sea”. Sci. Total
Environ. 2019, 663, 436–437. [CrossRef]
15. Wine, M.L. There is no black hole swallowing water in the Hula Valley. Land Use Policy 2019, 84, 363–364.
[CrossRef]
16. Wine, M.L. Letter to editor re Tal (2019): Climaticization of environmental degradation—An Anthropocene
epoch response to failure of governance. Sci. Total Environ. 2019. [CrossRef]
17. Wine, M.L.; Rimmer, A.; Laronne, J.B. Agriculture, diversions, and drought shrinking Galilee Sea. Sci. Total
Environ. 2019, 651, 70–83. [CrossRef] [PubMed]
18. Wurtsbaugh, W.A.; Miller, C.; Null, S.E.; DeRose, R.J.; Wilcock, P.R.; Hahnenberger, M.; Howe, F.; Moore, J.N.
Decline of the world’s saline lakes. Nat. Geosci. 2017, 10, 816–821. [CrossRef]
19. Allen, E.B.; Rittenour, T.M.; DeRose, R.J.; Bekker, M.F.; Kjelgren, R.; Buckley, B.M. A tree-ring based
reconstruction of Logan River streamflow, northern Utah. Water Resour. Res. 2013, 49, 8579–8588. [CrossRef]
20. Bekker, M.F.; Justin DeRose, R.; Buckley, B.M.; Kjelgren, R.K.; Gill, N.S. A 576-Year Weber River Streamflow
Reconstruction from Tree Rings for Water Resource Risk Assessment in the Wasatch Front, Utah. JAWRA J.
Am. Water Resour. Assoc. 2014, 50, 1338–1348. [CrossRef]
21. DeRose, R.J.; Bekker, M.F.; Wang, S.Y.; Buckley, B.M.; Kjelgren, R.K.; Bardsley, T.; Rittenour, T.M.; Allen, E.B.
A millennium-length reconstruction of Bear River stream flow, Utah. J. Hydrol. 2015, 529, 524–534. [CrossRef]
22. Mohammed, I.N.; Tarboton, D.G. An examination of the sensitivity of the Great Salt Lake to changes in
inputs. Water Resour. Res. 2012, 48. [CrossRef]
23. Huntington, T.G. Evidence for intensification of the global water cycle: Review and synthesis. J. Hydrol.
2006, 319, 83–95. [CrossRef]
24. Chen, J.L.; Pekker, T.; Wilson, C.R.; Tapley, B.D.; Kostianoy, A.G.; Cretaux, J.F.; Safarov, E.S. Long-term
Caspian Sea level change. Geophys. Res. Lett. 2017, 44, 6993–7001. [CrossRef]
25. Fathian, F.; Morid, S.; Kahya, E. Identification of trends in hydrological and climatic variables in Urmia Lake
basin, Iran. Theor. Appl. Climatol. 2014, 119, 443–464. [CrossRef]
26. Fathian, F.; Dehghan, Z.; Bazrkar, M.H.; Eslamian, S. Trends in hydrological and climatic variables affected
by four variations of the Mann-Kendall approach in Urmia Lake basin, Iran. Hydrol. Sci. J. 2016. [CrossRef]
27. Liu, H.; Yin, Y.; Piao, S.; Zhao, F.; Engels, M.; Ciais, P. Disappearing lakes in semiarid Northern China: Drivers
and environmental impact. Environ. Sci. Technol. 2013, 47, 12107–12114. [CrossRef] [PubMed]
28. Zheng, J.J.; Ke, C.Q.; Shao, Z.D.; Lie, F. Monitoring changes in the water volume of Hulun Lake by integrating
satellite altimetry data and Landsat images between 1992 and 2010. J. Appl. Remote Sens. 2016, 10, 14.
[CrossRef]
29. Rimmer, A.; Givati, A.; Samuels, R.; Alpert, P. Using ensemble of climate models to evaluate future water
and solutes budgets in Lake Kinneret, Israel. J. Hydrol. 2011, 410, 248–259. [CrossRef]
30. Shilo, E.; Ziv, B.; Shamir, E.; Rimmer, A. Evaporation from Lake Kinneret, Israel, during hot summer days.
J. Hydrol. 2015, 528, 264–275. [CrossRef]
31. Zhan, S.; Song, C.; Wang, J.; Sheng, Y.; Quan, J. A Global Assessment of Terrestrial Evapotranspiration
Increase Due to Surface Water Area Change. Earth’s Future 2019. [CrossRef]Climate 2019, 7, 67 7 of 7
32. Zilberman, T.; Gavrieli, I.; Yechieli, Y.; Gertman, I.; Katz, A. Constraints on evaporation and dilution of
terminal, hypersaline lakes under negative water balance: The Dead Sea, Israel. Geochim. Cosmochim. Acta
2017, 217, 384–398. [CrossRef]
33. Wang, W.; Lee, X.; Xiao, W.; Liu, S.; Schultz, N.; Wang, Y.; Zhang, M.; Zhao, L. Global lake evaporation
accelerated by changes in surface energy allocation in a warmer climate. Nat. Geosci. 2018, 11, 410–414.
[CrossRef]
34. Helfer, F.; Lemckert, C.; Zhang, H. Impacts of climate change on temperature and evaporation from a large
reservoir in Australia. J. Hydrol. 2012, 475, 365–378. [CrossRef]
35. Lehner, B.; Döll, P. Development and validation of a global database of lakes, reservoirs and wetlands.
J. Hydrol. 2004, 296, 1–22. [CrossRef]
36. Meier, J.; Zabel, F.; Mauser, W. A global approach to estimate irrigated areas—A comparison between
different data and statistics. Hydrol. Earth Syst. Sci. 2018, 22, 1119–1133. [CrossRef]
37. Mu, Q.; Zhao, M.; Running, S.W. Improvements to a MODIS global terrestrial evapotranspiration algorithm.
Remote Sens. Environ. 2011, 115, 1781–1800. [CrossRef]
38. White, J.S.; Null, S.E.; Tarboton, D.G. How Do Changes to the Railroad Causeway in Utah’s Great Salt Lake
Affect Water and Salt Flow? PLoS ONE 2015, 10, e0144111. [CrossRef] [PubMed]
39. Hostetler, S.W.; Giorgi, F. Effects of a 2 × CO2 climate on two large lake systems: Pyramid Lake, Nevada,
and Yellowstone Lake, Wyoming. Glob. Planet. Chang. 1995, 10, 43–54. [CrossRef]
40. Williams, W.D. Conservation of salt lakes. Hydrobiologia 1993, 267, 291–306. [CrossRef]
41. Grant, S.; Tamason, C.C.; Jensen, P.K.M. Climatization: A critical perspective of framing disasters as climate
change events. Clim. Risk Manag. 2015, 10, 27–34. [CrossRef]
42. Gao, H.; Bohn, T.J.; Podest, E.; McDonald, K.C.; Lettenmaier, D.P. On the causes of the shrinking of Lake
Chad. Environ. Res. Lett. 2011, 6, 7. [CrossRef]
43. Edwards, E.C.; Null, S.E. The cost of addressing saline lake level decline and the potential for water
conservation markets. Sci. Total Environ. 2019, 651, 435–442. [CrossRef] [PubMed]
44. Grimm, N.B.; Chacón, A.; Dahm, C.N.; Hostetler, S.W.; Lind, O.T.; Starkweather, P.L.; Wurtsbaugh, W.A.
Sensitivity of aquatic ecosystems to climatic and anthropogenic changes: The Basin and Range, American
Southwest and Mexico. Hydrol. Process. 1997, 11, 1023–1041. [CrossRef]
© 2019 by the authors. Licensee MDPI, Basel, Switzerland. This article is an open access
article distributed under the terms and conditions of the Creative Commons Attribution
(CC BY) license (http://creativecommons.org/licenses/by/4.0/).You can also read