MARKET REVIEW & OUTLOOK - Winter 2018 - Kiemle Hagood
←
→
Page content transcription
If your browser does not render page correctly, please read the page content below
MARKET REVIEW
& OUTLOOK

                    Winter 2018

       Published in Partnership with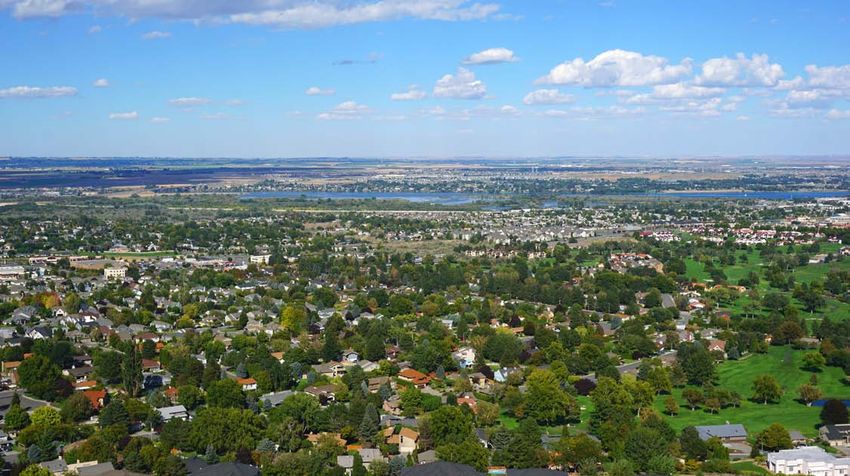
Published in Partnership with
TABLE OF CONTENTS
Photo credit: Homes by Eugene, Johanna B. Photography, Isaacson Aerial Photography, Emily Fisher Photography
Graphics: Mike Lee
KIEMLEHAGOOD.COM
Economic Outlook 3
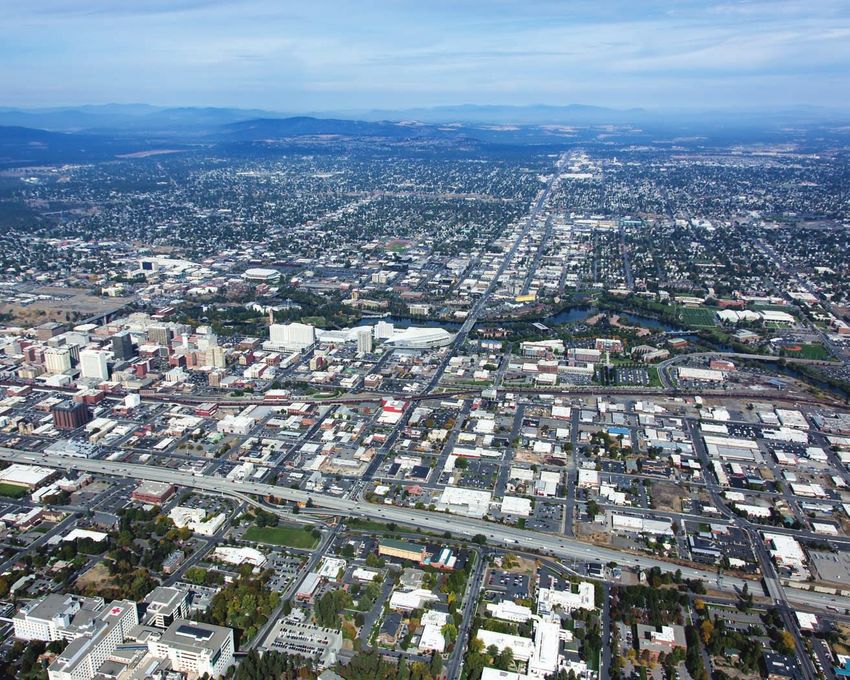
Spokane
Office Market 4-5 (509) 838-6541
Retail Market 6-7 601 W. Main Ave., Suite 400
Coeur d’Alene
Industrial Market 8 (208) 770-2590
Medical Office Market 9 2065 W. Riverstone Dr., Suite 101
Kennewick
Apartment Market 10 (509) 783-7663
Kootenai County 11 8121 W. Quinault Ave., Suite F201
Missoula
New Markets 12-13 (406) 552-4568
K&H Facility Services 14 1001 SW Higgins Ave., Suite 202
All information furnished is from sources deemed reliable and submitted subject to errors and omissions.
No responsibility is assumed for any inaccuracies. No one should rely solely on this information,
but instead should conduct their own investigation to independently satisfy themselves.
2 MARKET REVIEW & OUTLOOK 2018 Kiemle Hagood
ECONOMIC OUTLOOK

                                                                                                                               Written By
                                                                                    Dr. Grant Forsyth, Chief Economist, Avista Corporation

Based on the outlook for U.S. GDP growth,
regional employment growth will likely be in the
1.5% to 2% range in 2018.
U.S. Economic Policy
The U.S. economy is now experiencing its third longest             In both of these sectors, employers will struggle to fill
expansion going back to the 1850s. The recent tax reform           open positions. Similar to the U.S. trend, initial claims for
act—the first since the 1980s—will help prolong the current        unemployment insurance are already low by historical
expansion through 2018. However, even with lower personal          standards and will continue to be low through the year. This
and corporate taxes, the expectation for U.S. GDP growth in        is a clear signal of an extremely tight labor market. This
2018 is around 2.5%. This is far below the 4% target of the        tightness, combined with Washington’s new minimum wage
Trump Administration, and largely reflects ongoing weakness        law, is generating regional wage gains that exceed consumer
in U.S. labor productivity. Consumer inflation is expected         inflation.
to remain very near the Federal Reserve’s target of 2%. As
a result, the Fed’s ongoing interest rate increases will likely
                                                                   Regional Population
continue at a modest pace in 2018. One risk to U.S. and
                                                                   The ongoing strength in the region’s labor market continues
regional growth is a breakdown in NAFTA talks. A NAFTA
                                                                   to boost population growth through in-migration. Population
breakdown will hit the trade-dependent Northwest hard if it
                                                                   growth in Spokane and Kootenai Counties combined was
leads to a protectionist conflict between the U.S., Canada, and
                                                                   around 1.5% in 2017, much faster than 0.7% growth for the
Mexico.
                                                                   U.S. Regional population growth, which will likely exceed 1%
                                                                   again in 2018. Even the region’s rural counties are enjoying
Regional Labor Market                                              population growth after a period of stagnant growth following
In 2017 non-farm employment growth in Spokane and                  the Great Recession. However, even with this pickup in
Kootenai Counties combined was over 2%, compared to 1.5%           population growth, the age demographics for the region’s
for the U.S. Regional employment growth continues to be            rural counties will remain much older than the urban counties
particularly strong in the construction and health care sectors.   for the foreseeable future.

KIEMLEHAGOOD.COM                         MARKET REVIEW & OUTLOOK 2018                                                                   3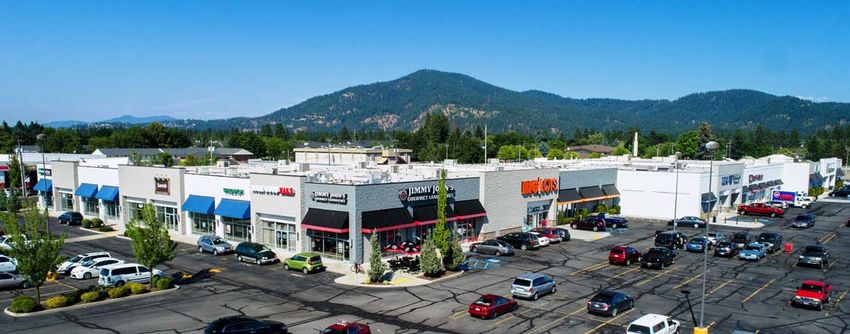
OFFICE MARKET                                                                                                                 Written By
                                                                          Mike Livingston, Erik Nelson and Craig Soehren – Kiemle Hagood

Market Conditions
• Leasing and sale activity of office product in the Greater
  Spokane area remained strong throughout 2017, especially
  at the end of the year. However, due to strong 4th Quarter
  activity these reporting figures do not accurately reflect
  the strength of the current Spokane Office Market. As an
  example, overall vacancy for year end 2017 was 16.3%
  compared to 15.6% a year ago. Barring a sudden and
  unforeseen economic downturn, we expect office vacancy
  figures to be significantly lower next reporting period as
  many 4Q17 transactions are reported.

• Leasing activity was especially robust in the Close-In
  submarket, historically Spokane’s strongest submarket.         Iron Bridge Campus
  Rock Pointe Corporate Campus and other properties with
  sufficient parking had significant absorption.
                                                                Market Forecast
• Despite a slow start, the Central Business District ended
  2017 with positive absorption as well.                        There are several reasons to believe 2018 will be a year
                                                                characterized by falling vacancy rates, increasing rental rates,
• Construction of new office building in the Spokane Valley
                                                                and new construction, including:
  (at the Meadowwood Technology Campus and Pinecroft
  Business Park) will commence and/or be occupied as                – With the completion of the former Macy’s department
  new product is needed due to a lack of large well located           store into a market-rate apartment project and a general
  availabilities throughout the market.                               increase in downtown activity, we expect increased
                                                                      demand for CBD office space.
• Sale activity was especially strong in 2017 and could have
  been even stronger if there had been more available               – The University District will see completion of the $14
  inventory for investors and owner users. Despite demand             million Gateway Bridge, commencement of a new,
  exceeding supply, cap rates for office investments remained         100,000+ square foot health sciences building, and
  in the 6.5% to 8.0% range.                                          completion of the first year for medical students at
                                                                      Washington State University’s Elson Floyd Medical
                                                                      School. All should translate into increased demand for
                                                                      a variety of real estate product in the Close In and CBD
                                                                      submarkets.

                                                                    – One or more new buildings will be constructed at
                                                                      Pinecroft.

                                                                    – Leasing activity from 4Q17 that did not appear in the
                                                                      year-end report will boost 2018 results.

                                                                    – Demand for investment property should remain robust
                                                                      as investors from out of the area continue to seek higher
                                                                      yields in Spokane.

                                              Rock Pointe

4                                       MARKET REVIEW & OUTLOOK 2018                                                    Kiemle Hagood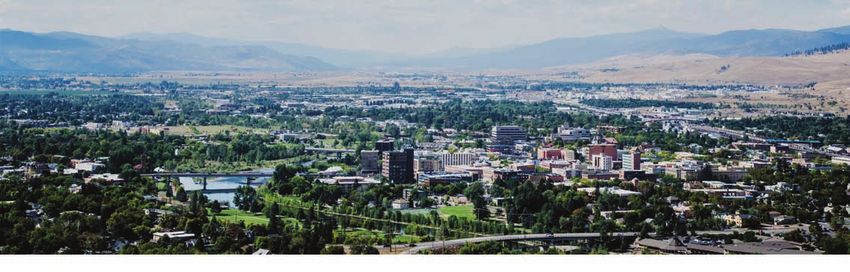
Office Market Inventory                                                                    *Market Data Source: Valbridge Property Advisors

 483,833
                     West                                          Occupied SF              Vacant SF
 208,196

3,743,743
                     Valley
  615,713

1,086,888
                     North
  229,223

 204,202
                         South
  29,291

3,297,850
                     Close-In
  363,707

3,016,261
                     CBD
  501,451
                                                                                                                                43.0%

Office Market Vacancy                                      Office Submarket Vacancy
                                                           Breakdown
   24%

   20%

   16%

   12%
                                                                                                21.1%

   8%
                                                           16.6%                                                16.5%
   4%                                                                             14.3%

                                                                      11.0%
   0%
             2013       2014     2015      2016    2017

   Total     17.2%      15.7%    17.0%     17.9%   16.5%
                                                                       Close-In

   CBD       16.6%      13.2%    15.7%     15.7%   16.6%
                                                                                                                   Valley
                                                                                                   North
                                                                                   South

                                                                                                                                   West
                                                            CBD

   Suburbs   17.4%      16.7%    17.5%     18.7%   16.4%

KIEMLEHAGOOD.COM                        MARKET REVIEW & OUTLOOK 2018                                                                      5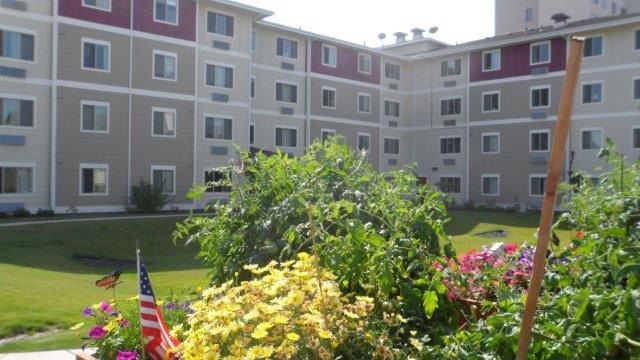
RETAIL MARKET                                                                                                               Written By
                                                                                         Colin Conway and Carl Guenzel – Kiemle Hagood

Market Conditions                                               Market Forecast
• There was some relaxing in the South Hill vacancy rate        • In investment sales, a seller’s market shows no immediate signs
  which saw a slight increase to 4.0%. This submarket has         of easing. With low interest rates, limited product and available
  been especially tough on national and regional restaurant       capital, sellers are demanding low cap rates for even Class B
  franchises.                                                     and C properties. As long as buyers continue to line up, sellers
                                                                  will be in the position of strength.
• Since the recession, the Spokane Valley submarket has
  shown a solid recovery in occupancy. After reaching a high    • New, smaller retail strip centers are coming online in North
  of 12.6% vacancy in mid-year 2013, the Valley recovered to      Spokane and Spokane Valley, with either full or close-to-full
  5.4%, the second lowest vacancy rate in the suburban areas      occupancy upon completion. Additional speculative building
  that are tracked. Even though the occupancy levels have         may soon be on the horizon. Rents are easing into the $30
  tightened, average rental rates have not seen a significant     range for small space, while Mid-Box Retail rents will remain in
  improvement for more than a decade.                             the $12-$17 range.

                                                                • Even though restaurants are concerned about the impact of
                                                                  the mandatory health care law and the state’s minimum wage
                                                                  law, new concepts continue to open. Landlords working with
                                                                  new operators would be wise to keep alert for warning signs of
                                                                  struggling tenants.

    Evergreen Crossing

Retail Submarket Vacancy
Breakdown
CBD                       9.8%

    Close-In             9.0%                                                            Hanson Center - Market Pointe II

South 4.0%                                                                    RETAIL MARKET BREAKDOWN
                                                                 Submarket       Surveryed Inventory (SF)         Vacant Inventory (SF)    Vacancy

                                                                 CBD                         1,341,754                      131,811          9.8%
    North             8.2%
                                                                 Close-in                    1,022,862                        92,015          9.0%
                                                                 South                       1,228,955                        49,321          4.0%

    Valley     5.4%                                              North                       6,060,504                      499,400           8.2%
                                                                 Valley                      5,976,662                      321,788           5.4%
                                                                 West                          267,788                        28,595        10.7%
West                         10.7%
                                                                                                    *Market Data Source: Valbridge Property Advisors

6                                       MARKET REVIEW & OUTLOOK 2018                                                               Kiemle Hagood
Coeur d’Alene Town Center

                                        DEMOGRAPHIC OVERVIEW OF THE INLAND NORTHWEST
                                        2017           2022            2010          Projected         2017       2017 Estimated                  2017
                                   Estimated       Projected         Census      Annual Growth    Estimated       Median House-              Estimated
                                  Population      Population      Population       (2017-2022)   Households         hold Income             Median Age

         SPOKANE COUNTY             500,280            544,876      471,221              1.8%       205,051              $56,725                    36.7

                Spokane, WA         216,417            236,029      209,752              1.8%        93,546              $49,062                    35.1

           Spokane Valley, WA        96,262            104, 681      89,657              1.7%        40,104              $53,777                    36.8

             Liberty Lake, WA         9,205             10,059        7,591              1.9%         3,609              $72,377                    36.4

          Airway Heights, WA          6,723              7,235        6,114              1.5%         2,006              $41,941                    30.9

         KOOTENAI COUNTY            159,314            178,654      138,494              2.4%        62,591              $54,691                    39.1

            Coeur d’Alene, ID        51,746             57,925       44,113              2.4%        21,164              $47,442                    35.4

                 Post Falls, ID      33,523             37,456       27,780              2.3%        12,654              $52,828                    35.0

                Rathdrum, ID          8,323              9,291        6,915              2.3%         3,009              $48,207                    35.3

                  Hayden, ID         14,735             16,436       12,998              2.3%         5,767              $62,778                    40.8

15   %                                                                                                         *Data Source: U.S. Census Bureau/Sites USA

12%
               10.4%
                                                                                                  Overall Retail Vacancy
                                                                               8.8
                                                                                 %
9%                                             10.2%                                                                                               7.1%
                                                                                                        8.9%
6%

3%

0%
                2013                            2014                           2015                      2016                                     2017
KIEMLEHAGOOD.COM                                 MARKET REVIEW & OUTLOOK 2018                                                                           7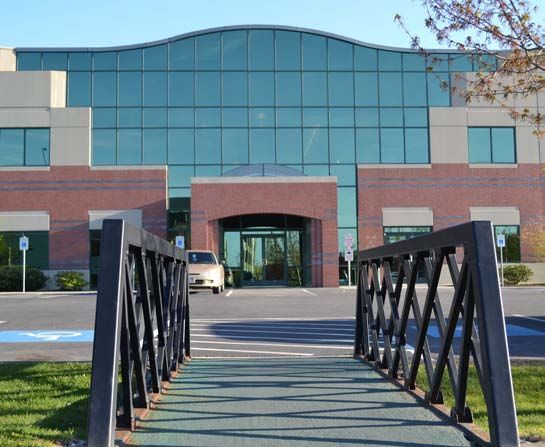
INDUSTRIAL MARKET                                                                                                                                            Written By
                                                                                                           Mark Lucas, SIOR , Tracy Lucas and Tracy Poff – Kiemle Hagood

  Market Conditions                                                                           Cheney Spokane Road
  • Spokane’s Industrial Market saw another drop in vacancy
    levels during the second half of 2017. Vacancy rates remain
    historically low as the overall level dipped just below 2%.

  • Demand for industrial space continues to grow throughout
    the region, and only 638,134 square feet of new space was
    built in 2017, while 1,024,544 square feet was absorbed.
                                                                                             Industrial Vacancy by Building Size
  • With constricted options, tenants within the region have
    seen an increase in rental rates.                                                          OVERALL                                 1.8%

  Market Forecast                                                                              0 - 5,000 SF                                                     2.6%

  • Several new projects will come online in 2018. As these
    projects are completed, expect to see a slight rise in vacancy                             5,001 - 10,000 SF                                   2.2%
    and more options for tenants.

  • Keep in mind historically the Industrial Market tends to have                              0-10,000 SF                                               2.4%
    a five year vacancy level incline and decline. Movement
    towards a small vacancy level rise is expected to occur in
                                                                                               10,001 - 20,000 SF               1.5%
    2018.

                                                                                               20,001 - 40,000 SF                                        2.4%
  *Market Data Source: Mark Lucas, SIOR, Tracy Lucas and Tracy Poff

                                                                                               Over 40,001 SF 1.2%
 Industrial
 Market History                                                                                Spokane Industrial Park                        2.0%

           SF ABSORPTION                                                                                                                            TOTAL VACANCY %
                 2,000,000                                                                                                                                   10%

                                                                                                                                                                9%
                 1,500,000
                                                                                                                                                                8%

                 1,000,000                                                                                                                                      7%
663,476 SF AVG
ABSORPTION
                                                                                                                                                                6%
                   500,000                                                                                                                                             5.7% AVG
                                                                                                                                                                       VACANCY
                                                                                                                                                                5%

                         0
                                                                                                                                                                4%

                                                                                                                                                                3%
                  -500,000

                                                                                                                                                                2%

                 -1,000,000
                                                                                                                                                                1%

         Vacancy
         Absorption           1993 1994 1995 1996 1997 1998 1999 2000 2001 2002 2003 2004 2005 2006 2007 2008 2009 2010 2011 2012 2013 2014 2015 2016 2017

  8                                                          MARKET REVIEW & OUTLOOK 2018                                                                    Kiemle Hagood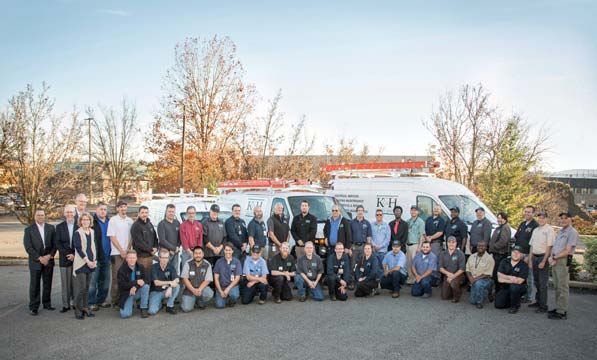
MEDICAL OFFICE MARKET
                                                                                                                        Written By
                                                                                                        Ron Horton – Kiemle Hagood

Market Conditions
• The Spokane Medical Office Market has enjoyed positive
  absorption in the last few months. The last survey indicated
  a vacancy rate over 10%; however, that rate has dropped to
  just under 9% in the most current report. A continued wait
  and see attitude is in place as health organizations continue
  to merge, uncertainty over the ACA continues, and the
  health industry as a whole wonders what’s next.                                              Providence Medical Park
• Rents will need to rise to recover increases in operating
  costs, which show no signs of slowing. Class A properties will
  continue to demand top rates, while B and C Class properties
                                                                   Medical Office
  will struggle to attract good tenants. Landlords will need to
  be aggressive by offering attractive tenant improvement          Submarket Vacancy Breakdown
  allowances, flexible lease terms, and other incentives.

• Capitalization Rates nationwide for medical office properties     Close-In                                                 8.9%
  have dropped from 8.5% in 2002 to 6.7% in 2016 with
  continued downward pressure. (Source: Real Capital
  Analytics)                                                        South          3.5%

Market Forecast                                                     North                                                          9.6%

• Health care will maintain the move toward a convenience
  – based model. Health care organizations will continue to         Valley                                                         9.6%
  locate in population centers where their customer base is
  located and operational costs are lower than on hospital
  campuses.

• New rules implemented by the Financial Accounting
  Standards Board will impact how health care providers
                                                                                                  Overall Medical
  account for long-term leases, which currently allow sale –                                      Office Vacancy
                                                                   15%
  leaseback arrangements. Under the new rules, leases will                         13.2%
  be classified as financing leases, which will be treated as
                                                                   12%
  debt by the lessee. These changes will force a fundamental                                                       9.4%
  rethinking of whether providers want to own or lease their             10.7  %
                                                                   9%                           10.2%
  facilities. Developers will need to consider offering credit-                                                                     9.0%
  leasing where a provider gets the benefit of ownership
                                                                   6%
  following lease expiration.

                                                                   3%

                                                                   0%
                                                                         2013      2014          2015             2016              2017

                                                                                           *Market Data Source: Valbridge Property Advisors

KIEMLEHAGOOD.COM                          MARKET REVIEW & OUTLOOK 2018                                                                  9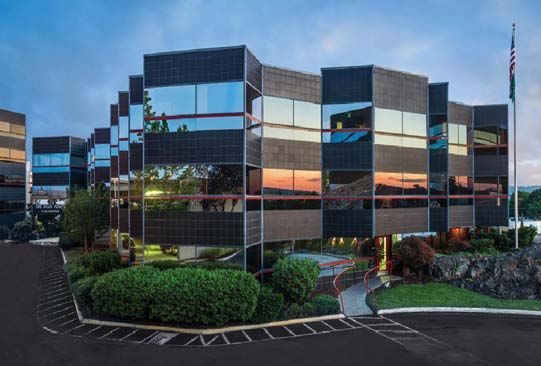
APARTMENT MARKET                                                                                                                              Written By
                                                                                                             Tim Kestell and Cody George – Kiemle Hagood

Market Conditions
• The average apartment vacancy rate for the Greater
  Spokane region increased from 1.6% in Fall 2016 to 2.9% in
  Fall 2017. This increase appears to be due to the anticipated
  delivery of several new apartment opportunities and higher
  than usual vacancies in the 2+ bedroom apartment category
  area wide. Interestingly, the average rental rate increased
  $36.00 per month over the same period to $886.00 per
  month. The peak rental rate was in Spring 2017, when levels
                                                                                                                           Lilac Terrace Apartments
  hit $913.00 per month, then fell during the summer months.

• In addition to new product, first time home buyers continue                   Market Forecast
  to take advantage of low interest rates and home purchase
  options, which is a factor in apartment vacancy rates area                    • Vacancy rates should trend downward as new product
  wide.                                                                           is absorbed. Currently, several apartment buildings in
                                                                                  Spokane County have wait lists up to 30 requests deep.
            APARTMENT MARKET BREAKDOWN
                   BY SUBMARKET                                                 • Rental rates should stabilize while absorption takes place,
Submarket                          Vacancy %             Average Rental Rates     and then trend upwards toward the 4th Quarter, as a
                                                                                  relative short supply remains.
 North                                 2.0%                            $833

 Central                               1.8%                            $777     • Properly zoned land that can handle multi-family
 Valley                                2.9%                            $870       development will stay active throughout 2018.
 South                                 3.1%                            $987
                                                                                • Quality multi-family investment listings should remain
 West                                  7.9%                            $891
                                                                                  relatively sparse with low cap rates through 2018, since
 OVERALL                               2.9%                            $886       investors do not want to give up their investment without
                                                                                  a replacement or a premium sale price.

Overall Apartment
Rental Rates
                                                     886
                                                     $
                                                                                               Overall Apartment Vacancy
                                        $
                                         848                                    5%
                                                                                        4.1%
                                                                                4%
                        751
                        $                                                                                                   3.3%
$
    720                                                                                                                                                           2.9%
             710
             $
                                                                                3%                      3.5%

                                                                                2%

                                                                                                                                              1.6%
                                                                                1%

                                                                                0%
    2013

                 2014

                            2015

                                            2016

                                                         2017

                                                                                        2013              2014               2015             2016               2017

                                                                                            *Data Source: Runstad Center for Real Estate Studies/University of Washington

10                                                 MARKET REVIEW & OUTLOOK 2018                                                                      Kiemle Hagood
KOOTENAI COUNTY Written By
Pat Eberlin – Kiemle Hagood
Office Retail
• Significant office space absorption occurred throughout • Kootenai County is not immune to the ever-changing
Kootenai County as roughly 120,000 SF was absorbed traditional retail stores. Web-based presence and
since Summer 2016. e-commerce drive decision making with many retailers
“right sizing” store fronts to cater to daily consumer needs.
• Similar to past years, new office speculative construction
is fairly nonexistent as the land costs in conjunction with • Service related office users (ie: dental, medical, insurance
construction costs and expected returns challenge the etc.) continue to transition into retail positioned product,
necessary rent levels by tenants in the market. while enjoying stronger traffic counts, parking ratios,
exposure and access.
• Stabilization is expected in 2018 for the office sector with
Landlord contributions in the form of free and or reduced • Expect to see a reasonable retail market with tenant
rent, while TI packages will dwindle. relocations from within and consistent rents from the “mom
and pops” while strong signatures compete for Class A
OFFICE MARKET BREAKDOWN
locations in the high rent districts.
Submarket Inventory (SF) Vacant Inventory (SF) Vacancy
Coeur d'Alene 3,063,542 140,929 4.6%
Post Falls 553,152 33,687 6.1%
RETAIL MARKET BREAKDOWN
Rathdrum 24,915 0 0%
Submarket Inventory (SF) Vacant Inventory (SF) Vacancy
Hayden 368,613 17,879 4.9%
Coeur d'Alene 4,931,800 223,326 4.5%
Dalton Gardens 14,710 0 0%
Totals 4,024,932 192,495 4.8% Post Falls 1,649,731 154,137 9.3%
Rathdrum 219,501 23,015 10.5%
Hayden 859,896 40,840 4.8%
Dalton Gardens 170,237 5,200 3.1%
Parkside Tower
Totals 7,831,165 446,518 5.7%
Industrial
• Little to no supply across the market continues to favor Prairie Shopping Center
Landlords with increasing rents, while leaving little to no
rental concessions until new product comes online.
INDUSTRIAL MARKET BREAKDOWN
• Possible new industrial projects are coming to the market Submarket Inventory (SF) Vacant Inventory (SF) Vacancy
in 2018, which should help the demand by users of 1,500 Coeur d'Alene 1,728,874 63,868 3.7%
SF to 50,000 SF. Post Falls 2,869,130 78,873 2.8%
Rathdrum 462,158 0 0.0%
• Landlords of existing product will continue to see rental
Hayden 1,375,999 35,819 2.6%
escalations into 2018 as new construction rent demands
Dalton Gardens 190,314 0 0.0%
will create significant variations between new and second *Market Data Source: Valbridge Property Advisors
Totals 6,626,475 178,560 2.7%
generation product.
*Market Data Source: Valbridge Property Advisors
KIEMLEHAGOOD.COM MARKET REVIEW & OUTLOOK 2018 11NEW MARKETS Written By
Lance Bacon and Gordon Hester – Kiemle Hagood
TRI-CITIES, WASHINGTON MISSOULA, MONTANA
– Growth Continues In A Strong Economy – Entering A New Market
The Tri-Cities is located in Southeastern Washington and One of our challenges when entering a new market is to
is comprised of Richland, Kennewick, Pasco and numerous quantify the real estate statistics. How many square feet exist
surrounding rural communities. Three rivers, nine golf courses, commercially? What is the current occupancy rate? What are
and 300 days of sunshine offer a wide variety activities and average rents? Once we are able to quantify the market, our
appeal. Because of its easy accessibility, the area is a service job is to then to tell the story of current market conditions and
and occupational hub for the region. The economy is fueled by predict what the future may hold. Missoula is fortunate to have
a variety of government contracted projects for environmental progressive groups who understand the value of assembling
clean-up, scientific research and development, agricultural, this information to ensure developers, business owners and
food processing, general retail and healthcare. investors can make accurate investment decisions.
With a strong economy and job growth, the following projects In 2011, the Missoula Downtown Association, working with
recently occurred or will take place in 2018: the Downtown Business Improvement District and the
Missoula Redevelopment Agency, commissioned a study to
• AutoZone’s 500,000 square foot distribution facility in quantify the building and business inventory in Downtown
Northeast Pasco; Missoula. You can find the study on their website. It is a wealth
• Kadlec Hospital expansion with new multi-level parking of information as to what makes up this vibrant downtown.
structure; The study covered approximately 2.3 million square feet
• New 20,000 square foot Planet Fitness facility on and 766 “units” of commercial space. This survey breaks
Columbia Center Blvd; down property types differently than we would traditionally
classify commercial buildings, but it remains a very insightful
• New Standard Flooring and Paint 24,200 square foot
and interesting outline of what Downtown Missoula looks
facility in former Staples;
like from a commercial real estate standpoint. For us, it is a
• Newly built 20,000 square foot location for Home Goods; great starting point for analysis of what is going on in the real
• Party City and Ulta Beauty expanded with locations in estate market in Missoula, and is a excellent reminder of the
Richland’s Queensgate area; important role these agencies play.
• New quick serve restaurants, Mod Pizza and Panera We have just finished our first year operating in the Missoula
Bread, open in Richland’s Vintner Square; market, and are very pleased to be part of this community. Best
• Continued growth in the Tri-Cities Scientific Research wishes to all of our Montana clients, customers and tenants
District, with WSU Tri-Cities North Richland location; for a successful 2018. We look forward to continuing our due
diligence and research to provide you with the management,
• Two planned Original Pancake Houses in Kennewick and
brokerage and investment information you need.
Richland;
Source: https://www.missouladowntown.com/about/downtown-building-
• Potter BBQ expanding with a second location in business-inventory/
Kennewick;
• Ongoing apartment construction taking place due to the
low vacancy rates;
• Several new and under construction mini-storage
facilities.
Predictions for 2018 are positive as we continue to see
businesses choosing to relocate to the Tri-Cities’ robust
market.
Missoula, Montana
12 MARKET REVIEW & OUTLOOK 2018 Kiemle Hagood*Data Source: U.S. Census Bureau/Sites USA
DEMOGRAPHIC OVERVIEW OF COLUMBIA BASIN REGION
2017 2022 2010 Projected 2017 2017 Estimated 2017
Estimated Projected Census Annual Growth Estimated Median House- Estimated
Population Population Population (2017-2022) Households hold Income Median Age
BENTON COUNTY 199,855 217,991 175,177 1.8% 72,607 $69,473 34.9
Kennewick, WA 83,133 90,359 73,927 1.7% 29,615 $59,515 32.3
Richland, WA 56,574 61,756 48,154 1.8% 22,606 $79,704 38.2
West Richland, WA 14,711 16,085 11,812 1.9% 5,117 $90,561 34.7
FRANKLIN COUNTY 91,089 98,796 78,163 1.7% 26,590 $63,892 28.8
Pasco, WA 70,919 76,927 60,956 1.7% 20,996 $62,788 28,1
DEMOGRAPHIC OVERVIEW OF WESTERN MONTANA REGION
2017 2022 2010 Projected 2017 2017 Estimated 2017
Estimated Projected Census Annual Growth Estimated Median House- Estimated
Population Population Population (2017-2022) Households hold Income Median Age
MISSOULA COUNTY 116,390 127,512 109,299 1.9% 49,469 $51,796 35.1
Missoula, MT 72,438 79,218 66,987 1.9% 32,004 $46,358 32.0
FLATHEAD COUNTY 100,647 110,774 90,928 2.0% 39,926 $53,160 41.3
Whitefish, MT 7,560 8,377 6,343 2.2% 3,344 $53,648 41.4
Kalispell, MT 23,696 25,858 19,747 1.8% 9,702 $47,567 36.3
Tri-Cities, Washington
KIEMLEHAGOOD.COM MARKET REVIEW & OUTLOOK 2018 13K&H Facility Services
Our Mission is to provide comprehensive
facility operation, maintenance and repair to
all types of properties through professional
technicians, efficient and cost-effective
operations, and comprehensive maintenance,
all of which will enhance the value of the
property owner’s investment.
List of Services
• Comprehensive Preventative Maintenance Programs
• On-Site Facility Technicians with Internet Based Work Order Dispatch
• System Life Cycle Management/ Planning and Energy Management Systems
• HVAC System Management
Full Service and Repairs on all Types of Equipment
• Consulting & Analysis
Mechanical System Re-Commissioning, Energy Audits, Energy Efficient Systems
• Electrical
Variable Frequency Drives, Lighting Automation Controls, Branch Circuits, Panels, Switch Gear and Motor Controls
• Indoor Air Quality
System Evaluation, Management of Industrial Hygienists, Planning & Prevention
• Control Systems
Direct Digital Control (DDC), Pneumatic Controls, Calibration & Repairs, Upgrades and Integration
• Plumbing
Preventative Programs and Code Compliance
• Infrared Scanning Services
Electrical Circuit Breaker Panels and Disconnects Proud members of these organizations:
• Life Safety
Oversight and Maintenance
General Contractor License #:
CC01 KFACF927JJ
K&H Facility Services is a wholly owned subsidiary of
Electrical License #:
EC KHFACFS844JL
khfacilityservices.com
3 ne 509.838.6541 | Coeur d’Alene 208.77 0 . 2 5 9 0 | Ke n n e wi c k 5 0 9 . 7 8 3 . 7 6 6 3 | MiKiemle
Spoka 4 0 6Company
s so u&l aHagood .5 5 2 .4 5 6 8MAKING
SPACE FOR
OPPORTUNITIES
We have a new look and a continued focus on creating
Real Estate Solutions for YOU!
Kiemle Hagood is creating real estate solutions—making space for
communities, businesses and residents. Our team members across
the Intermountain Northwest view space as crucial to progress:
making, creating and maintaining spaces for
every vital part of human life.
And, it’s your need for optimal space that drives us.
Kiemle Hagood is the place where connection, innovation and
space come together. We provide space and services to meet the
needs of our community - past, present and always.
Visit us at KIEMLEHAGOOD.COM
Spokane 509.838.6541 | Coeur d’Alene 208.770.2590 | Tri-Cities 509.783.7663 | Missoula 406.552.4568Business. Partners. Businesses are built on relationships. As you work to achieve your goals, STCU offers support at every step. To learn more about STCU’s commercial and business services, go to stcu.org/business, call (509) 326-1954, or visit any STCU branch location. Federally insured by NCUA.
You can also read