Volatility Estimation for Bitcoin on Brazilian Market: Anpec
←
→
Page content transcription
If your browser does not render page correctly, please read the page content below
Volatility Estimation for Bitcoin on Brazilian Market:
                 Speculative Trading Approach and GARCH Models Comparison

                                                                 Emanuelle Nava Smaniotto1
                                                                   Giacomo Balbinoto Neto2

Abstract
This study revisits the volatility around speculative trading and GARCH models of the
Bitcoin Brazilian market. Besides providing an exploratory glace at the value and
volatility about Bitcoin across time, we also test the ratio between volatility versus
speculative trading and explore theoptimal heteroskedasticity model with regards to
goodness-of-fit to Bitcoin price data. Results evidence that on the average day, trading
activity in Bitcoin is speculative; and more, the analysis between volatility and return or
speculative trading does not respond with a direct relation, indicating a high degree of
asymmetric information in Brazilian market. Finally, it is found that the best conditional
heteroskedasticity model is the AR-APARCH.
Keywords: Bitcoin, Currency Markets, Speculation, GARCH, Volatility

Resumo
Este estudo revisa a volatilidade em torno de negociação especulativa e modelos GARCH
do mercado brasileiro de Bitcoin. Além de fornecer uma visão exploratória sobre o valor
e a volatilidade do Bitcoin ao longo do tempo, também testamos a relação entre
volatilidade versus negociação especulativa e exploramos o modelo de
heterocedasticidade ideal em relação aos dados de preço do Bitcoin. Os resultados
evidenciam que, na média diária, a atividade de negociação no Bitcoin é especulativa; e
mais, a análise entre volatilidade e retorno ou negociação especulativa não responde com
uma relação direta, indicando um alto grau de informação assimétrica no mercado
brasileiro. Finalmente, verifica-se que o melhor modelo de heterocedasticidade
condicional é o AR-APARCH.
Palavras-chave: Bitcoin, Mercados de Moeda, Especulação, GARCH, Volatilidade

Área ANPEC: Área 8 - Microeconomia, Métodos Quantitativos e Finanças

JEL: D53. D82. D84

1
  Doutoranda no Programa de Economia Aplicada da Universidade Federal do Rio Grande do Sul (UFRGS).
Contato: manu.smaniotto@hotmail.com
2
  Professor Titular no Programa de Economia Aplicada da Universidade Federal do Rio Grande do Sul
(UFRGS)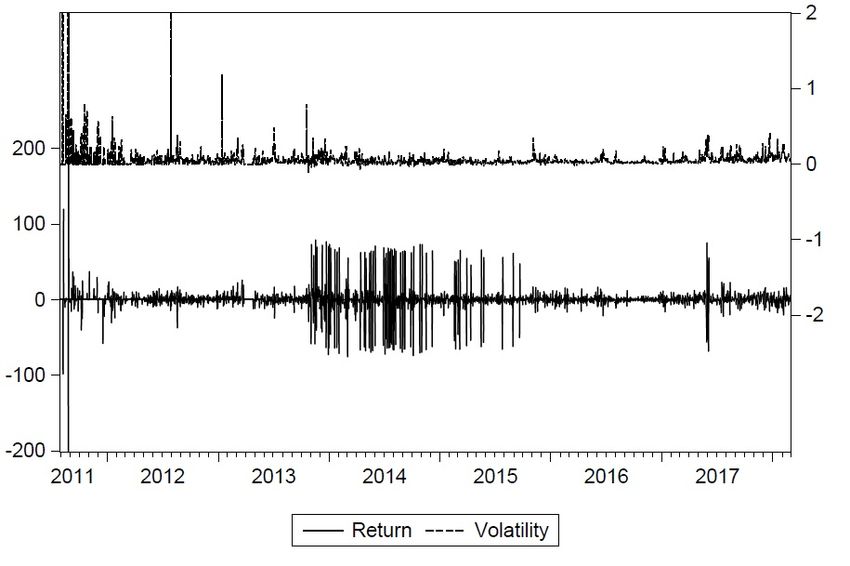
1. Introduction

    Introduced in 2008 by a group of programmers, Bitcoin is a cryptocurrency or virtual money
derived from mathematical cryptography. Compared to other traditional financial assets, Bitcoin
provides investors a new instrument in portfolio management. Over the last few years, there have
been many studies about Bitcoin market. This popularity has attracted the interest of researchers
and practitioners alike, especially looking for a better understanding of the various characteristics
of Bitcoin such as price volatility (Baek and Elbeck, 2015), speculative bubbles (Cheah and Fry,
2015), inneficiency (Nadarajah and Chu, 2017; Bariviera, 2017; Tiwari et al., 2018), price dinamics
(Blau, 2018) and informed trading (Feng et al., 2018).
    Feng et al. (2018) studied informed trade ahead of cryptocurrency-related events, through a
novel indicator. Using a trade-level data of USD/BTC exchange rates, the authors found evidence
of informed trading in Bitcoin market prior to large events: quantiles of buyer-initiated orders
are abnormally high before large positive events, compared to quantiles of seller-initiated. The
profits of informed trading in Bitcoin, could be considerede large. Thus, Blau (2018), kipping
the signaling line, provides an exploratory research of Bitcoin’s volatility across time, and also
test the relationship between volatility and speculative trading. The author concludes a directly
association with speculative trading and Bitcoin’s unusual level of volatility.
    The volatility of digital currency must be questioned: Bitcoin functions are currency? Bitcoin
has certainly been used as a medium of exchange for many consumers, on the other hand we have
the concern that Bitcoin is less of a currency and more a speculative investment. Extending Bitcoin
as a investment, which suffer speculation impact, the virtual money reduces its viability as viable
currency. As Blau (2018) affirms, approximating speculative trading is a difficult task given that
the motives to trade are not observed.
    Bitcoin has therefore a place in the financial markets and portfolio management (Dyhrberg,
2016; Kasiampa, 2017), being certain that examining its volatility is crucial. Moreover, the presence
of long memory and persistent volatility (Bariviera, 2017) justifies the application of GARCH-type
models.
    Another discution point that volatility provides is related with the Efficient Market Hypothesis
(henceforth, EMH). Being a market where exists a free negotiation and normal levels of volatility,
we can consider that the EMH is weak, since the information is available to all participants and
it has no impact on negotiation and price oscillation. The opposite can happen once there are
large price oscillations, which may not be explained by news available in the market; and would
eventually characterize Bitcoin as an asset of speculation, and not so much as currency.
    The objective of this study is threefold. First, we look for provide some stylized facts about
price dynamics of Bitcoin on Brazilian market. Second, we test the fact that speculative trading
in Bitcoin is responsible for its unusual level of volatility. Third, we investigate which conditional

                                                  2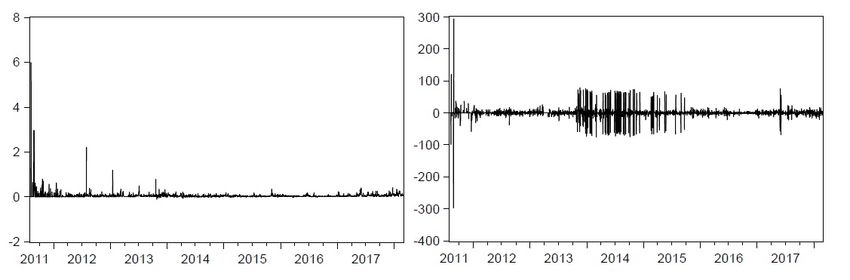
heteroskedasticity model can describe the Bitcoin price volatility better.
    The research contributes to literature in important ways. First, we provide some initial findings
about exchange rate dynamics of Bitcoin on Brazilian market. Second, we demonstrate that the
level of speculative trading, considering the procedure adopted by Llorente et al. (2002), occurs
frequently on Bitcoin Brazilian market into the current period; going against the EMH with strong
evidence - once that volatility presents different behavior if compared to returns, which can be
affected by this event. Third, we found evidence that the optimal model in terms of goodness-of-fit
to the data is the AR-APARCH, which suggests the importance of having both component of
conditional variance.

2. Background on Bitcoin and Speculative Trading

    As detailed previously, around the objetives on this paper, is necessary to present some stylized
facts about the historic price dynamics of Bitcoin and analyze causuality between Bitcoin’s volatil-
ity and speculative trading. In order to further motivate our research, we discuss the background
of Bitcoin and speculative trading aligned to Efficient Market Hypothesis.

2.1. Bitcoin
    Academic interests in anonymous comunications researches date back to early 1980s, and first
digital currency, DigitalCash, was launched in 1990 which offered anonymity through cryptographic
protocols. The peer-to-peer electronic moneraty system was initially described by Nakamoto (2008)
with the objective to explain how the digital currency could be created and implated. In a short
paper, Nakamoto (2008) dicusses the weaknesses of the existing electronic payment system and
identifies the high costs of mediating disputes around the system. To overcome the trust issues
regarding the electronic payment system, Nakamoto (2008) argues that is needed an electronic
payment system based on cryptographic proof instead of trust, allowing any two willing parties to
transact directly with each other without the need for a trusted third party.
    The first Bitcoin transactions occurred in January 2009. More than two years later, various
reports estimated the circulation of Bitcoin to be more than 6.5 million with about 10000 users
(Blau, 2018). While the firts transactions in Bitcoin appeared to function according to the initial
intentions, soon reports began to appear that Bitcoin was being used to purchase illegal drugs.
Policy makers around the world became concerned with the anonymity afforded by Bitcoin. Beyond
the potential to fund criminal activity, some researchers have voiced concerns that, because of the
price dynamics, Bitcoin functions more as a speculative asset than as a medium of exchange.
Considering its anonymity, Bitcoin may be a target by speculators. Reports have attempted to
link the rise and subsequent collapse in the value of Bitcoin through speculative trading.

                                                 3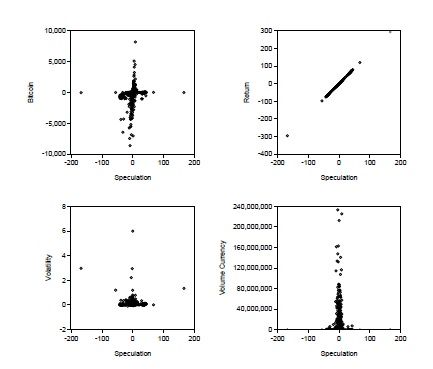
Today, this has manifested itself into a growing Cryptocurrency community which now include
banks, hedgefunds and even Government. The most popular Cryptocurrency, which has the biggest
mark capitalization, is Bitcoin. A $1000 USD investment in Bitcoin in July of 2010 would have
returned $81000000 just seven years later (Phillip et al., 2018). Bitcoin is genereal treated as
speculative (Cheah and Fry, 2015; Baek and Elbeck, 2015). Thus, some evidences suggest the
Cryptocurrency market is still inefficient (Nadarajah and Chu, 2017; Bariviera, 2017; Tiwari et al.,
2018), with properties such as volatility (Urquhart, 2017), infomed trading (Feng et al., 2018) and
price dinamics (Blau, 2018).
    Reports have foccused to link the meteoric rise and subsequent collapse in Bitcoin’s value to
speculative trading. These, seem to have maerit as the theoretical literature nicely describes the
link between speculation and bublles in different asset markets (the most popular, stock market).
For example, Stein (1987) proves that the presence of speculation can inhibit arbitrage and lead
destabilized asset prices. Thus, Shiller (1981) gives some additional insight, showing the link
between speculation and destabilization of prices in equity markets; the author suggests that the
observed excess volatility in speculative prices contradicts the EMH. The idea motivating this paper
is that as a network the flow of contracts and negotiations (speculative trading) is key determinant
for Bitcoin’s price behavior.
    Cheah and Fry (2015) test for evidence of speculative bubbles in Bitcoin returns. The authors
find that as with other asset classes, Bitcoin prices are prone to speculative bubbles, and the
bubble component contained within Bitcoin prices is substantial. In a more recent study, Cobert
et al. (2018) analyse through time and frequency domain the relationships between three popular
cryptocurrencies and a variety of other financial assets, with concluding results that support the
view that cryptocurrencies may offer diversification benefits for investors with short investment
horizons. Blau (2018) test the volatility of Bitcoin and speculative activity; showing the debate
behind cryptocurencies be a speculative investment asset or currency.
    Baek and Elbeck (2015) find evidence to suggest that Bitcoin returns are driven by buyers
and sellers internally, and not by fundamental economic factors. Using de-trended ratios, the
authors determine Bitcoin returns to be 26 times more volatile than those of the SP 500 index,
suggesting that Bitcoin is a speculative investment vehicle. The authors however, determine that
this classification may change as usage grows, volatility decreases and Bitcoin attracts market and
economic influence. In doing so, Bitcoin may become a more balanced investment vehicle, driven
both internally and externally. Finally, Kasiampa (2017) explores the ability of several competing
GARCH-type models to explain the Bitcoin price volatility, and find that Bitcoin is different from
any other asset on the financial market and thereby creates new possibilities for stakeholders with
regards to risk management, portfolio analysis and consumer sentment analysis.

                                                 4
2.2. Speculative Trading and Efficient Market Hypotehsis
The EMH is a fundamental concept of financial economics. Over a century ago, Bachelier
(1900) developed the first mathematical model of security prices, applying the arithmetic Brownian
motion model to French bonds. The systematic study of informational efficiency begun on 60s,
when financial economics was borns as a new area within economics. The classical definition due
to Fama (1970) which afirms that a market is informationally efficient if it can reflect all avaible
information on circulation. Briefly, the EMH requires that returns of financial assets follow a
memoryless stochastic process with respect to the underlying information set.
Therefore, the key element in assessing efficiency is to determine the appropriate set of infor-
mation that impels prices. According to the author, informational efficiency can be considered
into three categories: (i) weak efficiency, if prices reflect the information cointed in the past se-
ries of prices, excluding the possibility of finding, systematically, profitable trading strategies; (ii)
semi-strong efficiency, if prices reflect all public avaiable information; and (iii) strong efficiency,
when prices reflect all public and private information. A part of literature focused on lon-range
dependence study. Considering a financial market as a dynamical structure, short term memory
can exist without contradicting the EMH. In fact, the presence of some mispriced assets is the
necessary stimulus for individuals trade and reached an arbitrage free situation. On the other
hand, the presence of long range memory is at odds with the EMH, because it would allow an
stable trading rule to beat the market.
There are several studies that find long memory on financial assets time series, using different
methods. For example, McCarthy et al. (2009) find long memory in yields of corporate bonds and
spread of returns of corporate bonds and treasury bonds. Another issue in the literature is the time
varying beahvior of the market efficiency. In this knowledge area, Ito and Sugiyama (2009) find
that inefficiency varies through time in the US stock market. Kim et al. (2011) find that returns
predictability is altered by political and economic crises but not during market crashes. Bariviera
(2017), using the Hurst exponent, find that the long memory content of daily volatility is stronger
than in daily returns; in particular, volatility clustering is a key features of the Bitcoin market.
3. Data and Methodology
We collect data from www.bitcoincharts.com which provides complete history of various Bitcoin
exchanges denoted in various exchanges. The data consists of daily closing prices of Brazilian
operators (FoxBit, LocalBitcoin, Mercado Bitcoin, Bitcoin to You, Brasil Bitcoin Market) from 1st
August 2011 to 28th February 2018 therefore capturing almost seven 7 years of Bitcoins prices.
We compute the results for the usual daily logharithmic return:
rt = (lnPt − lnPt−1 ) ∗ 100 (1)
5and the daily price volatility, definined as the logharithmic difference between intraday highest
and lowest price:
ReturnV olatility = lnPthigh − lnPtlow (2)
Objectifying to measuring speculative trading, we follow Blau (2018) and Llorente et al. (2002)
and use a time series model that identifies the dynamic relation between volume and prices. We
estimate daily turnover on day t in the following equations:1
logturnt = log(turnt + 0.000025) (3)
−1
1 X
vt = logturnt − logturnt (4)
50 s=50
vt is the (50-day) de-trended measure of trading acitivity. Llorente et al. (2002) then estimates
the following time-series equation.
Rt+1 = β0 + β1 Rt + β2 Rt xvt + t+1 (5)
The dependent variable Rt+1 is the daily returns for Bitcoin on day t + 1. Llorente et al.
(2002) argue that when β2 is positive, volume is likely to represent speculative trading. Under this
circumstance, trading volume directly affects the serial correlation in asset returns. When β2 is
negative, trading volume inversely affects return autocorrelation and can be thought of as hedging
activity.
A plot of the data is shown in Figure (1), which detailed: BTC/BRL volume currency and
weighted price, BTC/BRL daily returns and BTC/BRL daily returns volatility. We clearly notice
that the long bull market lasted almost 1 year before it ended in July 2017 - July and August are
the months during which we captured a major structural break in Bitcoin prices.
If compared to USA bull market (Balcilara et al., 2017), we notice that lenght Brazilian’s
bull is 31 that USA’s bull. This phenomenon may have several explanations. The high degree of
speculative trading, guided in the context of information asymmetry in the Brazilian market, may
lead to greater price sensitivity. In this way, we will have a lower peak of high prices, followed by
sudden fluctuations, which will not be accompanied by asset price returns - since these are market
failures and speculations, not real oscillations of the investment in question.
1
Following prior research (Llorente et al., 2002) we use turnover as the ratio of daily Bitcoin volume and the
number of outstanding Bitcoins. We note that we add a small constant (0.00000255) to volume to account for days
without trading volume (fact that occurs consistently between the years 2011 and 2014). This constant is further
shown to normalize the distribution of trading volume in Llorente et al. (2002) and Blau (2018).
6Figure 1: BTC/BRL: (i) volume currency and weighted price, (ii) daily returns, and (iii) daily returns
volatility
Note: Figure reports some important time series: volume currency concerns to daily trading
volume in Bitcoin into Brazilian market; weighted prices is the ratio of volume currency
and volume Bitcoin; daily returns is the Bitcoin log return solved by (1) and daily returns
volatility is the estimate of volatiliy as detailed in (2)
4. Results
4.1. Univariate Correlation
Table 1 presents the descriptive statistics for Bitcoin returns, volatility, traded volume and
speculation. We estimate Eq. (4) using 50-day rolling windows so that each day has a measure
of speculative trading (Speculation). The estimate for β2 from equation (5) is 0.5659, indicating
that on the average day, trading activity in Bitcoin is speculative according to the definition in
Llorente et al. (2002). We observe that volume (Volume Currency) is more volatile than returns
7(Return) in the Brazilian Bitcoin market. On the average day, trading volume (Volume Currency)
is more than 3,000,000, and turn (Log Turn) is approximately 2.6527%. The percent change for
the average exchange rate on the average day (%∆Bitcoin) is -1.12% while volatility (Volatility)
is 0.0575%.
If we observe the results about volatility (Volatility) and the daily price variation of Bitcoin
(%∆Bitcoin), we can again observe the intensity of information asymmetry, since the price of
Bitcoin in the Brazilian market fluctuates considerably. Even with a high peak in trading volume
and appreciation in 2017, it has daily and negative price variation. That is, investors are led to
buy and sell assets, guided by market trends, forming the speculative trading movement, so make
the price of the asset fluctuate more than necessary.
Faced with this initial estimate, around the conclusion that on the average day, trading activity
in Bitcoin is speculative according to the definition in Llorente et al. (2002), we give suport to EMH
on strong evidence. This conclusion concerns that prices reflect instantly even hidden or privileged
information. On the other hand, the long term behavior of returns and volatility are different.
This kind of behavior could hide some complex underlying dynamics, which exceeds the aim of
this analysis until this moment.
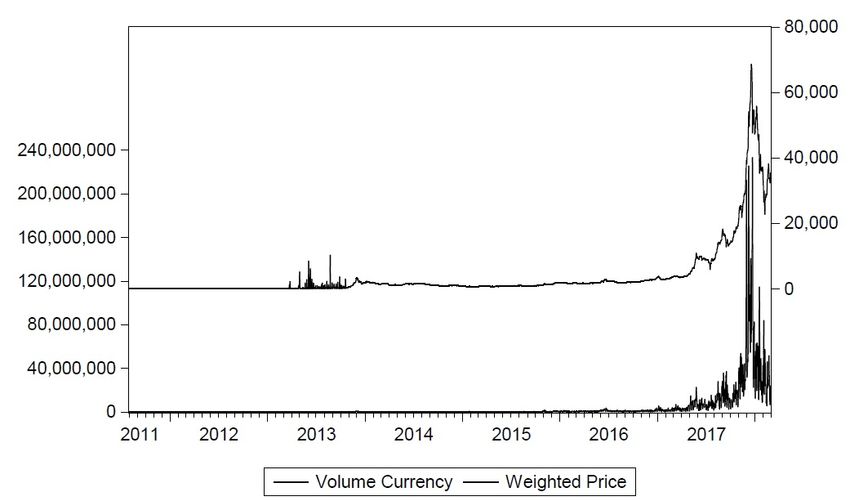
This conclusion becomes evident when we analyze on a more specific scale the behavior of daily
return volatility (Volatility) and daily return (Return): is possible to observe that in bull period
the returns do not follow the behavior of volatility. Still, in several moments the trajectories are
divergent, reflecting the high degree of speculation of the market; as demonstrate in Figure 2.
Figure 2: BTC/BRL: Daily Return x Daily Return Volatility
8Table 1: Summary Statistics
The table reports summary statistics for a variety of different variables. Table reports the statistics for the Bitcoin: Bitcoin
is the value of Bitcoin in R$. %∆Bitcoin is the daily percent change in the value of Bitcoin. Volume Bitcoin it the daily
value on Bitcoin’s contracts negotiated. Volume Curreny is the daily value on Bitcoins’s on monetary terms (here, R$). Log
Turn is the daily turnover ratio of the daily volume scalled. Volatility is the daily return volatility on Bitcoin’s Brazilian
Market. Return is the daily return on Bitcoin’s Brazilian Market.
Bitcoin %∆Bitcoin Volume Bitcoin Volume Currency Log Turn Volatility Return
Mean 3,777.44 -1.12 289.09 3,589,526.00 2.6527 0.0575 0.3351
Median 1,057.95 -0.05 134.54 133,587.20 3.0244 0.0336 0.0000
Maximum 68,610.76 81.94 5,401.37 2,330,000,000.00 4.8363 5.9914 294.2859
Minimum 0.00 -86.29 0.00 0.00 -5.5934 -0.1024 -296.7330
Std. Dev. 9097.38 6.54 428.53 14,764,957.00 1.2426 0.1727 17.3129
Skewness 4.04 -0.03 3.74 8.30 -1.4627 22.2259 0.01785
Kurtosis 20.53 0.64 26.71 94.40 8.4082 658.3414 80.6928
Jarque-Bera 37,357 3,801 61,944 864,559 37,87 43,216,737 604,624
Probability 0.00 0.00 0.00 0.00 0.0000 0.0000 0.0000
9Therefore, when we analyze the relation between speculative trading and another variables,
as shown in Figure (3), is possible to confirm the hypothesis around the assymetric information.
Speculation has a perfect correlation with Return, for obviously second equation which estimated
it. Thus, speculative trading does not respond positively or negatively to daily return volatility
(Volatility) , with exception for some extreme cases (we can imagine they are news events). Even
more, Speculation is indifferent to the daily monetary value in circulation (Volume Currency), since
it does not present variations when it occurs in high peaks. Lastly, speculative trading responds in
a way aligned to the daily variations in Bitcoin’s price in Brazilian market (Bitcoin), when these
have a high variance; that is, when there are significant increases or reductions.
Interestingly, Blau (2018) did not found that volatility (or the extreme indicator variables) is
positively related to speculative trading. By this way, we observe a similarity between USA Bitcoin
market and BRL Bitcoin market.
Figure 3: Speculative Trading Behavior
The graphics reports summary behavior for a variety of different variables. Figures reports
the relation for speculative trading (Speculation) comparing to the daily percent change in the
value of Bitcoin (Bitcoin), the daily return volatility on Bitcoin’s Brazilian Market (Volatility),
the daily return on Bitcoin’s Brazilian Market (Return) and the daily value on Bitcoin in
monetary terms, here R$, (Volume Curreny).
We estimate volatility as the long-run average standard deviation in a GARCH(1,1) model.
10The model can be written as follows:
2
σt2 = γVt + αm2t−1 + βσt−1 (6)
We, however, estimate the following version of the model below:
2
σt2 = ω + αµ2t−1 + βσt−1 (7)
and obtain estimated parameters for ω, α and β. Once these parameters are obtained, we can
estimated γ, where γ = 1 − α − β . Since ω = γVl and we observe σt2 , we solve for the long-run
variance Vl . Our measure of volatility is the square root of this numeric solution for the long-run
variance.
Table 2 reports the matrix of Correlation Coefficients. A few results are noteworthy. First, spec-
ulative trading (Speculation) and Bitcoin returns volatility (GARCH(1,1)) are positively related.
Interestingly, we find that volatility (GARCH(1,1)) is positively related do speculative trading
(Speculation), which confirms our proposition around Bitcoin and an opportunity of speculative
investment.
Table 2: Correlation Matrix
Note: This table reports the Correlation Coefficients. The variables included in the matrix are
our variables about speculative trading (Speculation), the Bitcoin daily return (%∆ Bitcoin),
our estimate for volatility (GARCH(1,1)), indicator variables High and Low.
Speculation %∆ Bitcoin GARCH(1,1) Volume Currency Low High
Speculation 1 0.1906 0.0885 -0.0008 0.0039 0.0017
%∆ Bitcoin 0.1906 1 0.0465 -0.2793 -0.3097 -0.3267
GARCH(1,1) 0.0885 0.0465 1 -0.0883 -0.0490 -0.0585
Volume Currency -0.0008 -0.2793 -0.0883 1 0.7864 0.8180
Low 0.0039 -0.3097 -0.0490 0.78644 1 0.9974
High 0.0017 -0.3267 -0.0585 0.8180 0.9974 1
4.2. Multivariate Tests
Next, we provide a more robust multivariate test, estimating the following equation:
GARCH(1, 1) = β0 + β1 Speculationt + β2 %∆Bitcoint−5,t−1 + β3 V olumeCurrency + t (8)
We estimate Equation (8) using GMM and report p-values that are obtained form Newey and
West standad errors. Table 3 reports simple regressions in colums. We find that the daily percent
change in the value of Bitcoin (%∆Bitcoin) has a positive impact on volatility (GARCH(1,1)), but
11is not statistically significant. Thus, daily value on Bitcoin (Volume Currency) produces negative
estimates while speculative trading (Speculation) produces positive coefficients. These results
indicate that while daily value on Bitcoin’s on monetary terms do not affect directly volatility,
speculative trading affects.
Table 3: Volatility Regressions
Note: The table reports the results from estimating the following equation using GMM.
GARCH(1, 1) = β0 + β1 Speculationt + β2 %∆Bitcoint−5,t−1 + β3 V olumeCurrency + t
The dependent variable is GARCH(1,1), which is our estimate for Bitcoin volatility. The
independent variables include our measure of speculative trading (Speculation), the prior
five-day Bitcoin return (%∆Bitcoin), the daily value on Bitcoin’s on monetary terms (Volume
Currency). The equation is estimated using GMM and p-values, which are obtained form
Newey and West standard errors are reported in parentheses. *,**,*** denote statistical
significance at the 0.10, 0.05, 0.01 levels, respectively.
Intercept Speculation %∆Bitcoin Volume Currency R2
-0.0053 *** 0.0001 * 0.0014 -0.0001 ***
0.1566
(0.0005) (0.0001) (0.0000) (0.0000)
4.3. Volatility Estimation: A Comparison of GARCH Models
Bitcoin has therefore a place in the financial markets and in portfolio management, and ex-
amining its volatility is crucial. Moreover, the presence of long memory and persistent volatility
(Bariviera, 2017) justifies the application of GARCH-type models (Kasiampa, 2017).
Autoregressive conditional heteroskedasticity (ARCH) was developed in order to forecast the
variance of financial and economic time series during time. ARCH models have been generalized to
become the generalized ARCH or GARCH models. These models have become common tools for
dealing with time series heteroskedastic models; providing a volatility measure that can be utilized
in portfolio selection, risk analysis and derivative pricing.
A GARCH (1,1) model is very common in financial time series data, but ARCH and GARCH
models have been expended in the direction of returns, not just the magnitude. They include,
for example, the IGARCH model which allows for volatility shocks to be permanent, the TARCH
(threshold ARCH) and the EGARCH (exponential GARCH) which consists in asymmetric models
that allow negative shocks to behave differently from positive shocks. An EGARCH overcomes
the problem around the standard ARCH/GARCH models where symmetry is imposed on the
conditional variance.
In 1993 was introduced a new variant called the power ARCH (PARCH) model. In this inovation
to the ARCH family, the power term is estimated within the model rather than being imposed
by the author. The advantage is that rather than imposing a structure on the data, the PARCH
12model allows a power transformation term inclusive of any positive value and so permits a virtually
infinite range of transformations.
The power term is the means by which the data are transformed. Term captures volatility
clustering by changing the influence of the outliers. However, when the data is non-normally
distributed, or where it is not otherwise possible to characterize the distribution on mean and
variance, the utilization of a squared power transformation is not appropriate and other power
transformations are necessary in order to use higher moments to adequately describe the distribu-
tion.
Backing to our subject of interest, earlier studies have applied GARCH-type models, such as
the linear GARCH (F Glaser, 2014), the Thresold GARCH (TGARCH) (Dyhrberg, 2016; E Bouri,
2017), the Exponential GARCH (EGARCH) (Dyhrberg, 2016; Kasiampa, 2017). However, as
most of the previous studies have foccused on USA market, and the most of it used a single
conditional model, a question that remains unanswered is which conditional heteroskedasticity
model can better explain the Bitcoin Brazilian’s data. Hence, the aim to finalize this research is
to investigate which conditional heteroskedasticity model can describe the Bitcoin price volatility
better over the whole period since its introduction on Brazilian’s market.
Table 4 presents the different GARCH-type models used in this research, namely GARCH,
EGARCH, TGARCH, Asymetric Power ARCH (APARCH). The optimal model is chosen according
to three information criteria, namely Akaike (AIC), Bayesian (BIC) and Hannan-Quinn (HQ), all
of which consider both how good the fitting of the model is and the number of parameters in
the model, rewarding a better fitting and penalising an increased number of parameters for given
datasets. The selected model is the one with the minimum criteria values.
Table 4: GARCH-type models used
GARCH h2t = ω + αu2t−1 + βh2t p
EGARCH log(h2t ) = ω + α[| uht−1
t−1
| − 2/π] + βlog(h2t−1 ) + δ uht−1
t−1
TGARCH h2t = ω + αu2t−1 + βh2t−1 + γu2t−1 It−1
hδt = ω + α(|ut−1 | − γut−1 )δ + βhδt−1
APARCH
h2t = qt + α(u2t−1 − qt−1 ) + β(h2t−1 − qt−1 )
Table 5 shows the estimation results of the GARCH-type models. It can be noticed that
the log-likehood value is maximised under the AR-APARCH model. Interestingly, all the three
information criteria also select the AR-APARCH model. Moreover, all the parameter estimates
are statistically significant for the AR-APARCH model which indicate that the selected model is
appropriate for the Bitcoin daily returns volatility. Finally, even though the residuals of the AR-
APARCH model still depart from normality, the value of the Jarque-Bera test has considerably
decrease.
13All in all, the AR-APARCH model appears to be an appropriate tool to describe the volatility
of the Bitcoin daily returns volatility. This finding opens opportunities for application of other
GARCH models related to the Brazilian market of Bitcoin, as reported in studies in the North
American market, using the models CGARCH and ACCGARCH, as Kasiampa (2017).
Table 5: Estimation results of GARCH-type models for Bitcoin daily return volatility
Note: Standard errors os estimates are reported in parentheses. The p-values associated with
the statistical tests are presented in brackets. * Represents the significance at the 10%. **
Represents the significance at the 5% level. *** Represents the significance at the 1% level.
AR-GARCH AR-EGARCH AR-TGARCH AR-APARCH
Const (c) 0.0256 *** 0.03085 *** 0.02188*** 0.0285 ***
(0.0003) (0.0007) (0.0000) (0.0007)
AR(1) (φ1 ) 0.6389 *** 0.6639 *** 0.6120*** 0.6102 ***
(0.0174) (0.0126) (0.0080) (0.0066)
Const (ω) - 0.0000 *** -0,2072 *** 0.0000*** 0.0004 ***
(0.0000) (0.0018) (0.0000) (0.0000)
ARCH (α) 0.4546 *** 0.1255 *** 0.2437*** 0.1393 ***
(0.0068) (0.0045) (0.0036) (0.0036)
GARCH (β) 0.8397 *** 0.1422 *** 0.8562*** -0.5469 ***
(0.0019) (0.0028) (0.0021) (0.0021)
EGARCH (δ) - 0.9780 *** - -
- (0.0005) - -
TGARCH (γ) - - -1.1164*** -
- - (0.2679) -
APARCH (δ) - - - 0.9129 ***
- - - (0.0021)
APARCH (γ) - - - 0.0253 ***
- - - (0.0253)
LL 2882.862 2875.445 2450.179 2948.547
AIC -2.3950 -2.3880 -2.0350 -2.4480
BIC -2.3854 -2.3760 -2.0254 -2.4336
HQ -2.3915 -2.3836 -2.0315 -2.4427
JB 3939601 2900663 4330588 2833245
145. Conclusion
Although a large amount of literature has focused on the role of traded volume in predicting
movement in stock returns and volatility and inefficiency of Bitcoin into USA market, the pre-
dictability of speculative trading for the returns and volatility in the Bitcoin market remains few
explored on a genereal context, and unexplored into Brazilian market. To address this literature
gap, we examine daily data covering the period of 1st August 2011 to 28th February 2018, which
interestingly show that Bitcoin returns, volatility and volume do not follow a same trajectory.
Methodologically, behind provide an exploratory analysis about value and volatility of the Bitcoin
on Brazilian market across time, we employ a speculative trading test based on Llorente et al.
(2002) and explore the optimal heteroskedasticity model with regards to Bitcoin price data.
Our results are summarizes as follows: First, the Bitcoin’s bull on Brazilian market presented
a short duration, given the volatility exposed into period; showing signs of asymmetry in market
information. Second, the estimated β2 from Llorente et al. (2002) equation is positive, indicating
that on the average day, trading activity in Bitcoin is speculative. Third, we observed the different
trajectories between volatility and return, reflecting the high degree of speculation of the market.
Fourth, we prove the ability of several competing GARCH-type models to explain the Bitcoin price
volatility; and find evidence that the optimal model in terms of goodness-of-fit to the data is the
AR-APARCH, a result which suggests the importance of having both component of conditional
variance.
For intance, a viable explanation for the speculative trading may be the presence of high
assymetric information degree on Brazilian market. By the way, it would be ideal to continue our
tests exploring other possible explanations for speculative trading and volatility fluctuations.
On the other hand, Bitcoin is different from any other asset on the financial market and so
creates new opportunities for stakeholders with regards to risk management and portfolio analysis.
Hence, it can be an useful tool for managements, and our results can help investors make more
informed decisions.
15References
Bachelier, L. (1900). Theorie de la speculation. Annales scientifiques de lEcole Normale Superieure.
Baek, C. and Elbeck, M. (2015). Bitcoins as an investment or speculative vehicle? a first look.
Applied Economics Letters, 22.
Balcilara, M., Bourid, E., Guptac, R., and Roubaudb, D. (2017). Can volume predict bitcoin
returns and volatility? a quantiles-based approach. Economic Modelling, 64.
Bariviera, A. F. (2017). The inefficiency of bitcoin revisited: A dynamic approach. Economics
Letters, 161.
Blau, B. M. (2018). Price dynamics and speculative trading in bitcoin. Research in International
Business and Finance, 43.
Cheah, E.-T. and Fry, J. (2015). Speculative bubbles in bitcoin markets? an empirical investigation
into the fundamental value of bitcoin. Economics Letters, 130.
Cobert, S., Megan, A., Larkin, C. J., Lucey, B. M., and Yarovaya, L. (2018). Exploring the dynamic
relationships between cryptocurrencies and other financial assets. Economics Letters, 165.
Dyhrberg, A. H. (2016). Bitcoin, gold and the dollar - a garch volatility analysis. Financial
Research Letters, 16.
E Bouri, G Azzi, A. H. D. (2017). On the return-volatility relationship in the bitcoin market
around the price crash of 2013. Economics, 11.
F Glaser, K Zimmarmann, M. H. M. C. W. M. S. (2014). - asset or currency? revealing usersâTM
hidden intentions. Twenty Second European Conference on Information Systems.
Fama, E. F. (1970). Efficient capital markets: A review of theory and empirical work. Journal of
Finance, 25.
Feng, W., Wang, Y., and Zhang, Z. (2018). Informed trading in the bitcoin market. Finance
Research Letters, fourthcoming.
Ito, M. and Sugiyama, S. (2009). Measuring the degree of time varying market inefficiency. Eco-
nomics Letters, 103.
Kasiampa, P. (2017). Volatility estimation for bitcoin: A comparison of garch models. Economic
Letters, 158.
16Kim, J. H., Shamsuddin, A., and Lim, K. P. (2011). Stock return predictability and the adaptive
markets hypothesis: Evidence from century-long u.s. data. Journal of Empirical Finance, 18.
Llorente, G., Michaely, R., Saar, G., and Wang, J. (2002). Dynamic volume-return relation of
individual stocks. Review Financial Studies, 15.
McCarthy, J., Pantalone, C., and Li, H. C. (2009). Investigating long memory in yield spreads.
Journal of Fixe Income, 19.
Nadarajah, S. and Chu, J. (2017). On the inefficiency of bitcoin. Economics Letters, 150.
Nakamoto, S. (2008). Bitcoin: A peer-to-peer eletronic cash system.
Phillip, A., Chan, J. S., and Peiris, S. (2018). A new look at cryptocurrencies. Economics Letters,
163.
Shiller, R. (1981). The use of volatility measures in assessing market efficiency. The Journal of
Finance, 159.
Stein, J. C. (1987). Informational externalities and welfare-reducing speculation. Journal of Po-
litical Economy, 95.
Tiwari, A. K., Jana, R., Das, D., and Roubaud, D. (2018). Informational efficiency of bitcoinâ”an
extension. Economics Letters, 163.
Urquhart, A. (2017). Price clustering in bitcoin. Economics Letters, 159.
17You can also read