REGIONAL MANUFACTURING PROFILE - PEEL-HALTON REGION
←
→
Page content transcription
If your browser does not render page correctly, please read the page content below

REGIONAL MANUFACTURING
PROFILE
PEEL-HALTON REGION

                                                        Peel-Halton 2014 Economic and Demographic Profile
                                                        Population                                                   1,963,980
                                                        Employment*                                                    981,489
                                                        Manufacturing Share of Employment                                  14%
                                                        Unemployment Rate                                                   5%
                                                        Real GDP ($2007 Millions)                                        87,171
                                                        Manufacturing Share of GDP                                          16%
                                                        Manufacturing Hiring Requirement (2014-2023)                     38,905
                                                        Recruitment Gap (2014-2023)                                      19,493
*place of residence (POR)

HIGHLIGHTS

The Peel-Halton Region will experience significant recruitment challenges in the manufacturing industry, facing a recruit-
ment gap of over 19,400 workers over the next 10 years. The reasons behind recruitment challenges are fourfold:
    1) A large demographic challenge: the manufacturing workforce is older than the overall labour force of the region.
       As these workers retire in the next 10 years, the manufacturing industry is projected to have difficulty filling skilled
       trades and technical positions.
    2) Competition from other industries: occupations such as sheet metal workers, electrical and electronics engineers,
       and industrial mechanics are also highly demanded in other industries such as construction, utilities, and professional
       services. It will be especially difficult to attract those workers due to faster growth rates experienced by competing
       industries and higher wages offered in some cases (e.g., utilities and mining).
    3) Dependence on net migration: Peel-Halton’s recruitment challenges may be exacerbated by low levels of in-
       migration. The region will critically depend on its propensity to receive migrants from other provinces and from outside
       the country to fill many manufacturing positions during the next few years.
    4) Occupational characteristics: some occupations are harder to fill across the manufacturing industry and the country
       due to low supply. The Peel-Halton Region will be particularly challenged to find construction millwrights, motor vehi-
       cle assemblers, machinists and machining and tooling inspectors, and welders.
Potential solutions to these recruitment challenges include increasing training and apprenticeship in the workplace,
advocating for increases in government support for training, promoting manufacturing as a career option, and establishing
training consortia.
PEEL-HALTON

          THE PEEL-HALTON REGION
    The Peel-Halton Region is comprised of two adjacent municipalities located in the western side of the Greater Toronto
    Area. It is home to the Toronto Pearson International Airport and is on seven 400-series highways connecting Toronto to
    the US and the rest of Canada.
    The Peel-Halton economy was negatively im-
    pacted by the downturn of 2009, contracting by
    3.1%. In 2010, the Region rebounded quickly,                                           Real GDP
    making up for the lost output of the previous                                            Real GDP
    year and adding to it. Peel-Halton has solid            100,000                                                                    6.0

    fundamentals that will carry the Region forward          90,000

    during the next few years with a real GDP                80,000                                                                    4.0
                                                             70,000
    growth rate that is higher than the Canadian

                                                                                                                                             Percentage Change
                                                             60,000                                                                    2.0
    average.                                                 50,000
                                                             40,000                                                                    -
    Key sectors contributing to the local GDP in-            30,000
    clude finance and insurance, manufacturing,              20,000                                                                   -2.0
    wholesale trade, transportation, and various             10,000
    services. These industries made up 20%, 17%,                 0                                                                    -4.0

    11%, and 8% of total output respectively. As of
    2013, manufacturing with its 17% percent of                           Total GDP ($2007 Millions)         Annual Growth Rate (%)
    the Region’s economic output and 14% of em-
    ployment is a major source of work and income
                                                                                             Source: Prism Economics, Strategic Projections Inc.
    for a sizeable portion of the Region’s residents.
    This snapshot of industry shares is useful in
    understanding the current distribution of eco-
    nomic output in the Region. However, it is silent                       Industry Share of GDP, 2013
    about the trends that are affecting this distribu-
    tion. A time-series approach demonstrates that
    manufacturing is in decline both in terms of
    GDP generated and employment. In 2006,
    manufacturing made up 21.3% of total output in
    the Region, and 19% of employment. Even
    though the industry will grow slightly in absolute
    terms during the next few years, it will continue
    its decline relatively to other industries of the
    Region.
    Employment levels have been in decline in only
    a few other industries such as agriculture, and
    the residual services categories. Other indus-
    tries have added their workforce consistently
    with increasing output levels. Industry employ-
    ment is expected to slightly increase during the                                         Source: Prism Economics, Strategic Projections Inc.

    next decade.

2   REGIONAL MANUFACTURING PROFILE PEEL-HALTON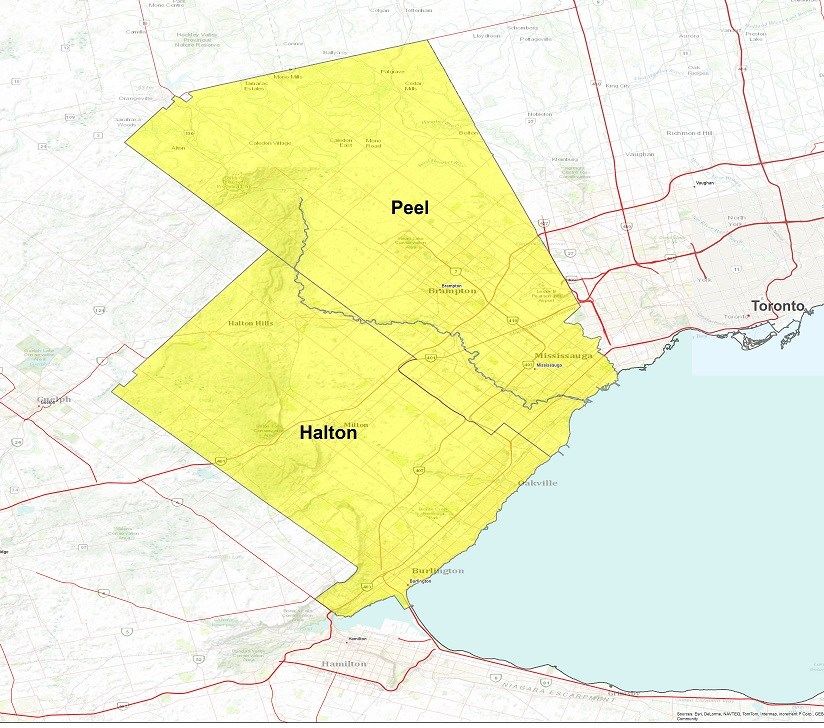
PEEL-HALTON
THE MANUFACTURING OUTLOOK
A longitudinal look at the manufacturing output Annual Change (%) in Manufacturing Output
reveals that the industry has already been in de-
cline before the financial crisis of 2009. The reces-
sion exacerbated this by doubling the rate of de-
cline in one year. The industry contracted by
15.4% that year, 2.2% more than overall Canadi-
an manufacturing. The industry rapidly recovered
during the following years, only to revert to a de-
cline in output in 2013. Manufacturing in the Re-
gion is forecasted to grow, albeit very slowly, dur-
ing the next three years.
The opportunities facing the industry include:
Favourable Canadian vs. U.S. dollar ex-
change rate
Optimistic U.S. economic growth and there- Source: Prism Economics, Strategic Projections Inc.
fore demand
Decrease in fuel and therefore transportation costs
Rising manufacturing machinery and equipment investment
Although manufacturing will maintain its role as an important economic force of the region, its rate of expansion will
be surpassed by other industries such as construction, professional services, information and culture, wholesale and retail
trade, which are expected to grow at a rate of above 4% per year.
Annual Average GDP Growth by Industry, Peel-Halton, 2009-2018
Professional, scientific, technical services
Construction
Information, culture
Retail trade
Wholesale trade
Other business services
Finance, insurance
Other services
Industry
Government
Health, social services
Education
Transportation, warehousing
Accommodation, food
Agriculture, other primary
Arts, entertainment, recreation
Utilities
Mining, oil and gas
Manufacturing
-2.0% 0.0% 2.0% 4.0% 6.0% 8.0%
Average Annual Growth Rate (%) 2009-13 2014-18
Source: Prism Economics, Strategic Projections Inc.
REGIONAL MANUFACTURING PROFILE PEEL-HALTON 3
PEEL-HALTON

        The growth of competing industries are expected to translate into higher labour demand. This will create significant
        recruitment challenges for manufacturing, especially for the occupations that are also needed by other growing
        industries such as professional services (i.e. electrical engineers), construction (i.e. construction millwrights
        and industrial mechanics), and transportation and warehousing (i.e. transport truck drivers).

        RISING INVESTMENT IN MANUFACTURING AND RISING PRODUCTIVITY
        OF THE MANUFACTURING WORKFORCE

        Since the recession hit its lowest point in 2009, manufacturing in Ontario has been investing heavily in machinery
        and equipment. The chart below displays provincial data and shows an increase of 35% in investment between the
        years 2009-2014. However, the rise in investment did not effect into a similar increase in employment. In fact, the rise
        in manufacturing output can largely be explained by increasing productivity of the manufacturing workforce.

                                  Manufacturing Output and Employment, 1991 to 2014

                                                                                      Source: Prism Economics, Statistics Canada

        POPULATION, DEMOGRAPHICS AND LABOUR FORCE

                                                                           Population

                  Region                    2006           2013           2018        5 years Growth Rate (2014-18)

                Peel-Halton              1,670,532      1,927,292      2,119,447                         2.0%
                                                                                   Source: Prism Economics, Strategic Projections Inc.

4 REGIONAL MANUFACTURING PROFILE PEEL-HALTON
PEEL-HALTON

The population in the Peel-Halton Region has grown by 256,760, an increase of 15 percent, between 2006 and 2013,
with an annual average rate of 36,680 persons per year. Projections for the Region indicate that, growing at an annual
average rate of 2%, the population will reach 2,119,447 by 2018. The Region will experience the effects of ageing as
65 year old or older individuals will reach 17% of total population by 2024. However, the sharp increase in the 25-34
age bracket will prevent labour shortages and contribute to a sustained birth rate for the next 10 years.

                                                                        Age distribution of Peel-Halton Population, 2006-2024

                                                                                                                                                    Source: Prism Economics, Strategic Projections Inc.

THE DEMOGRAPHICS OF THE MANUFACTURING WORKFORCE

The aging manufacturing demographics are even more pronounced than the overall aging population of the region.
The following chart illustrates the age differential between the manufacturing workforce and the total working age pop-
ulation in Peel-Halton. The manufacturing workforce is stacked on the right hand side of the graph, with a larger por-
tion of workers over the age of 45 than the total working age population.

                                                                   Peel-Halton, Manufacturing Demographic Distribution

                                                                                  Manufacturing Workforce                           Total Workforce

                                             4.0%
       Share of working age population (%)

                                             3.5%
                                             3.0%
                                             2.5%
                                             2.0%
                                             1.5%
                                             1.0%
                                             0.5%
                                             0.0%
                                                                   21

                                                                                                                                    47
                                                    15
                                                         17
                                                              19

                                                                        23
                                                                             25
                                                                                  27
                                                                                       29
                                                                                            31
                                                                                                 33
                                                                                                      35
                                                                                                           37
                                                                                                                39
                                                                                                                     41
                                                                                                                          43
                                                                                                                               45

                                                                                                                                         49
                                                                                                                                              51
                                                                                                                                                   53
                                                                                                                                                        55
                                                                                                                                                             57
                                                                                                                                                                  59
                                                                                                                                                                       61
                                                                                                                                                                            63
                                                                                                                                                                                 65
                                                                                                                                                                                      67
                                                                                                                                                                                           69

                                                                                                           Age (years)

                                                                                                                                                                       Source: Prism Economics

                                                                                                                                         REGIONAL MANUFACTURING PROFILE PEEL-HALTON 5
PEEL-HALTON
The manufacturing workforce in the Peel-Halton Region exhibits a somewhat different picture than other manufacturing
-intensive regions. Manufacturing employment seems to be much older than other regions, especially in the 45-64 age
bracket. About 54% of the labour force is above the age of 45. The 25-44 age bracket in manufacturing is uncharacter-
istically smaller than all other industries and the 15-24 age bracket is not promising, only making up 5% of the manu-
facturing workforce. The below graph exhibits the biggest challenge the manufacturing industry will face during the next
decade: finding the right skilled workers to replace the retiring ones. 5 to 10 percent of these latter are expected to re-
tire during the next decade.
Age distribution of the Peel-Halton Region Labour Force,
Manufacturing and Total (Excluding Manufacturing)
Source: Prism Economics, Statistics Canada, National Household Survey 2011
In addition, Peel-Halton’s manufacturing sector
faces significant competition for workers from
construction and engineering sectors of the local
THE MANUFACTURING LABOUR economy. The recruitment challenges are made
FORCE IN PEEL-HALTON IS OLDER greater by the older age profile of the local manu-
THAN THE OVERALL WORKING AGE facturing workforce, and the difficulty to attract
younger generations to work in manufacturing.
POPULATION. THE INDUSTRY WILL
FACE SIGNIFICANT RECRUITMENT Employers will increasingly need to recruit from
outside the local labour market to meet labour
CHALLENGES AS A LARGE demands. The short term solution to the labour
NUMBER OF WORKERS shortages that will be experienced in certain oc-
RETIRES DURING THE cupations can come from net migration, and
youth training programs.
NEXT DECADE.
6 REGIONAL MANUFACTURING PROFILE PEEL-HALTONPEEL-HALTON
HIGH NET MIGRATION, REASONABLE BIRTH-TO-DEATH RATIO
In Peel-Halton Region, population is in a healthy growth path with the contribution of sustained immigration and a birth
rate of over 1.1% each year. This rate is more than twice the death rate. As a result, the Region is poised to experience
relatively fewer shortages during the next decade.
The following chart illustrates the annual change in the Region’s population. The chart shows the annual number of
births, deaths and the net-migration required (people moving in and out of the Region) to meet population require-
ments.
In 2013, Peel-Halton welcomed 22,060 newborns. This number did not fall below 20,000 since 2006 and it will not do
so during the forecast period. Net births make up 40% of population change, the remaining 60% being attributable to
net migration. Net migration has consistently brought over 20,000 individuals per year into the Region except for 2011.
These two components together will add over 35,000 individuals each year through 2020.
Components of Annual Change in Peel-Halton
Labour Force, 2007-2020
Source: Prism Economics, Strategic Projections Inc.
REGIONAL MANUFACTURING PROFILE PEEL-HALTON 7PEEL-HALTON
COMMUTING WORKFORCE PATTERNS
The Region of Peel is composed of Caledon,
Brampton, and Mississauga municipalities. The re- Commuters are an important factor con-
gion has over 1.3 million residents. Only 30% of the
workforce in the 2 latter municipalities reside in the tributing to the labour force of the region
same region. For Caledon, this ratio is even lower at in addition to migrants and residents.
less than 2%. A high degree of two-way commuting
occurs between Peel and Halton and Peel and To-
ronto. Moreover, residents of Brampton, Mississau-
ga, and Caledon commute within the Peel region and across these municipalities. As a result, the region can be char-
acterized as a commuter hub.
Places of Residence - Peel-Halton Workforce
Source: Prism Economics
NEED TO ATTRACT PEOPLE WITH THE RIGHT SKILLS
Educational attainment in the Region is improving rapidly: individuals with no diploma only make up 6% of the 25-44
age bracket as of 2011. In contrast, bachelor level college education (or above) attainment has reached 38%, a 4 per-
centage point jump from 2006, and it is well above province levels. The increasing number of highly educated individ-
uals in the Region may make it difficult for manufacturing businesses to find the right skilled trade employees, as the
apprenticeship or trades certificate holders are in decline.
Residents are moving away from apprenticeships or trades certificates toward university or college-level diplomas.
These developments indicate a higher youth preference for white collar professions, and less labour supply for trades
during the next decade.
8 REGIONAL MANUFACTURING PROFILE PEEL-HALTONPEEL-HALTON
Peel-Halton, Highest Level of Educational Attainment, 25 to 44 years
Source: Prism Economics, Statistics Canada
GROWING LABOUR FORCE, FALLING UNEMPLOYMENT
The labour force in the Peel-Halton area expanded by 9% between 2009 and 2013 and surpassed the 1 million
mark in 2012. The expansion contributed to an unemployment rate of 7.9% in 2013. This rate has been declining
since the peak rate of 9.7% in 2009, but is still higher than the overall Canadian rate.
Employment in the Peel-Halton area, growing an annual rate of 2.6 percent, has exceeded the growth in the la-
bour force of 2.1 percent over the past three years. The Region is predicted to create over 23,500 jobs on aver-
age per year until 2016 while the labour force will increase by just over 20,000 per year over the same period.
This results in a falling unemployment rate which is expected to be 6.6 percent by 2016 ̶ slightly above the pre-
dicted national average of 6 percent.
Labour Force, Employment and Unemployment Rate (All Industries),
Peel-Halton, 2006-2016
Source: Prism Economics, Strategic Projections Inc.
REGIONAL MANUFACTURING PROFILE PEEL-HALTON 9PEEL-HALTON
MANUFACTURING EMPLOYMENT
In Peel, transportation equipment, food, and fabricated metal manufacturers employed over 34,000 workers, or 41 per-
cent of total manufacturing employment in 2013. Other manufacturing activities in the Region include machinery, chem-
ical, plastic and rubber, printing, and computer products, making up an additional 34 percent. The automotive industry
is a major employer in Peel, Ford and Chrysler Canada employing over 3,800 and 5,000 workers respectively.
The Halton Region employs almost 50% of its manufacturing workforce in three main industries: transportation equip-
ment, machinery, and food products. Other manufacturing activities in the Region include fabricated metal, chemical,
plastic and rubber, and computer and electronic products, comprising over 24% of the regional manufacturing employ-
ment.
Manufacturing Sub-sectors - Percentage of Total Manufacturing Employment
Peel Halton
Source: Prism Economics, Strategic Projections Inc.
Employment levels in the region’s manufacturing industry have been in steady decline over the past decade.
This decline reached a trough around 2011 when the industry started to recover from the recession. However, the
recovery remained inconsequential, with little employment gains in the total manufacturing employment. Forecasts of
manufacturing output for the region project expansion during the next decade, which will translate into a slight increase
in employment in the next few years. The upward trend will stabilize around 2018 and employment will remain flat after
that.
The following graphs illustrate the employment forecast for the top three manufacturing sectors in the region as well as
the total manufacturing industry. Employment is expected to recover modestly during the next 8 years with minor in-
creases in select industries. Total manufacturing employment in the region is expected to stay within the 115,000-
125,000 band by 2023. Food manufacturing and fabricated metal manufacturing will exhibit modest increases in em-
ployment in the medium run and then slightly decline after 2018. Transportation equipment manufacturing employment
will experience a significant increase during the next few years and plateau 2018.
10 REGIONAL MANUFACTURING PROFILE PEEL-HALTONPEEL-HALTON
Total Manufacturing Employment, Peel-Halton, 2006-2023
Source: Prism Economics, Statistics Canada.
Transportation Equipment Manufacturing Employment, Peel-Halton, 2006-2023
Source: Prism Economics, Statistics Canada
Food Manufacturing Employment, Peel-Halton, 2006-2023
Source: Prism Economics, Statistics Canada.
REGIONAL MANUFACTURING PROFILE PEEL-HALTON 11PEEL-HALTON
Fabricated Metal Manufacturing Employment, Peel-Halton, 2006-2023
Source: Prism Economics, Statistics Canada
PROFILE OF MANUFACTURING EMPLOYERS
The Peel-Halton Region is home to the highest number of manufacturing establishments after the Greater Toronto
Area. In 2008, a total of 6,765 manufacturing companies were operating in the Region. By 2013, this number dropped
to 6,149. All establishment size categories except the one with 1 to 4 employees experienced a decline in the number
of businesses during these 5 years. The number of 500+ employee sized businesses dropped from 20 to 15, whereas
the largest drop was experienced in the 10-19 employee category with 117 businesses either downsizing or exiting the
market.
The manufacturing industries with the most number of distinct businesses operating in the Region include fabricated
metal, machinery, printing, furniture, and food establishments. Among these, the first three experienced losses where-
as the last two sectors increased their number of businesses.
Change in Number of Manufacturing Establishments by Employment Size
Manufacturing Establishments
Source: Prism Economics, Statistics Canada Source: Prism Economics, Statistics Canada
12 REGIONAL MANUFACTURING PROFILE PEEL-HALTONPEEL-HALTON
Number of Manufacturing Establishments, by Segment
Source: Prism Economics, Statistics Canada
Largest Manufacturing Employers
Company Employees Industry
Chrysler Canada Inc.-Brampton 5000 Automobile and Light-Duty Motor Vehicle Manufacturing
Ford Motor Company of Canada 3800 Automobile and Light-Duty Motor Vehicle Manufacturing
Magellan Aerospace 3500 Aerospace Product and Parts Manufacturing
Lafarge Canada Inc. 3000 Cement Manufacturing
Suncor Energy 3000 Petroleum Refineries
Maple Lodge Holding Corp 2700 Poultry Processing
Intria Items Inc. 1200 Other Printing
Semiconductor and Other Electronic Component Manufactur-
Evertz Microsystems Ltd. 1200
ing
Source: Prism Economics, Statistics Canada
REGIONAL MANUFACTURING PROFILE PEEL-HALTON 13PEEL-HALTON
MANUFACTURING LABOUR MARKET HIRING REQUIREMENTS
The forecasts presented above are based on the
projected needs of the manufacturing industry in the
DEFINITIONS
region. However, they only calculate the total manufac- Hiring Requirement: The number of workers needed
turing workforce, not the hiring requirement. Workers to fill all the positions necessary for full-capacity
exiting the labour force also need to be taken into production
account in order to estimate the hiring requirements
and the recruitment gap facing the industry. Recruitment Gap: The number of workers needed after
new entrants to the workforce are taken into account
To solve this issue, the labour forecast model devel-
New Entrants: Younger generations entering the labour
oped for this project examines demographics and
force for the first time
estimates the number of workers who will retire or die
over time, hence exiting the labour force and making Replacement Demand: The number of workers needed
up the replacement demand. Hiring requirement is then to replace the retiring and others exiting the workforce
the summation of the replacement demand and the
expansion demand. It is also the summation of the Expansion Demand: The number of workers needed to
new entrants and the recruitment gap. add to the current workforce as the sector grows
The chart below summarizes the results of the labour
forecast model for each of these categories. By 2023, Hiring requirement =
the projected 18.800 individuals who enter the work- New Entrants + Recruitment Gap
force will cover only 48% of the hiring requirements. + Labour Force Change =
Therefore, the manufacturing industry in Peel-Halton
will need to find additional 19.493 workers (recruitment Replacement Demand +
gap) from other industries and other jurisdictions to Expansion Demand
fulfill its labour needs.
Labour Demand and Supply in Manufacturing, Peel-Halton, 2014
40,000
35,000
Recruitment
30,000
Gap
Replacement
25,000
Demand
20,000
15,000
New Entrants
10,000
Expansion
5,000 Demand
-
Source: Prism Economics
14 REGIONAL MANUFACTURING PROFILE PEEL-HALTONPEEL-HALTON
Within the hiring requirement, some occupations are poised to be in more demand than others. These professions
tend to concentrate on skilled trades and technical occupations. As the manufacturing industry is going through a
transformation of technological advancement, the kind of workers it needs in the future is quickly shifting towards
more skilled labour. The next table illustrates some of the occupations that will be most in demand within the next
8 years in Peel-Halton’s manufacturing industry.
Total Hiring
Share of 2014
Occupations Requirement
Employment
2014 - 2023
Motor vehicle assemblers, inspectors and testers 2,735 32%
Manufacturing managers 1,905 39%
Construction millwrights and industrial mechanics 878 39%
Welders and related machine operators 841 36%
Welders and related machine operators 841 36%
Machinists and machining and tooling inspectors 803 33%
Senior managers - construction, transportation, production and utilities 778 43%
Mechanical engineers 613 33%
Process control and machine operators, food, beverage and asso 594 31%
Tool and die makers 576 33%
Industrial electricians 404 42%
Industrial engineering and manufacturing technologists and tec 395 34%
Furniture and fixture assemblers and inspectors 367 37%
Industrial and manufacturing engineers 347 30%
Electrical and electronics engineers 301 33%
Chemical technologists and technicians 264 25%
Electrical and electronics engineering technologists and technicians 256 38%
Transport truck drivers 231 33%
Mechanical engineering technologists and technicians 212 32%
Industrial sewing machine operators 211 47%
Contractors and supervisors, machining, metal forming, shaping and erect-
148 35%
ing trades
Structural metal and platework fabricators and fitters 144 45%
Carpenters 113 48%
Computer network technicians 107 30%
All Occupations in Manufacturing 38,905 34%
REGIONAL MANUFACTURING PROFILE PEEL-HALTON 15PEEL-HALTON
COMPETING DEMAND FROM OTHER INDUSTRIES
In 2014, approximately 14 percent of the local workforce is employed in manufacturing. As employment in other
industries grows, this share is likely to decline. Overtime, competing employment demands from outside the manu-
facturing industry will make the attraction and retention of certain key trades and occupations increasingly more
difficult for local manufacturers. The degree of difficulty will vary across occupational groups.
Distribution of Employment by Occupational Category across Industries, 2014
Source: Prism Economics, Statistics Canada
The above chart illustrates the competition from con-
struction, professional services, and other industries Some industries in the region are better
in hiring certain occupations that could present hiring positioned than manufacturing to recruit
challenges for manufacturing. These include:
the workers they need due to their project-
Sheet metal workers
ed faster growth and higher wages (e.g.,
Industrial sewing machine operators
Welders and related machine operators
mining, utilities). Competing demand for
Construction millwrights and industrial me-
same occupations will be one of the major
chanics complications that manufacturing hiring
managers will face during the next decade.
16 REGIONAL MANUFACTURING PROFILE PEEL-HALTONPEEL-HALTON
The manufacturing industry in the Peel-Halton Region may find itself at a disadvantage in hiring these workers com-
pared to the utilities and professional services sectors because these are both projected to grow faster than manufac-
turing and may be paying higher wages to attract skilled workers. A quick look at wage differentials across industries in
Ontario suggests that utilities and mining tend to pay higher wages than other industries, and therefore can exacerbate
manufacturing companies’ recruitment challenges.
Wage Differentials across Industries, Ontario, 2007-2013
Source: Prism Economics, Statistics Canada
REGIONAL MANUFACTURING PROFILE PEEL-HALTON 17PEEL-HALTON
MANUFACTURING LABOUR MARKET SHORTAGE RANKINGS
BY OCCUPATION
The supply and demand labour market forecast model developed for this project generated forecasts for 45
manufacturing-related occupations. These forecasts estimate the labour demand for each occupation in the
Peel-Halton Region for the 2014-2023 period. On the supply side, labour force exits (i.e. deaths and retirements)
and new entrants (i.e. younger generations entering the labour force) were taken into account to create labour mar-
ket shortage rankings for select occupations. The following legend describes the meaning of the ranks ranging be-
tween 1 and 5.
a) Technical and Technologist Occupations and Managers Rankings
Several technical and technologist occupations are projected to pose significant and chronic recruitment
challenges during the next few years. These include occupations such as manufacturing managers, electrical and
electronics engineers, and non-destructive testers and inspection technicians. Other professions such as mechani-
cal engineers will also remain difficult to fill partly due to the lack of a wide talent pool in the region.
These occupational categories will be harder to fill than others for the manufacturing industry due to competition
from other industries, demographic challenges, and a limited labour supply. Human resources managers may need
to widen their search beyond the region to find the skills they need during the next few years. The following chart
ranks technical and technologist occupations and managerial positions in terms of their recruitment challenges
through the forecast period.
18 REGIONAL MANUFACTURING PROFILE PEEL-HALTONPEEL-HALTON
Technical and Managerial Occupational Rankings, Peel-Halton, 2014-2023
Occupations 2012 2013 2014 2015 2016 2017 2018 2019 2020 2021 2022 2023
0911 Manufacturing managers 4 2 3 4 4 4 4 3 3 3 3 3
1521 Shippers and receivers 3 2 3 3 3 4 4 3 3 3 3 3
2132 Mechanical engineers 4 2 3 4 4 4 4 3 4 3 3 4
2133 Electrical and electronics engineers 4 1 3 4 4 3 3 3 3 3 3 3
2141 Industrial and manufacturing engineers 4 2 3 3 3 3 3 3 2 3 3 3
2211 Chemical technologists and technicians 2 4 4 3 3 3 3 3 3 2 2 3
2232 Mechanical engineering technologists and technicians 4 2 3 3 4 3 3 3 3 3 3 3
2233 Industrial engineering and manufacturing technologists and technicians 3 2 3 4 3 4 4 3 3 3 3 3
2241 Electrical and electronics engineering technologists and technicians 2 2 3 3 3 4 4 3 3 3 3 3
2243 Industrial instrument technicians and mechanics 3 2 3 4 4 3 2 2 2 2 2 2
2253 Drafting technologists and technicians 3 2 4 4 4 3 3 3 3 3 3 3
2261 Non-destructive testers and inspection technicians 4 2 4 4 4 4 4 4 4 4 4 4
2281 Computer network technicians 4 1 3 4 4 3 3 3 3 3 3 3
2282 User support technicians 3 2 4 3 3 3 3 3 3 3 3 3
2283 Information systems testing technicians 3 2 4 4 4 3 2 2 2 3 3 3
Source: Prism Economics
b) Skilled Trades Occupations Rankings
Several skilled trades occupations are projected to pose chronic recruitment challenges during the next few years. Profes-
sions such as tool and die makers, industrial electricians, transport truck drivers, construction millwrights, and motor vehi-
cle assemblers will remain difficult to fill partly due to the lack of interest in skilled trades training in the region. These oc-
cupational categories will be harder to fill than others in the manufacturing industry due to competition from other indus-
tries, demographic challenges, and a limited labour supply.
Human resources managers may need to widen their search beyond the region to find machinists, welders, and carpen-
ters during the next few years.
REGIONAL MANUFACTURING PROFILE PEEL-HALTON 19PEEL-HALTON
Skilled Trades Occupational Rankings, Peel-Halton, 2014-2023
Occupations 2012 2013 2014 2015 2016 2017 2018 2019 2020 2021 2022 2023
7231 Machinists and machining and tooling inspectors 3 2 3 4 4 4 3 3 3 3 3 3
7232 Tool and die makers 4 2 3 4 4 3 4 3 3 3 4 4
7233 Sheet metal workers 2 2 3 4 4 3 3 3 3 3 3 3
7235 Structural metal and platework fabricators and fitters 3 3 3 4 4 4 4 3 4 4 3 4
7237 Welders and related machine operators 3 2 3 3 4 4 4 3 3 3 3 3
7241 Electricians (except industrial and power system) 5 3 3 4 4 3 4 3 3 3 3 4
7242 Industrial electricians 4 2 3 4 4 4 4 3 3 4 4 4
7251 Plumbers 4 3 4 4 4 4 3 3 3 3 3 3
7252 Steamfitters, pipefitters and sprinkler system installers 4 2 4 4 4 4 4 4 4 4 4 4
7271 Carpenters 4 2 4 4 4 4 4 3 3 4 4 4
7301 Contractors and supervisors, mechanic trades 4 3 4 4 4 4 4 3 4 4 4 4
7311 Construction millwrights and industrial mechanics 3 3 3 4 4 4 4 3 3 3 3 4
7452 Material handlers 3 3 3 4 3 3 4 3 4 4 4 4
7511 Transport truck drivers 3 2 3 4 4 4 3 3 3 3 3 3
9422 Plastics processing machine operators 2 3 3 4 3 3 3 3 3 3 4 4
9446 Industrial sewing machine operators 3 2 3 4 4 4 4 3 3 4 4 4
9461 Process control and machine operators, food, beverage 3 1 3 3 3 3 4 3 3 3 3 4
9522 Motor vehicle assemblers, inspectors and testers 4 3 3 3 4 3 4 3 3 4 4 4
9532 Furniture and fixture assemblers and inspectors 2 2 3 3 3 3 3 3 3 3 3 3
9614 Labourers in wood, pulp and paper processing 3 2 3 4 4 4 3 3 3 3 3 3
9617 Labourers in food, beverage and associated products processing 3 2 3 3 3 3 3 3 3 3 3 4
9619 Other labourers in processing, manufacturing and utilities 2 2 4 4 3 3 4 3 3 3 4 4
All Occupations in Manufacturing 3 2 4 4 4 3 4 3 3 3 4 4
Source: Prism Economics
20 REGIONAL MANUFACTURING PROFILE PEEL-HALTONPEEL-HALTON
SURVEY RESULTS
As part of the Peel-Halton Region labour market forecast project, a survey among employers based in the region
was conducted to assess their labour needs and perceived challenges. The survey results are not statistically signif-
icant due to small sample size. Nonetheless, they are informative and confirm the findings of the model described
above.
The occupations that survey respondents identified as posing significant recruitment challenges are similar to the
occupations identified by the labour demand forecast model. Survey respondents are facing recruitment challenges
in hiring predominantly skilled trades and technical occupations. The occupations cited by respondents are:
Machinists and machining and tooling inspectors
Industrial electricians
Construction millwrights and industrial mechanics
Heavy-duty equipment mechanics
Tool and die makers
Chemical technologists and technicians
Industrial engineering and manufacturing technologists and technicians
Mechanical engineering technologists and technicians
Welders and related machine operators
Structural metal and platework fabricators and fitters
Electrical and electronics engineering technologists and technicians
Survey respondents also provided information on wages for specific occupations:
Wages across Canada, Survey Results, 2014
Source: Prism Economics, CME Survey
REGIONAL MANUFACTURING PROFILE PEEL-HALTON 21PEEL-HALTON PEEL-HALTON
Compensation is an important factor in recruitment. The chart below reports additional wage data by region. This
data was provided by Wanted Analytics which maintains a large database of online job postings across Canada,
allowing users to compare information by region, industry, and occupation. The first column reports the CME sur-
vey data whereas the remaining columns report Wanted Analytics wage data by region. Overall, survey respond-
ents seem to report higher wages than Wanted Analytics online job postings database.
The difference between the survey results and Wanted Analytics wage data stems from several factors:
1. Survey respondents were asked to report the wage they were paying their existing workers in these occupa-
tions while Wanted Analytics reports wage data from online job advertisements for new recruits. The differential
may be a function of the experience level required in new recruits vs. the experience level of survey respond-
ents’ employees.
2. Wanted Analytics data is generated using an algorithm that combines wage data from online job advertise-
ments of the last 3 years and some other factors affecting wages. Online job advertisements include a range
of positions from apprentices to Red Seal Certificate owners and with titles ranging from “industrial mechanic
millwright” to “field service technician”. Survey respondents only report the wage they pay to their “millwright”.
3. The Wanted Analytics database includes over 150.000 wage samples. Although this number is significantly
reduced after selecting for region, job title, and industry, it is still much higher than the wage data reported by
each survey respondent.
Wages for Select Occupations across Regions, 2014
Source: CME Survey, Prism Economics, Wanted Analytics
22 REGIONAL MANUFACTURING PROFILE PEEL-HALTONPEEL-HALTON
Finally, the Peel-Halton Region can be compared to other manufacturing hubs across the country in terms of re-
cruitment challenges reported by employers in the survey. 49% of the survey respondents in the Peel-Halton Re-
gion report experiencing immediate or chronic recruitment challenges. An additional 32% of respondents reported
occasional recruitment challenges. Only 19% of the respondents said they are experiencing no recruitment chal-
lenges in the region.
Survey results suggest that the Peel-Halton Region’s recruitment challenges are less pronounced than most other
manufacturing regions in Ontario. Recruitment challenges are more severe in some other Ontario regions such as
Sudbury, where 72% of respondents report immediate or chronic challenges, and London where 54% do. Outside
of Ontario, survey respondents from Greater Halifax report minor or no recruitment challenges. Calgary and Ed-
monton also face some recruitment challenges but not as much as Ontario regions.
Recruitment Challenges across Manufacturing Regions, 2014
Source: CME Survey, Prism Economics
REGIONAL MANUFACTURING PROFILE PEEL-HALTON 23PEEL-HALTON PEEL-HALTON
CONCLUDING REMARKS AND RECOMMENDATIONS
The manufacturing industry in the Peel-Halton Region is positioned for modest growth during the next decade. Out-
put growth will not translate into large gains in employment due to increasing investment levels and rapidly improv-
ing productivity of the manufacturing labour force. As a result, the industry will not face severe recruitment challeng-
es to fill new positions added to the manufacturing workforce.
Instead, significant recruitment challenges will present themselves as a result of the retiring workforce. The
manufacturing industry’s demographics demonstrate a larger segment over the age of 55 than the overall working
population. This will result in high replacement demand during the next few years and even in the longer run.
Recruitment challenges will not be ubiquitous across all occupations. As the manufacturing industry becomes more
technologically advanced, the kinds of jobs needed to maintain full capacity output are shifting towards more skilled
trades and technical occupations. Both model and survey results confirm this point, identifying these occupations as
the main culprits of recruitment challenges now and in the projected future.
Moreover, these recruitment challenges will be exacerbated by competition from other industries poised to grow
faster. These industries include professional services, construction, and information and culture. Occupations need-
ed by other industries which tend to pay higher wages (i.e. utilities, mining and oil extraction…) are especially prone
to generating recruitment challenges for the manufacturing sector.
Based on this state of the manufacturing labour force, the industry needs to respond as a whole before the
recruitment challenges become unmanageable. Some potential solutions to the problem include:
Increasing training and apprenticeship in your workplace
Collaborating with other regional employers and stakeholders
Advocating for increases in government support for training
Working with educational institutions to ensure programs meet industry needs
Promoting manufacturing as a career option
Establishing training consortia
24 EGIONAL MANUFACTURING PROFILE PEEL-HALTONPEEL-HALTON
This Regional Manufacturing Profile was prepared for the project “Regional Labour Market Information to Address Skills and
Human Resources Issues in the Manufacturing Sector”. This project is sponsored by the Canadian Manufacturers & Exporters
and the Canadian Skills Training and Employment Coalition.
This project is funded by the Government of Canada’s Sector Initiatives Program. The opinions and interpretations in this
publication are those of the author and do not necessarily reflect those of the Government of Canada.
REGIONAL MANUFACTURING PROFILE
Peel-Halton
Prepared by Prism Economics & Analysis for:
Canadian Manufacturers & Exporters &
the Canadian Skills Training & Employment CoalitionYou can also read