Understanding Effects of the Algorithm Visualized with AR Techniques
←
→
Page content transcription
If your browser does not render page correctly, please read the page content below
Understanding Effects of the Algorithm Visualized
with AR Techniques
Lázaro V. O. Lima         #
Centro ALGORITMI, Departamento de Informática,
University of Minho, Campus Gualtar, Braga, Portugal

Manuel Sousa         #
University of Minho, Braga, Portugal

Luis Gonzaga Magalhães          #
Centro ALGORITMI, University of Minho, Braga, Portugal

Pedro Rangel Henriques            #Ñ
Centro ALGORITMI, Departamento de Informática,
University of Minho, Campus Gualtar, Braga, Portugal

      Abstract
We create analogies to understand and visualize complex concepts. Such approach, based on
analogies are presentation of software, is also effective when it concerns software comprehension.
Many visualization techniques for data structures have been developed in 2D and 3D to improve
the visual representation of large structures. A common challenge faced by developers that want to
implement these techniques is to increase the amount of information to be displayed in each node
seeking a balance between quantity and visibility. To overcome these challenges, this article presents
a visualization technique using Augmented Reality to display hierarchical structures and understand
the effects of the algorithm in data structures. The visualization system based on AR, proposed and
discussed along the paper, allows the user to interact and navigate through the structure, enabling
him to explore information in depth.

2012 ACM Subject Classification Computing methodologies → Mixed / augmented reality

Keywords and phrases Augmented Reality, Learning Resource, Data Visualization, Syntax Tree
Visualization

Digital Object Identifier 10.4230/OASIcs.ICPEC.2021.15

Category Short Paper

Funding This work has been supported by FCT – Fundação para a Ciência e Tecnologia within the
R&D Units Project Scope: UIDB/00319/2020.

 1      Introduction

To start, we quote the authors [5] who say “The use of computer-supported, interactive,
visual representations of abstract data to simplify cognition” – in other words, we create
analogies to understand complex concepts and this relationship is a cognitive process of
information transfer.
    For this, another author [4] says: “Visualization holds great promise for computational
science and engineering, provided we can meet the immediate and long-term needs of both
toolmaker and tool users.” According to [7], our cognitive system takes about 15 to 20
different psychological stimuli into account to perceive the spatial relationships between
3D objects. These so-called depth tips can be divided into monocular (use of one eye)
and binocular (use of both eyes). This information is usually classified into 3 categories:
one-dimensional, two-dimensional and three-dimensional [6].
             © Lázaro V. O. Lima, Manuel Sousa, Luis Gonzaga Magalhães, and Pedro Rangel Henriques;
             licensed under Creative Commons License CC-BY 4.0
Second International Computer Programming Education Conference (ICPEC 2021).
Editors: Pedro Rangel Henriques, Filipe Portela, Ricardo Queirós, and Alberto Simões; Article No. 15;
pp. 15:1–15:10
                     OpenAccess Series in Informatics
                     Schloss Dagstuhl – Leibniz-Zentrum für Informatik, Dagstuhl Publishing, Germany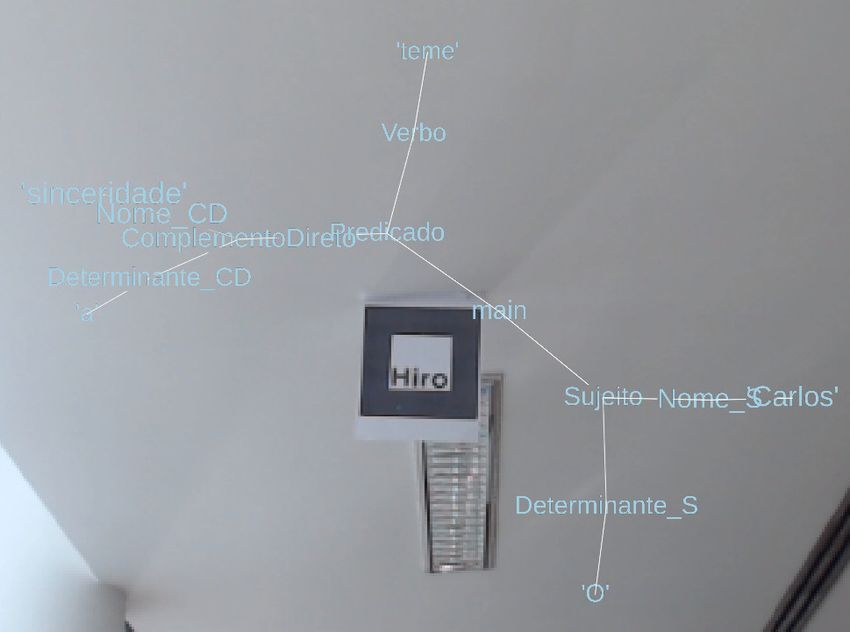
15:2   LR with AR

           The form of representation of certain information must be carefully chosen since mis-
       representations can cause errors of interpretation [14]. Based on these categories, several
       metaphors were created, such as bar graphs, hierarchical structures (Information Cube [11],
       indented lists [13], hierarchical graphs [3], TreeMaps [8], ConeTree [1]) and maps to represent
       the different categories of information.
           Indented lists, the items (nodes) belonging to the hierarchy are organized one below
       the other, linearly, with the indentation corresponding to the level occupied by the element
       in the hierarchy [13]. A hierarchical graph can be defined as a graph where each node is
       composed by a simple element or, in turn, a new hierarchical graph [10]. When a graph
       has the purpose of visualizing hierarchical data, it is called a hierarchical graph, and can be
       presented in different ways (horizontal and radial). The horizontal hierarchical graph, as
       shown in Figure 1, has the level lines drawn horizontally, parallel to each other.

          Figure 1 Horizontal hierarchical graph [3].

           To solve this problem, the radial hierarchical graph presented in Figure 2 was proposed
       and created by Bachmaier [3], having the level lines represented by concentric circles. One
       disadvantage of radial hierarchical graphs is that for large volumes of nodes, clarity in the
       visualization of the information presented is lost.

          Figure 2 Radial hierarchical graph [3].

           The TreeMaps presented by Figures 3 and 4, constitute a structured information visual-
       ization technique, which maps a given hierarchy in a rectangular area, using 100% of the
       available space for the presentation of data [8]. With the efficient use of available space, it
       becomes possible to view large hierarchies, facilitating the presentation of the information in
       question.
           Even though this technique is a good option for viewing large hierarchies, it becomes
       limited when displaying a single type of information throughout the structure (viewing in
       two dimensions limits the ability to present complementary information).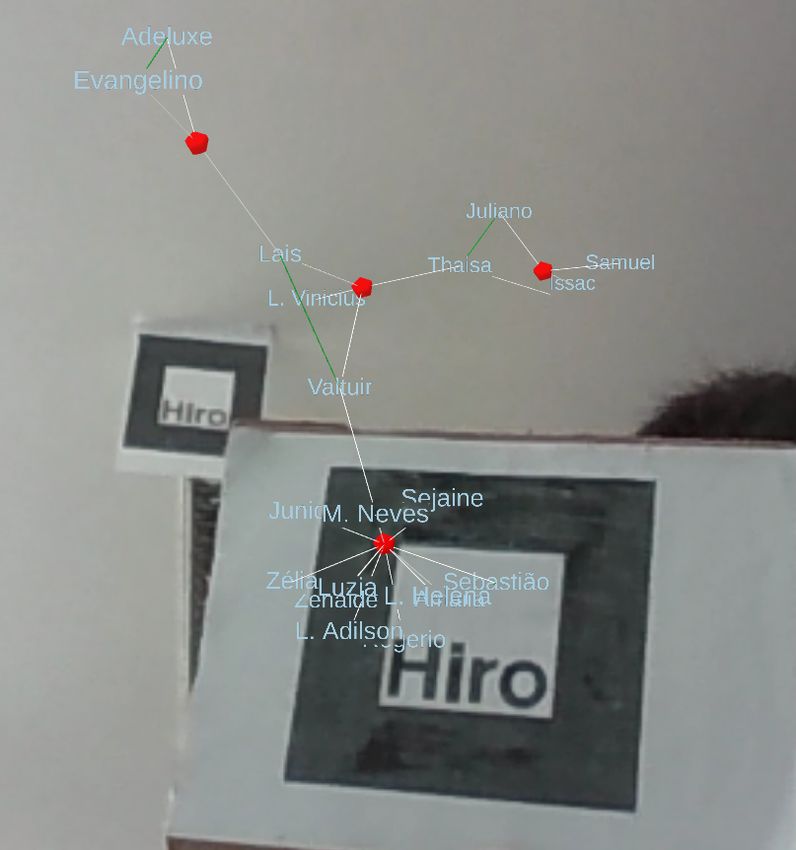
L. V. O. Lima, M. Sousa, L. G. Magalhães, and P. R. Henriques                                     15:3

   Figure 3 TreeMap equivalent to the structure of Figure 4 [8].

   Figure 4 Example of TreeMap [8].

    ConeTrees are a technique for visualizing hierarchical structures, through the connection
of sub-trees, in the form of 3D cones, as shown in Figure 5. The main disadvantage of
ConeTrees is the occlusion of some nodes, which increases significantly as larger hierarchies
are viewed. To work around this problem, ConeTrees are designed to be interactive, allowing
the user to navigate through the presented structure and, consequently, the visualization of
occluded nodes [1].

   Figure 5 Example of ConeTree [1].

   The techniques described above have some limitations, such as:
   Presentation of a single type of information throughout the structure;
   High degree of disorder in the presentation of different types of information;
   Does not allow interaction with the hierarchical structure presented.

                                                                                                ICPEC 2021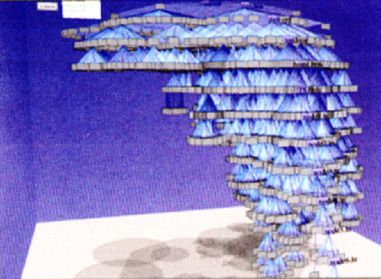
15:4   LR with AR

           Therefore, we need to present new techniques for visualizing information with Augmented
       Reality. We understand that the AR allows the observation of a data structure in three
       dimensions, in addition to allowing the observation of changes that occur in the data structure
       knowing that the AR inserts increased information in real time. Augmented Reality is defined
       by Azuma [2] as the overlapping of virtual information in the real world through technology.
       This information can be simple textual images or 3D objects. AR increases information in the
       real world, the user maintains a sense of presence in the real world and requires mechanisms
       to combine the real world with the virtual one.
           The prototype proposed in this article addresses a different use of the visualization
       technique of data structures, in which the user interacts with the information presented at
       different levels of depth through a Virtual Environment. The goal is to allow the representation
       of arbitrary information and data.
           Taking advantage of the best practices of Augmented Reality, one can align the objectives
       of teaching Algorithms and their different data structures with 3D visualization in which the
       teacher can perform an operation and instantly visualize the structure in Augmented Reality.
       Besides this introduction, this paper is divided into five sections: the section 1 covering the
       importance of using technologies that impact students’ motivation to understand complex
       concepts and thereby make the abstract better; another one documenting the construction
       and presentation of tree information; a third one presenting the application of the prototype
       built with a case study and a last one to show some concept prototypes, conclusions and
       work in progress.

        2     Understanding Software with Visualization of Effects in AR
       There is a lot of research underway on 3D data visualization in AR, especially in the field of
       Immersive Analysis and analysis of medical volume, such as Sielhorst [12]. Luboschik [9]
       claims that among the fundamental aspects to be considered in Augmented Reality are linear
       perspective, relative sizes, parallax of movement, binocular disparity. It is also important
       to show here that AR allows us to understand how a program works, that is, the effect of
       an algorithm on a data structure. To illustrate the visualization technique presented in
       this work, the visualization of family trees in 3D was chosen as a case study. In times of
       pandemic, a tool that shows medical information can prove to be useful for relating, for
       example, hereditary and relational diseases.
           The purpose of the proposed visualization technique is to allow the user to understand
       the effects of an algorithm on a visualization structure and / or database, reducing the degree
       of visual disturbance. Unlike a two-dimensional presentation, in which a greater amount of
       information, colors and shapes tend to negatively influence the abstraction of information by
       the user, the three-dimensional system allow a amount of data, colors and shapes, without
       leaving the environment overloaded with secondary information.
           Once the developed prototype is executed from the browser, it is possible to add external
       content to the hierarchy, presented as web links, images, complementary texts, among others.
       We will present in the next topics the tools used to validate the prototype proposed here.

        3     Construction and presentation of the tree
       With the prototype, the user can build a tree containing different types of information. The
       library AR.js is a lightweight open-source library for Augmented Reality on the Web, which
       supports features such as Image Tracking. It is essentially a JavaScript framework acting
       as a port of ARToolkit. Their goal is to be able to use AR on web browsers without losing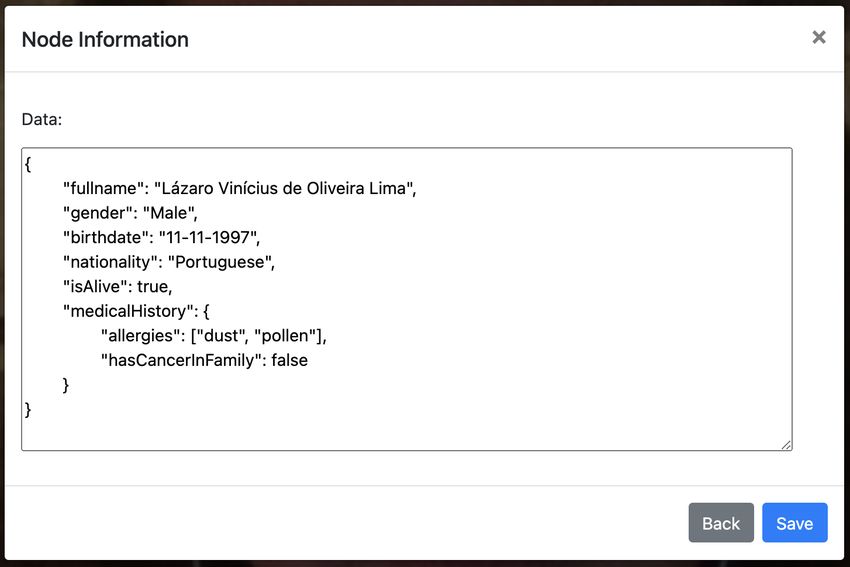
L. V. O. Lima, M. Sousa, L. G. Magalhães, and P. R. Henriques 15:5
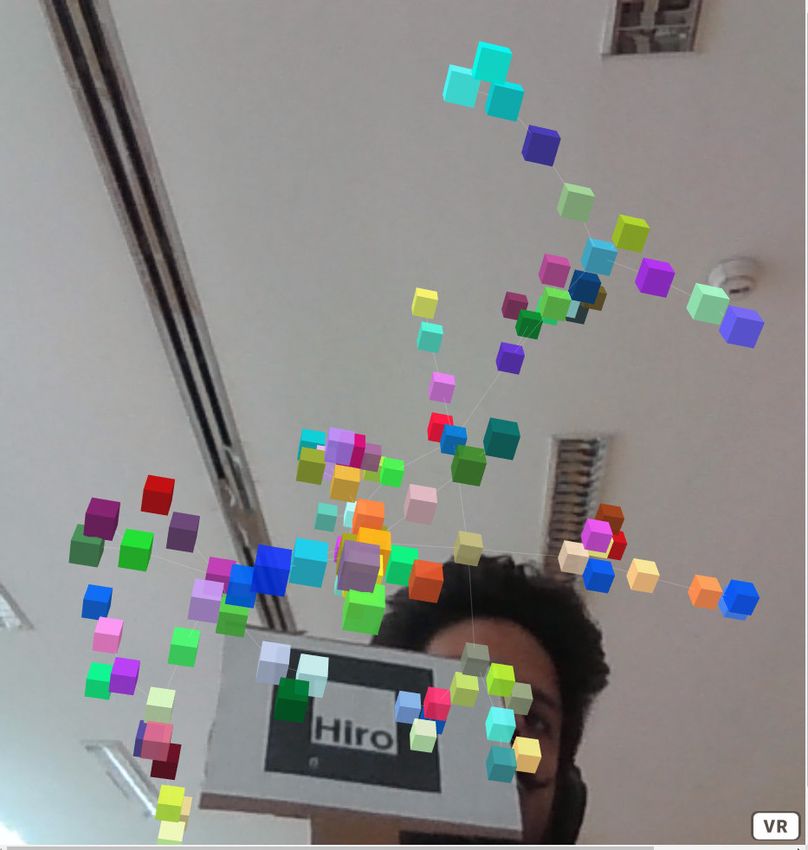
Figure 6 Example of Graph with links in Augmented Reality.
performance. One of the advantages of using this type of technology is that it can run on old
hardware, such as old smartphones, enhancing user accessibility. The library is web-based,
using components such as Three.js + A-Frame + jsartoolkit5.
The prototype is using 3D Force-Directed Graph in AR, which is a web component
to represent a graph data structure in Augmented Reality using a force-directed iterative
layout. This makes use of AR.js with A-Frame for rendering and d3-force-3d for the layout
physics engine.
Each node in the hierarchy can represent any type of data. This information is distributed
in volumes. Moreover, in the case of two nodes being more closely connected, we created
a type of relation named “marriage”, which also has the literal meaning in a use case of a
family tree. This relation is represented by a node with a color red as seen in Figure 7.
Figure 7 Example of Family tree in Virtual Reality.
ICPEC 2021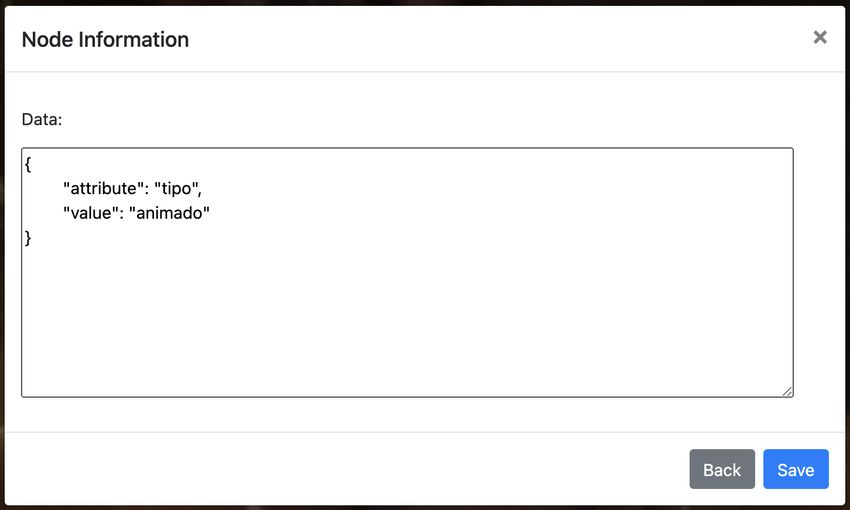
15:6   LR with AR

           After the tree is generated, the user can interact with the nodes and said information by
       accessing different context menus. Within these menus, it is possible to search the information
       of each node as well as insert a new node. The system is also capable of saving or loading a
       tree in a specific JSON format see in Figure 8.

          Figure 8 Example of Family tree with Augmented Reality.

            It is important to emphasize that the prototype allows the addition of a new element, the
       visualization of the addition of that element is animated and happens in real time. Taking
       advantage of the best practices of AR, it turns out that the effects can be used to teach
       structures such as Lists, Stacks and Queues. This concepts are better understood by students
       if we use appropriate analogies created by AR.
            An important attribute of virtual systems is their navigation and interaction with the
       user. Once the family tree is built, the user can access, within each node, the complementary
       information, for example, personal data, professional data, or medical data. Each node has
       a JSON object representing the information that it contains. To view and edit the node
       information, a text area is available for the user, as seen in Figure 9. After saving new data,
       it is verified if the input of the user has a correct JSON format.
            Using the tool, detach the nuances of using Augmented Reality to the usual one used to
       increase and decrease the scale of the graph. Navigation allows the user to identify connection
       points, thus locating family members. The Figure 9 presents one of the chosen family nodes
       and the personal data area. When the hierarchical structure has a large number of nodes,
       and even with the existing interaction resources inherited from the applied AR techniques,
       it was created an easy and understandable way for the user to visualize a specific node – a
       filter (Figure 10) using a search term and evaluating said term with a value.
            Using a search term that corresponds to a key in the information object, an expression
       that can evaluate the filter as “Equals”, “Not Equals”, “Greater than” and “Less than”, and
       finally a search value, the user can search for specific nodes that match the previous created
       filter.
            After presenting the example described for the construction of the visualization of
       connected structures and with the possibility of adding information on each element, in the
       next session, we will present the representation of a tree of visual syntax analysis in AR.
L. V. O. Lima, M. Sousa, L. G. Magalhães, and P. R. Henriques 15:7
Figure 9 Visualization of one of the nodes in the tree and personal data form.
Figure 10 Nodes information of Nodes and Filter Information Panel.
4 Lyntax – Use Case
In order to show the representation of information in depth, one of the use cases of the idea
presented in this paper is a tool named Lyntax. Lyntax is a compiler for a domain specific
language which intends to enable the teacher to specify different kinds of sentence structures,
and then, ask the student to test his own sentences against those structures. It generates
ANTLR instructions that correspond to a specific natural language sentence based on a
previously created specification. When processed, an ANTLR file is generated, which is then
processed in order to create a visual syntax parse tree of the input (in 2D), allowing for a
better understanding of the sentence. The syntax tree generated can then be post-processed
and used to create an AR graph, allowing a even more visual and interactive way of envision
the syntax tree.
With Lyntax it was possible to verify the application of the ideas presented in which they
are successful in explaining the effect of an algorithm on the visualized structure. The results
of the tree generated by the Lyntax tool using Augmented Reality can be seen in the figure 11
For more information, the tool can be access at https://lyntax.epl.di.uminho.pt.
ICPEC 202115:8 LR with AR
Figure 11 Example of Lyntax in AR.
Each component of the sentence can have different types of attributes in order to have
a more enhanced analysis. For example, Figure 12 has a sentence written in Portuguese,
in which two of the components (sujeito – subject and verbo – verbo) have a common
attribute, tipo (type). This type can be both “animated” or “inanimated”. All of the different
information that guides each node within Lyntax is also ported for the AR graph.
Figure 12 Example of Lyntax component attribute.L. V. O. Lima, M. Sousa, L. G. Magalhães, and P. R. Henriques 15:9
The prototype enhances Lyntax’s syntax tree, as it allows the user to view each component
attributes in real-time. The user is able to analyze the sentence while visualizing the attributes
that flow within the syntax tree. This takes advantage of the best practices of Augmented
Reality and explores the depth of information in the tree.
5 Conclusions
The prototypes developed in the context of the project here reported, for building trees of
words in Augmented Reality, made it possible to apply and evaluate the proposed visualization
technique. It should be emphasized the importance of a valid strategy to show a solution to a
problem in 3D. The information is presented to users in a simple and objective way, to favor
the abstraction of relevant information. For many years we have demanded for appropriate
educational tools and now we have the possibility of select and use visualization/animation
tools that use 3D and AR to understand complex concepts.
With the referred prototypes, it was possible to corroborate the improvements resulting
from the use of the third dimension (depth) to visualize hierarchical structures. Besides, the
use of hyper-textual interfaces contributes significantly to the reduction of visual disorder
with a large volume of information to be presented. Thus, the proposed AR system allows
the user to navigate, interact and search for information within the structure, is an important
alternative to traditional methods providing an effective way ti comprehend the effect of the
algorithms on a data structure. As suggestions for future work, we intend to discuss the
adaptation of the proposed technique to the visualization of different kinds of structures,
such as ConeTree, computer networks or networking systems, complex chemical molecules,
or other type of hierarchical structure. Another idea for future work is the integration of this
tool with systems that manipulate knowledge bases. With AR it is possible to create better
analogies in order to visualize complex hierarchical structures, such as a list of geographic and
temporal information. In addition, the efficiency of visualization of the proposed technique
will be investigated,as well as the scalability of the approach. At last, it is intended to explore
the Learning Resource in an educational environment to verify its impact when compared to
traditional methods.
References
1 M.O. Almeida. Uma ferramenta para mineração visual de dados usando mapas em árvore e
suas aplicações. Salvador: Universidade Salvador, 2003.
2 Ronald T Azuma. A survey of augmented reality. Presence: Teleoperators & Virtual Environ-
ments, 6(4):355–385, 1997.
3 C. Bachmaier. A radial adaptation of the sugiyama framework for visualizing hierarchical
information. IEEE transactions on visualization and computer graphics, 13(3):583–594, 2007.
4 Mackinlay Card. Readings in information visualization: using vision to think. Morgan
Kaufmann, 1999.
5 Stuart K Card, Jock D Mackinlay, and Ben Shneiderman. Using vision to think. Readings in
information visualization: using vision to think, pages 579–581, 1999.
6 C. M. D. S. Freitas and al. et. Introdução à Visualização de Informação. Revista de Informática
Teórica e Aplicada, 2:143–158, 2001.
7 E Bruce Goldstein and James Brockmole. Sensation and perception. Cengage Learning, 2016.
8 B. Johnson and B. Shneiderman. Tree-maps: A space-filling approach to the visualization of
hierarchical information structures. In Proceedings of the 2nd conference on Visualization’91,
pages 284–291. IEEE Computer Society Press Los Alamitos, CA, USA, 1991.
ICPEC 202115:10 LR with AR
9 Martin Luboschik, Philip Berger, and Oliver Staadt. On spatial perception issues in augmented
reality based immersive analytics. In Proceedings of the 2016 ACM Companion on Interactive
Surfaces and Spaces, ISS ’16 Companion, page 47–53. Association for Computing Machinery,
New York, NY, USA, 2016. doi:10.1145/3009939.3009947.
10 T.W. Pratt. A hierarchical graph model of the semantics of programs. In Proceedings of the
May 14-16, 1969, spring joint computer conference, pages 813–825. ACM, 1969.
11 J. Rekimoto and M. Green. The information cube: Using transparency in 3d information
visualization. In Proceedings of the Third Annual Workshop on Information Technologies &
Systems (WITS’93), pages 125–132. Citeseer, 1993.
12 Tobias Sielhorst, Christoph Bichlmeier, Sandro Michael Heining, and Nassir Navab. Depth
perception–a major issue in medical ar: evaluation study by twenty surgeons. In International
Conference on Medical Image Computing and Computer-Assisted Intervention, pages 364–372.
Springer, 2006.
13 H. Song, Y. Qi, L. Xiao, T. Zhu, and E.P. Curran. LensTree: Browsing and Navigating Large
Hierarchical Information Structures. In Artificial Reality and Telexistence–Workshops, 2006.
ICAT’06. 16th International Conference on, pages 682–687, 2006.
14 Edward R. Tufte. Theory of Data Graphics. In The Visual Display of Quantitative Information,
volume 2, pages 91–191, 2007.You can also read