Reply to Comment on 'On the relationship between Atlantic meridional overturning circulation slowdown and global surface warming'
←
→
Page content transcription
If your browser does not render page correctly, please read the page content below
REPLY • OPEN ACCESS

Reply to Comment on ‘On the relationship between Atlantic meridional
overturning circulation slowdown and global surface warming’
To cite this article: L Caesar et al 2021 Environ. Res. Lett. 16 038002

View the article online for updates and enhancements.

                               This content was downloaded from IP address 193.174.19.69 on 25/03/2021 at 11:03
Environ. Res. Lett. 16 (2021) 038002 https://doi.org/10.1088/1748-9326/abc776
REPLY
Reply to Comment on ‘On the relationship between Atlantic
OPEN ACCESS
meridional overturning circulation slowdown and global
RECEIVED
6 March 2020 surface warming’
REVISED
14 August 2020 L Caesar1,2,∗, S Rahmstorf1,3 and G Feulner1
ACCEPTED FOR PUBLICATION 1
4 November 2020
Potsdam Institute for Climate Impact Research (PIK), Member of the Leibniz Association, PO Box 60 12 03, D-14412 Potsdam, Germany
2
Irish Climate Analysis and Research UnitS (ICARUS), Department of Geography, Maynooth University, Maynooth, Ireland
PUBLISHED 3
Institute of Physics and Astronomy, University of Potsdam, Potsdam, Germany
26 February 2021 ∗
Author to whom any correspondence should be addressed.
Original content from
E-mail: caesar@pik-potsdam.de
this work may be used
under the terms of the Keywords: Atlantic meridional overturning circulation, global surface warming, ocean heat uptake
Creative Commons
Attribution 4.0 licence.
Any further distribution
of this work must Abstract
maintain attribution to In their comment on our paper (Caesar et al 2020 Environ. Res. Lett. 15 024003), Chen and Tung
the author(s) and the title
of the work, journal (hereafter C&T) argue that our analysis, showing that over the last decades Atlantic meridional
citation and DOI.
overturning circulation (AMOC) strength and global mean surface temperature (GMST) were
positively correlated, is incorrect. Their claim is mainly based on two arguments, neither of which
is justified: first, C&T claim that our analysis is based on ‘established evidence’ that was only true
for preindustrial conditions—this is not the case. Using data from the modern period
(1947–2012), we show that the established understanding (i.e. deep-water formation in the North
Atlantic cools the deep ocean and warms the surface) is correct, but our analysis is not based on
this fact. Secondly, C&T claim that our results are based on a statistical analysis of only one cycle of
data which was furthermore incorrectly detrended. This, too, is not true. Our conclusion that a
weaker AMOC delays the current surface warming rather than enhances it, is based on several
independent lines of evidence. The data we show to support this covers more than one cycle and
the detrending (which was performed to avoid spurious correlations due to a common trend) does
not affect our conclusion: the correlation between AMOC strength and GMST is positive. We do
not claim that this is strong evidence that the two time series are in phase, but rather that this
means that the two time series are not anti-correlated.
In July 2018 Chen and Tung (C&T) published a letter In Caesar et al (2020) we show that the observed
in Nature claiming that ‘Global surface warming (is) changes in AMOC strength, global mean surface tem-
enhanced by (a) weak Atlantic overturning circula- perature (GMST) and ocean heat content in Atlantic
tion’ (Chen and Tung 2018). As we came to the con- and Southern Ocean can all be explained with the
clusions that this central claim of the article is incor- common understanding that the deep-water forma-
rect and not supported by the evidence provided, tion in the North Atlantic associated with the AMOC
we submitted a comment to Nature (Nature’s Mat- releases heat to the atmosphere, thereby balancing the
ters Arising) demonstrating that a weaker Atlantic net heat uptake occurring over large areas in the ocean
meridional overturning circulation (AMOC) did not (Drijfhout 2015). Our paper neither claimed that any
enhance global surface warming over the last decades. two time series are ‘in phase’, nor ‘strong evidence’
Our comment as well as a reply by Chen and Tung for anything. Rather, we examined the hypothesis by
were peer-reviewed, with the conclusion that (Chen C&T that a weak AMOC enhances surface warm-
and Tung 2018) present a controversial perspective ing, which would be supported by a negative correl-
on the role of the AMOC in global surface warming ation between AMOC strength and surface temper-
which should be challenged in the conventional liter- ature, and we found the correlation to be positive.
ature rather than a formal reply. This is what we have We therefore concluded that the data presented by
done with our ERL publication. C&T in support of their hypothesis (albeit without
© 2021 The Author(s). Published by IOP Publishing LtdEnviron. Res. Lett. 16 (2021) 038002 L Caesar et al
quantitative analysis), do in fact not support their that the GMST is influenced by other factors, most
hypothesis when subjected to a quantitative analysis. of all the increase in CO2 , the GMST was adjusted
We further found that the data they presented are to subtract the effect of radiative forcing. The for-
explained by the established view that a weak AMOC cing correction was done in two different ways: (a) by
reduces global surface warming, and by the expec- just removing the long-term warming signal (either
ted changes in horizontal rather than vertical heat by removing the linear trend or by removing a non-
transport. linear trend as done by Chen and Tung (2018)), and
(b) by using a simple equation for the global mean
1. Correlation analysis of AMOC strength energy balance (Trenberth et al 2010, Brown et al
and GMST change 2014):
To determine the relationship between AMOC cm dT/dt = ∆Qrad − ∆Qocean − λ∆T (1)
strength and global surface warming, a correlation
with T the GMST, cm the effective heat capacity of
analysis of the observed changes in the GMST (adjus-
the system (dominated by the ocean mixed layer),
ted to account for radiative forcing) and several
Qrad the radiative forcing and Qocean the vertical heat
indices of the AMOC strength was performed. Here,
transport across the bottom of the ocean mixed layer
C&T criticize that we apply evidence based on prein-
(Brown et al 2014).
dustrial conditions to the present. This is not true.
C&T question the validity of this analysis on
We use the same observational data (1947–2012) for
several points, which are examined in the follow-
GMST and AMOC strength for which C&T con-
ing. First, C&T argue that we are using an incorrect
cluded that they show that a weakened AMOC leads
simplification of the equation for the Earth’s energy
to a period of more rapid surface warming (Chen
budget (Brown et al 2014) to account for the changes
and Tung 2018, figure 3). We use a simple correlation
in the radiative forcing. Their argument is based on an
analysis to demonstrate that the opposite appears
order-of-magnitude analysis comparing cm dT/dt to
to be true. Therefore, our data analysis is consistent
λ ∆T, concluding that, when looking at decadal vari-
with and supports the previous understanding that
ations, the former is larger than λ ∆T by a factor of 3.
the deep-water formation associated with the AMOC
However, they fail to understand that this is a global
cools the deep ocean and warms the surface. This
mean heat budget equation, for which a mixed layer
established understanding is also not solely based on
depth of 200 m is far too large and a factor of 0.7 is
preindustrial conditions (as claimed by C&T), it is
required to account for the fraction of Earth covered
rather based on years of research (e.g. Winton 1995,
by ocean. Thus the effective heat capacity of the mixed
Drijfhout 2015) as well as the physical basis of deep-
layer is defined as (Brown et al 2014)
water formation, as explained in the following. The
AMOC is sustained by two main drivers: deep-water cm = 0.7 ∗ ρ Cp D
formation in the North Atlantic (e.g. Jungclaus et al
2005, Swingedouw et al 2007) and Ekman pumping with ρ = 1030 kg m−3 , Cp = 4180 J kg−1 K−1 and
in the Southern Ocean (e.g. Toggweiler and Samuels D ∼ 75 m, therefore cm = 2.3 × 10⁸ J m−2 K−1 ,
1998, Kuhlbrodt et al 2007). With the latter domin- yielding a value of about 0.3–0.7 W m−2 K−1 for
ating, it is theoretically possible for the AMOC to be decadal variations (10–30 years). This is smaller by
thermally indirect and to pump heat downward into a factor of 2–10 than the range of values for the
the deeper ocean (Zika et al 2013), yet for the period feedback parameter λ considered in Caesar et al
of interest (1947–2012) a weaker AMOC coincides (2020) (1.3–3.0 W m−2 K−1 , with a best estimate
with a strengthening of the Southern Ocean west- of 2.3 W m−2 K−1 for the considered time period
erly winds (Swart et al 2015), suggesting that, for this (Gregory and Andrews 2016)). Empirical studies have
period, the dominating factor for AMOC variability furthermore shown that the time lag between forcing
is the thermally driven deep-water formation in the change and temperature response in the mixed layer,
North Atlantic. Of course, C&T are correct in say- which is caused by the transient term cm dT/dt, is
ing that new results do not have to be conform with far shorter than decadal (Foster and Rahmstorf 2011)
previous evidence. But new results must be suppor- and therefore not significant for this analysis.
ted by proper evidence and they have to be consist- Yet, the conclusion of Caesar et al (2020) does
ent. With our analysis we showed that C&T’s claim not depend on the analysis described above (where
that an AMOC slowdown would act to increase sur- the relationship between the GMST evolution and
face warming is inconsistent with the observed data, AMOC strength is evaluated while accounting for
including the data they presented in support of their the variability in GMST due to changes in the radi-
claims but without providing any statistical analysis ative forcing as well as feedback processes in the
in their original publication (Chen and Tung 2018). Earth system). Caesar et al (2020) also revisit the
In contrast, our analysis includes a statistical eval- analysis of Chen and Tung (2018) where the radiat-
uation of the relationship between AMOC strength ive forcing is taken into account simply by detrend-
and global surface warming. To account for the fact ing the data (with both a linear trend and the
2Environ. Res. Lett. 16 (2021) 038002 L Caesar et al
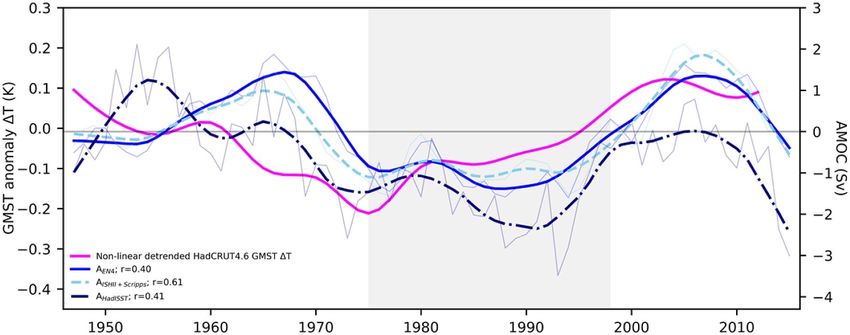
Figure 1. Time evolution of the multidecadal variability of the AMOC compared to the global mean surface temperature for the
time period 1947–2012. In grey the time period from 1975 to 1998 is marked during which the AMOC was in a relatively weak
state. Proxies for the AMOC are the salinity based proxies AISHIIS+Scripps , AEN4 and the temperature based proxy AHadISST (shades
of blue). The global mean temperature deviation is based on HadCRUT4.6 data and is corrected for secular trend as done by
Chen and Tung (2018) (∆T, magenta). Thin lines are annual values; thick lines are 10 year LOWESS smoothed values.
same secular trend C&T used), yielding very sim- the period of 1947–2012 is long enough to study
ilar results (the code can be found at www.pik- the relationship between the decadal variability of
potsdam.de/∼caesar/AMOC_OHC/—showing that AMOC and GMST and even hints at the reverse in
we did not apply a second detrending as C&T claim). this relationship as continued global warming will
Figure 1 compares the smoothed, multidecadal vari- eventually lead to a slowdown of the overturning
ability of the GMST (following Chen and Tung 2018) circulation.
compared to the smoothed AMOC strength, and the The fact that most of the calculated correlation
positive correlation is clearly visible (as it is in figure coefficients are not significant (something we poin-
3 of the comment by Chen and Tung, especially when ted out in our paper) does not call into question any
looking at the time periods 1960–1975 and 1990 of our conclusions. What we conclude is that the neg-
onwards). ative relationship claimed by C&T is not supported
C&T now argue that a trend removal in general is by the data. For that it logically suffices that the cor-
incorrect when only one cycle of data is considered. relation analysis does not show a negative correlation;
Yet the 1947–2012 shows clearly more than one cycle, there is no need to show that the positive correlation
and the removal of the trend is done to ensure that no found is statistically significant.
spurious correlations due to a common trend occurs. We would also like to stress here that we never
Furthermore, the results of the analysis are not sens- claimed that the positive correlation between AMOC
itive to the trend removal. Table 1 list the correlation and GMST means that the two time series are
coefficients for both the energy balance approach and in phase. We show that the time series are not
the secular trend removal after Chen and Tung (2018) anti-correlated, which would be the case if a reduced
for the case that the AMOC indices are not linearly AMOC leads to an increased surface warming as
detrended as well as the results for the case that none claimed by C&T.
of the time series is detrended (which also means that
no radiative forcing correction is done on the GMST 2. Changes in the ocean heat content
evolution).
Most of the correlation coefficients remain pos- Overall, C&T spend most of their comment on dis-
itive. The largest negative value of −0.1 describes cussing why their 2018 paper is (in their opinion)
the relationship between the sea surface temperature correct, which seems not appropriate for a comment.
(SST)-based AMOC index (Caesar et al 2018) and Nevertheless, we explain in the following why the
the GMST with no trend removed. This is not sur- data they present do not disagree with the results of
prising as the latter shows a clear warming sig- Caesar et al (2020).
nal, while the former shows a slowdown over the Figure 5 of the comment is supposed to show
time period 1947–2012. The resulting correlation ‘that more heat and salinity are transported down
coefficient therefore does not represent how the below the mixed layer, to 900 m, when AMOC is
decadal variability of AMOC strength and GMST stronger’ and C&T claim that it provides ‘definitive
are related, but rather how global warming will observational evidence’. However, there is no analysis
affect the AMOC in the long term, i.e. by slowing it of downward transport in this figure. It merely shows
down (Maroon et al 2018). This also shows us that heat and salinity anomalies regardless of what process
3Environ. Res. Lett. 16 (2021) 038002 L Caesar et al
Table 1. Results of the sensitivity analysis of the correlation values without linearly detrending the data. The correlation values were
calculated for the whole time period (1947–2012) and are given for different values of the feedback parameter λ as well as the case that
the radiative forcing is either not taken into account (‘no trend removed’) or considered by removing a secular trend (taking the data
from Chen and Tung 2018).
λ in W K−1 m−2 No trend Secular warming
AMOC proxy 1.3 1.5 1.9 2.3 3 removed trend removed
ISHII + Scripps −0.08 −0.05 0.00 0.09 0.35 0.42 0.61
EN4 0.09 0.12 0.17 0.24 0.45 0.23 0.40
HadISST 0.38 0.39 0.41 0.45 0.52 −0.10 0.41
caused these; a warm anomaly at depth could arise during a time of strong AMOC; rather they provide
from anomalous warmth at the surface being mixed evidence that there is more horizontal heat transport
down regardless of any anomaly in AMOC strength into the northern Atlantic during a time of strong
(i.e. due to the strong SST anomaly rather than due AMOC, exactly as we argued in our paper and as is
an AMOC anomaly), or it could also arise from hori- commonly understood.
zontal transport. That it is due to an AMOC anomaly
is thus pure speculation (by the way their unit on the 3. Related literature
heat graph is nonsensical because red shading can-
not show an amount of heat in Joules; presumably To support their findings, C&T cite the study by
it is something like Joules per unit of depth). There Kostov et al (2014). This is misleading as Kostov
is also confusion in the time dimension here since et al do not deal with the questions of whether the
‘more heat being transported down’ would corres- AMOC transports warm or cold surface waters to
pond to a high rate of increase in heat at depth. How- the deep ocean, it rather shows that a model with a
ever, just around peak AMOC strength this rate of strong mean AMOC has a larger ocean heat capa-
warming appears to be very low (roughly horizontal city (better ocean ventilation) and thus more thermal
contours)—so their graph does not even show deep inertia. This can then delay global surface warming
warming coinciding with strong AMOC, let alone as it enables the ocean to better take up excess heat
the mechanism by which it might occur if it actu- but is not related to the process we analyse in this
ally did occur. We would also like to point out that paper, i.e. how the decadal variability of the AMOC
the global temperature anomaly graph in figure 5(a) is related to the GMST. The results of Kostov et al
looks different from established global mean temper- (2014) are furthermore based on a simulation where
ature data and also stops in 2012, though we are now the CO2 concentration in the atmosphere was
in 2020. As a result the red smooth apparently does instantly quadrupled—a situation that is not even
not account for the post-2012 data, so the last portion remotely comparable to the current climate change.
of this smooth is just based on using some boundary Nevertheless, we would like to stress again that our
assumption (which is a way of producing a smooth conclusion that a weakening of the AMOC cools the
curve—though with large uncertainty—when data surface only holds for the present and the near future.
are missing, but in fact the post-2012 data are avail- It is very likely that anthropogenic warming will even-
able, of course). The near-constant temperatures for tually lead to a weakening of the AMOC causing a
the last 10 years in this graph are an artefact of the negative relationship between AMOC strength and
cherry-picked end date and inappropriate smoothing GMST on longer time scales (Maroon et al 2018).
(this so-called ‘hiatus’ has been thoroughly refuted in Maroon et al also differentiated between the effects
ERL (e.g. Lewandowsky et al 2018)). of forced and unforced AMOC variability on surface
What figure 5 really shows is that there is a heat temperatures concluding about the latter that ‘there is
peak in the mixed layer during the AMOC maximum a positive relationship between global surface warm-
in 2006 which coincides with a heat peak at all depths ing and AMOC strength’ (their figure 4(b) shows
down to 1200 m. That is exactly the signal one would the correlation of AMOC and global warming with
expect from horizontal transport (i.e. the classic view the ensemble mean removed, i.e. the correlation of
of the AMOC as argued in our paper). If the reason- the unforced variability), which is in contrast to the
ing of C&T were correct, the heat peak at the surface findings of C&T.
would coincide with a maximum heating rate and be
followed by a maximum heat peak at depth which is 4. Conclusion
not the case. Instead, the temperatures at depth start
cooling during (and below 900 m even before) peak Due to the number of processes involved it is very dif-
warmth near the surface and peak AMOC (around ficult to determine the relationship between AMOC
the year 2004). strength and GMST at a given time(scale). Our study
Therefore, C&T provide no evidence for their does not aim at the precise determination of this rela-
claim that there is more downward heat transport tionship, we merely show that the data provided by
4Environ. Res. Lett. 16 (2021) 038002 L Caesar et al
after Chen and Tung (2018) do not support their Drijfhout S 2015 Competition between global warming and an
hypothesis that over the last decades a slowdown of abrupt collapse of the AMOC in Earth’s energy imbalance
Sci. Rep. 5 14877
the AMOC has led to increased surface warming. We
Foster G and Rahmstorf S 2011 Global temperature evolution
acknowledge that this relationship depends on both 1979–2010 Environ. Res. Lett. 6 044022
the considered time scale and period, and may change Gregory J M and Andrews T 2016 Variation in climate sensitivity
in the future, yet the observed data of the last decades and feedback parameters during the historical period
Geophys. Res. Lett. 43 3911–20
supports the understanding that the effect of a slower
Jungclaus J H, Haak H, Latif M and Mikolajewicz U 2005
AMOC on surface warming is a cooling effect. Arctic–North Atlantic interactions and multidecadal
variability of the meridional overturning circulation J. Clim.
18 4013–31
Data availability statement Kostov Y, Armour K C and Marshall J 2014 Impact of the Atlantic
meridional overturning circulation on ocean heat storage
The data that support the findings of this study and transient climate change Geophys. Res. Lett. 41 2108–16
Kuhlbrodt T, Griesel A, Montoya M, Levermann A, Hofmann M
are available from the corresponding author upon and Rahmstorf S 2007 On the driving processes of the
request. Atlantic meridional overturning circulation Rev. Geophys.
45 RG2001
Lewandowsky S, Cowtan K, Risbey J S, Mann M E, Steinman B A,
ORCID iDs Oreskes N and Rahmstorf S 2018 The ‘pause’ in global
warming in historical context: (II). Comparing models to
observations Environ. Res. Lett. 13 123007
L Caesar https://orcid.org/0000-0002-5626-0392 Maroon E A, Kay J E and Karnauskas K B 2018 Influence of the
S Rahmstorf https://orcid.org/0000-0001-6786- Atlantic meridional overturning circulation on the Northern
7723 Hemisphere surface temperature response to radiative
G Feulner https://orcid.org/0000-0001-9215-5517 forcing J. Clim. 31 9207–24
Swart N C, Fyfe J C, Gillett N and Marshall G J 2015 Comparing
trends in the southern annular mode and surface westerly jet
References J. Clim. 28 8840–59
Swingedouw D, Braconnot P, Delecluse P, Guilyardi E and
Brown P T, Li W, Li L and Ming Y 2014 Top-of-atmosphere Marti O 2007 The impact of global freshwater forcing on the
radiative contribution to unforced decadal global thermohaline circulation: adjustment of North Atlantic
temperature variability in climate models Geophys. Res. Lett. convection sites in a CGCM Clim. Dyn. 28 291–305
41 5175–83 Toggweiler J R and Samuels B 1998 On the ocean’s large-scale
Caesar L, Rahmstorf S and Feulner G 2020 On the relationship circulation near the limit of no vertical mixing J. Phys.
between Atlantic meridional overturning circulation Oceanogr. 28 1832–52
slowdown and global surface warming Environ. Res. Lett. Trenberth K E, Fasullo J T, O’Dell C and Wong T 2010
15 024003 Relationships between tropical sea surface temperature and
Caesar L, Rahmstorf S, Robinson A, Feulner G and Saba V 2018 top-of-atmosphere radiation Geophys. Res. Lett. 37 n/a
Observed fingerprint of a weakening Atlantic Ocean Winton M 1995 Why is the deep sinking narrow? J. Phys.
overturning circulation Nature 556 191–6 Oceanogr. 25 997–1005
Chen X and Tung K K 2018 Global surface warming enhanced Zika J D, Sijp W P and England M H 2013 Vertical heat transport
by weak Atlantic overturning circulation Nature by ocean circulation and the role of mechanical and haline
559 387–91 forcing J. Phys. Oceanogr. 43 2095–112
5You can also read