A VISION SYSTEM FOR ONLINE WEAR DETECTION
←
→
Page content transcription
If your browser does not render page correctly, please read the page content below
Proceedings, XVII IMEKO World Congress, June 22 – 27, 2003, Dubrovnik, Croatia                                                TC1

  Proceedings, XVII IMEKO World Congress, June 22 – 27, 2003, Dubrovnik, Croatia                                                TC15

                                                  XVII IMEKO World Congress
                                                 Metrology in the 3rd Millennium
                                              June 22−27, 2003, Dubrovnik, Croatia

                     A VISION SYSTEM FOR ONLINE WEAR DETECTION

                                      Jianbo Zhang, Maarten Korsten, Paul Regtien

                 Department of Electrical Engineering, University of Twente, Enschede, the Netherlands

      Abstract − Wear detection has traditionally restricted           measurement using these techniques is very sensitive to
  itself to offline study and measurement. In this paper a             vibrations. Besides, light sectioning and grating projection
  vision system for online monitoring and detection of wear is         based approaches also can be used to obtain the surface
  described. This system uses a video zoom microscope and a            profile [8], but they have relatively poor lateral resolution
  high-resolution monochrome camera to capture the image               and are not suitable for measuring surfaces in motion as
  series of a moving surface under study. An algorithm based           well.
  on multichannel filtering for the detection of wear patterns is          In tribology research and some practical applications,
  presented. The wear patterns are extracted by filtering the          timely detection and quantification of wear online is
  acquired image using a Gabor filter bank with multiple               required. Online wear detection, compared with the
  narrow spatial frequency and orientation channels.                   conventional offline methodology, is more accurate and
  Experiments show the feasibility and usefulness of the               significant in the sense of neither interrupting the dynamic
  proposed vision system and detection method of wear                  process of wear nor changing the wear condition. Therefore,
  patterns.                                                            this approach is possibly useful for the investigation of a
                                                                       particular wear mechanism and practical surface inspection.
     Keywords: Online wear detection                                       In the WEAR project sponsored by STW (Dutch
                                                                       Technology Foundation), studies of noncontact detection
                      1. INTRODUCTION                                  and monitoring of micro- and macrowear using imaging
                                                                       methods are currently being carried out. One of the aims of
      Wear is one of the main causes of replacement of key             this project is to develop online methodologies for the
  machinery elements in their every aspect of life. Detection          detection and monitoring of wear. A simple vision system
  and monitoring of wear, therefore, is very important not             for this purpose is currently developed.
  only in studying material properties but also in predicting              A computer-based vision system is a good strategy for
  the lifetime of product components and guaranteeing their            non-contact, online, and high speed wear detection and
  reliability and effectiveness. Traditional methods of the            monitoring. It is suitable for applications in an automated
  measurement of wear are often based on the measurement of            environment, where high speed and low cost are required. It
  mass differences, volume differences, or displacements               also allows one to visualize and gain further understanding
  generated by wear [7]. Using these methods global                    of the wear process by viewing the time series of
  information about wear can be obtained. Local information,           photomicrographs. The composition of this vision system
  however, is more helpful and valuable since wear takes               will be described in detail in subsection 2.1. Using this
  place at a microscopic scale between contacting asperities of        vision system a sequence of photomicrographs of the
  the surfaces in contact.                                             surface of the specimen under test is captured and filtered by
      The surface profile has a big influence on the                   a Gabor filter bank with multiple narrow spatial frequency
  tribological properties and service life of machine elements.        and orientation channels. By this way, the wear patterns
  Therefore, measurement of profile changes of finished or             with different sizes and orientations, which occur on the
  worn surfaces is frequently carried out in engineering and           surface, are extracted. The changes of these detected wear
  research [1, 2]. Several techniques of microscopy, such as           patterns indicate the wear status of the specimen being
  interference microscopy, atomic force microscopy, scanning           monitored. The procedure of the extraction of wear patterns
  tunnelling microscopy, and so on, are extensively used to            is addressed in subsection 2.3. The experimental results and
  obtain surface topography [4]. Although these profiling              discussions will be given in subsection 2.4 followed by
  techniques have high depth resolution, down to nanometers,           conclusions as well as future work in section 3.
  they have some weak points. First, these techniques can only
  measure wear offline. During the experiment, the specimen                 2. ONLINE WEAR DETECTION TECHNIQUE
  must be removed from the tester periodically to measure the
  evolution of wear as a function of time or sliding distance. It         Modern fabrication of parts typically involves
  is very difficult to re-measure at the same location on the          machining, grinding, and polishing to remove material and
  specimen before and after the wear test. The mounting and            to create a surface with specific macroscopic dimensions
  dismounting steps unavoidably bring in errors. Second, the           and also microscopic roughness. One of the purposes of this

                                                                    1960
Proceedings, XVII IMEKO World Congress, June 22 – 27, 2003, Dubrovnik, Croatia TC1
Proceedings, XVII IMEKO World Congress, June 22 – 27, 2003, Dubrovnik, Croatia TC15
process is to reduce the risk of suffering wear during the through a ring guide that is mounted at the end of the
surface use. Most surfaces appear as regular textures to a microscope, provides glare-free and heat-free illumination
certain extent due to the quasi-periodical process of surface for the system. The intensity can be adjusted manually.
fabrication. Fig. 1 shows an example of a surface image of
stainless steel manufactured by turning operation. From this
image one can see approximately parallel strips, Light
corresponding to grooves or lays in a real surface. Camera Soure
Load
Image grabber
Test sample
Indenter
Computer
Servo
Rotary table Motor
Fig. 2. Schematic diagram of the experimental set-up
2.2. Gabor filter bank
As explained at the beginning of this section, the area
and orientation of wear patterns give the clues of the wear
state of the surface being monitored. In this subsection we
Fig. 1. A surface image of stainless steel fabricated by turning will address how to extract wear patterns from textured
images, which is actually a texture interpretation and a
When a beam of light is reflected by a rough surface, the segmentation problem.
intensity and pattern of the scattered radiation depend on the There are a lot of approaches to texture segmentation.
roughness heights, the spatial wavelengths of the surface Two well-known categories among them are statistical, and
and the wavelength of the light [4]. In the case of one filtering approaches. The gray level co-occurrence matrix,
textured surface sliding upon another one, the surface with belonging to the statistical methods, is very computation
softer material wears and its worn area becomes smoother as consuming [10] and sensitive to image quality, and therefore
the asperities are removed. This will result in apparent is not suitable for online wear detection. As to the filtering
texture changes in the images (see Fig. 6b) captured by a approach, Fourier-domain-based techniques are particularly
properly designed vision system, which will be described in suitable for materials that exhibit high degree of periodicity.
detail in the following subsection. As a consequence, the But Fourier analysis does not provide, in general, enough
worn regions of the surface, referred to as wear patterns in information on local features. Methods that can localize
images, can be characterised as texture changes with respect features in the spatial as well as in the frequency domain are
to the unworn region. The area and orientation of wear convenient for detecting local wear patterns. As Gabor
patterns indicate the wear state of the surface. Thus, wear filters yield optimal localization in space and frequency
detection and characterization can be carried out, using an domains [6], they are extensively used for texture analysis
image texture analysis process. [3, 5], and are also adopted in this paper to extract wear
patterns occurring on textured surfaces. Next a brief
2.1. Experimental set-up introduction about Gabor filters is given.
A schematic diagram of the experimental set-up is In the spatial domain, the Gabor function is a complex
shown in Fig. 2. A wear test is conducted by loading a flat exponential modulated by a Gaussian function. It has the
or sphere shaped indenter, pin or ball, which is mounted on following general form [3, 5]:
a stiff lever, onto a test sample that is fixed on a motor-
driven rotary table. A servo motor controller is used to vary 1 1 x2 y2
the rotation speed of the table. The load applied on the test g(x, y) = exp[− ( 2 + 2 ) + 2π ju0x] (1)
2πσxσ y 2 σx σ y
sample is controlled by removing or adding weights on the
lever. The surface of the test sample is ground or machined. where u0 denotes the radial frequency of the Gabor function,
The indenter made of harder material is used to evoke wear σx and σy the standard deviation of the Gaussian envelope.
on the sample. In the frequency domain, the Gabor function acts as a band-
The wearing surface is monitored by a vision system, pass filter and its Fourier transform is:
which is a combination of a video zoom microscope and a
monochrome CCD sensor. The magnification of the imaging 1 (u − u 0 ) v 2
system is 2.5× to 10×; the corresponding system resolution G (u , v ) = exp{− [ + 2 ]} (2)
(lateral) is 9.8 to 4.4 µm. The optical axis of the system is 2 σ u2 σv
perpendicular to the nominal plane of the test surface. Image
where σ u = 1/ 2πσ x , σ v = 1/ 2πσ y . A self-similar filter
sequences are captured through a frame grabber into a
computer in real time. A 150-watt fiber optic illuminator, bank can be obtained by appropriate dilation and rotation of
1961Proceedings, XVII IMEKO World Congress, June 22 – 27, 2003, Dubrovnik, Croatia TC1
Proceedings, XVII IMEKO World Congress, June 22 – 27, 2003, Dubrovnik, Croatia TC15
g( x , y ) through the generating function difference images for recognizing wear features. The
reference feature images are computed at the beginning of
g mn ( x, y ) = α − m g ( x′, y′) (3) the wear detection as a calibration operation, which does not
increase computational load in the online detection.
where x ' =α−m(xcosθ + ysinθ ) , y ' = α −m (−x sinθ + y cosθ ) , c. Computing the feature difference images and fusing
α >1, m = 1, 2,…, P, n = 1, 2,…, Q, θ = (n-1)π/Q, P and Q them to be a unique feature image.
are the total number of scales and orientations respectively. Each feature image I mn ( x , y ) obtained in the previous
The parameters of the Gabor filter bank, α, σx and σy are step is compared with each corresponding reference feature
selected as illustrated in [3] to ensure that the half-peak image to compute the feature difference image, in which
magnitude responses of adjacent filters touch each other to only possible wear features are remained. In addition, as the
reduce redundancy. In [5] the real and imaginary part of information gathered by different channels is often
each of the complex Gabor functions are used for filtering. uncertain, fuzzy or incomplete, it is better to fuse all the
In our case, experiments show that the imaginary part does feature difference images. Experiments show that the
not provide further improvement for the extraction of wear approach proposed in [5] for feature difference and data
patterns. For this reason, only the real part of the Gabor fusion is fast and also works well in our case, therefore is
function is adopted, i.e., (1) is replaced with adopted as well.
d. Thresholding the fused image to suppress the pixels
1 1 x2 y2 not belonging to wear patterns
g ( x, y ) = exp[ − ( 2 + 2 )]cos(2π u0 x ) (4)
2πσ xσ y 2 σx σy To separate the wear patterns and further reducing the
probability of false alarm, a thresholding operation is
Using only the real part also greatly saves computational applied. From the histogram of the fused image (see Fig. 4)
load. one can find two peaks, each peak belonging to one class
(the left peak to background noise, the right peak to wear
2.3. Wear pattern extraction patterns). For this histogram shape, the best threshold value
The procedure of wear pattern extraction is illustrated in to separate the wear patterns can be found by using an
Fig. 3: automatic isodata thresholding procedure [9].
a. Enhancing the input image to emphasize and Through the procedure above, wear patterns with
sharpen the image features for further analysis. different sizes and orientations are successfully extracted.
As the gray level intensities of the images under wear Important wear features such as wear area, centroid, area
detection is directly related to the extent of wear on the moments and products of inertia, wear orientation, and so on
surface, the enhancement should not re-distribute the gray can be calculated from the separated wear patterns to
values. Here histogram stretching is applied: indicate wear state of the surface being monitored.
I (x, y) − I (x, y)MIN
I (x, y)str = (MAX − MIN) + MIN (5) Input image Reference image
I (x, y)MAX − I (x, y)MIN
(Under wear detection) (Wear-free)
where I(x,y)MIN and I(x,y)MAX are the minimum and
maximum gray values in the image. MAX and MIN
correspond to the maximum and the minimum gray levels in
the enhanced images. Histogram stretching would result in
an image with a higher contrast, which is particularly useful Image enhancement
when the pixel values fall within a small range.
b. Filtering the enhanced image using the Gabor filter
bank (3), which allows multiresolution analysis of Multichannel Gabor
image texture. filtering
Each of the Gabor functions can be implemented as a
spatial mask of size N×N (see Fig. 5). For a given input
image I ( x, y ) , the magnitude of the filtered image Feature difference
I mn ( x , y ) is obtained by using the Gabor filter function
g mn ( x , y ) as follows: Data fusion
I mn ( x, y ) =| I str ( x, y ) * g mn ( x, y ) | (6)
where “*” denotes 2-D convolution. Namely, the image is Thresholding
filtered by each channel that is tuned to a narrow range of
size and orientation. The filtered images from different
channels are called feature images. The same operation is Output image
also applied to a wear-free reference image to get reference
feature images, which are used to compute feature Fig. 3. Schematic diagram of wear pattern extraction procedure
1962Proceedings, XVII IMEKO World Congress, June 22 – 27, 2003, Dubrovnik, Croatia TC1
Proceedings, XVII IMEKO World Congress, June 22 – 27, 2003, Dubrovnik, Croatia TC15
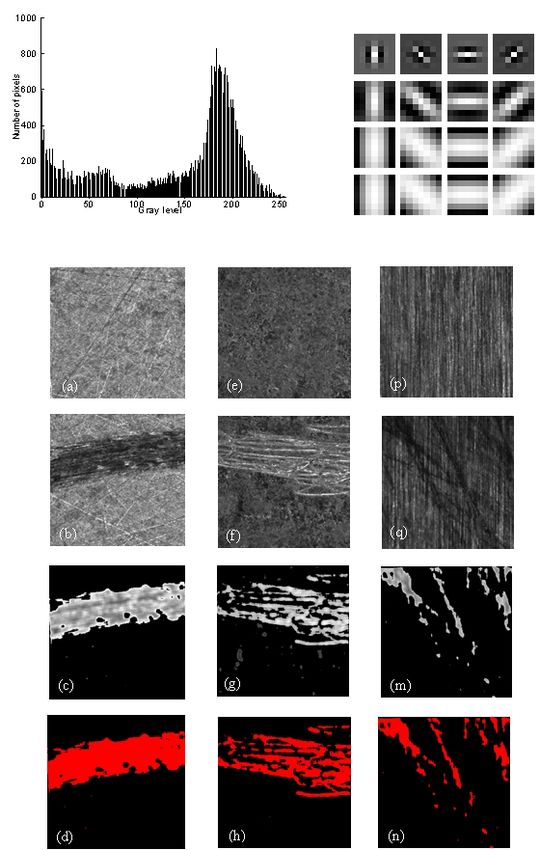
Fig. 4. Histogram of a fused image before thresholding Fig. 5. 4 × 4 real Gabor filters in spatial domain
Fig. 6. Samples with wear: reference images of the samples in (a), (e) , (p) ; images of the samples with wear in (b), (f), (q);
corresponding filtered images in (c), (g), (m); segmented wear patterns in (d), (h), (n).
1963Proceedings, XVII IMEKO World Congress, June 22 – 27, 2003, Dubrovnik, Croatia TC1
Proceedings, XVII IMEKO World Congress, June 22 – 27, 2003, Dubrovnik, Croatia TC15
2.4. Results and discussions
The performance of the vision system for online wear 3. CONCLUSIONS AND FUTUR WORK
detection using the multichannel filtering scheme described
above was evaluated on three test samples with different This paper presents a new approach to detect and
surface textures. One is a machined steel ring with a wear monitor microwear online using a vision system.
track in the middle (Fig. 6b), the second is a vapor-polished Multichannel filtering using a Gabor filter bank is suitable
aluminium bar with wear scratches (Fig. 6f), the third one is for extracting wear patterns on textured surfaces machined
a ground steel bar with wear scratches (Fig. 6q). with different methods. This approach is feasible in
In the experiment, a bank of 4 × 4 Gabor filters detecting dry sliding wear especially at the initial and
described in subsection 2.2 are adopted for detection of wear moderate wear stage.
patterns. Each Gabor filter is implemented as a spatial 7 × 7 So far extraction of wear patterns using the vision
mask for a computational compromise. A small mask size system is investigated. The future work is to study the
corresponds to small computation load, which is desirable correlation between changes of wear features and wear rate
for online wear detection. The frequency range of Gabor of a specific surface.
filters in the filter bank depends on the range of wear
patterns to be detected. Fig. 5 shows the representation of REFERENCES
the Gabor bank using 7 × 7 masks in the spatial domain.
The experimental results are shown in Fig. 6, of which [1] S. Yin, J. Li, M. Song, “Surface profile measurement using a
unique microtube-based system”, Opt. Comm., vol. 168, pp.
the top row (Figs. 6a, 6e and 6p) are wear-free images 1-6, 1999.
captured during the calibration phase; the second row (Figs. [2] R. Gahlin, S. Jacobson, “ A novel method to map and
6b, 6f and 6q) are images acquired during wear processes; quantify wear on a micro-scale”, Wear, vol. 222, pp. 93-102,
the third row (Figs. 6c, 6g and 6m) are images after 1998.
multichannel filtering and fusion operation; the bottom row [3] B. S. Manjunath and W. Y. Ma, “Texture features for
(Figs. 6d, 6h and 6n) shows the segmented wear patterns browsing and retrieval of image data”, IEEE Trans. Pattern
(red colour-coded regions). From these experiments one can Anal. Machine Intell., vol. 18, no. 8, pp. 837-842, 1996
find that, using the proposed multichannel filtering [4] T. R. Thomas, “ Rough Surface”, Imperial College Press,
algorithm, the wear patterns (wear scratches or wear track) 1999.
[5] A. Kumar, G. K. H. Pang, “Defect detection in textured
occurring on the surfaces of the three samples are materials using Gabor filters”, IEEE Trans. Ind. Applicat.,
successfully extracted. As mentioned previously, from these vol. 38, no. 2, pp. 425-439.
separated wear patterns, some wear features, such as their [6] J. G. Daugman, “Uncertainty relation for resolution in space,
shape (area and orientation), centroid, moments and spatial frequency and orientation optimised by two
products of inertia, length of principal axes, etc. can be dimensional visual cortical filters”, J. Opt. Soc. Am., vol. 2,
further calculated to indicate wear state of the surface being no. 7, pp. 1160-1169, 1985.
monitored. [7] M. B. de Rooij, “Tribological aspects of unlubricated
It is seen that using the simple vision system to detect deepdrawing process”, Ph.D. thesis, University of Twente,
and monitor wear makes it possible to overcome or reduce 1998.
[8] M. B. Kiran, B. Ramamoorthy, V. Radhakrishnan, “
concerns about repositioning errors, sensitivity to vibrations, Evaluation of surface roughness by vision system”, Int. J.
slow measurement speed and additional damages to surfaces Mach. Tools Manufact. vol. 38, nos 5-6, pp. 685-690, 1998.
in offline methods, irrespective contact or noncontact, etc. [9] http://www.ph.tn.tudelft.nl/Courses/FIP/noframes/fip-
Unfortunately, it also has restrictions. First of all, it is only Segmenta.html.
suitable for monitoring clean surfaces. The presence of [10] David A. Clausi, “Comparison and fusion of co-occurrence,
contaminant or non-transparent lubricant will result in Gabor and MRF texture features for classification of SAR
errors. Secondly, the surface being monitored must be very sea-ice imagery”, Atomospere-Ocean, vol. 39, no.3, pp. 183-
smooth because the microscope easily gets out of focus 194, 2001.
when surface roughness is large, due to its small depth of
focus especially at high magnification. Thirdly, this Authors: Jianbo Zhang, Maarten Korsten, Paul Regtien, are with
the Lab. for Measurement and Instrumentation, Department of
approach is only useful for detecting the initial and moderate
Electrical Engineering, P.O. Box 217, 7500 AE, Enschede, the
stage of a wear process because with the wear process Netherlands; Phone: +31 53 489 2778; Fax: +31 53 489 1067;
further going on, surface changes in depth will dominate Email: {j.b.zhang; m.j.korsten; p.p.l.regtien} @el.utwente.nl
changes in spatial direction.
1964You can also read