Probability Risk of Heat and Cold Related Mortality to Temperature, Gender, and Age Using GAM Regression Analysis - MDPI
←
→
Page content transcription
If your browser does not render page correctly, please read the page content below
Article

Probability Risk of Heat‐ and Cold‐Related Mortality
to Temperature, Gender, and Age Using GAM
Regression Analysis
Andri Pyrgou and Mattheos Santamouris *
 1 Faculty of Built Environment, University of New South Wales, Sydney 2052, Australia
 * Correspondence: m.santamouris@unsw.edu.au
 Received: 7 February 2020; Accepted: 11 March 2020; Published: 11 March 2020

 Abstract: We have examined the heat and cold‐related mortality risk subject to cold and heat
 extremes by using a generalized additive model (GAM) regression technique to quantify the effect
 of the stimulus of mortality in the presence of covariate data for 2007–2014 in Nicosia, Cyprus. The
 use of the GAM technique with multiple linear regression allowed for the continuous covariates of
 temperature and diurnal temperature range (DTR) to be modeled as smooth functions and the lag
 period was considered to relate mortality to lagged values of temperature. Our findings indicate
 that the previous three days’ temperatures were strongly predictive of mortality. The mortality risk
 decreased as the minimum temperature (Tmin) increased from the coldest days to a certain threshold
 temperature about 20–21°C (different for each age group and gender), above which the mortality
 risk increased as Tmin increased. The investigated fixed factors analysis showed an insignificant
 association of gender‐mortality, whereas the age‐mortality association showed that the population
 over 80 was more vulnerable to temperature variations. It was recommended that the minimum
 mortality temperature is calculated using the minimum daily temperatures because it has a stronger
 correlation to the probability for risk of mortality. It is still undetermined as to what degree a change
 in existing climatic conditions will increase the environmental stress to humans as the population is
 acclimatized to different climates with different threshold temperatures and minimum mortality
 temperatures.

 Keywords: heatwave; diurnal temperature range; time‐series; relative risk; health

1. Introduction
     The relationship between hot and cold temperatures and mortality from respiratory and
cardiovascular causes is well established. Governments and scientists are concerned with the
increased frequency of temperature extremes as they are associated with increased morbidity and
mortality [1,2]. Exploration of time series data in different countries has revealed a different
temperature threshold of their population [3], necessitating different adaptation measures for the
avoidance of the climate‐change impact and to increase the countries’ capacity to function at a
forthcoming temperature [4–8]. It is of utmost importance for the threshold temperature to be
determined per country or prevalent climate as there is a gap in the identification of the correct course
of adaptation.
     Mortality risk with respect to temperature has been assessed by scientists in northeastern Europe
[9–12], the USA [13,14], and China [4] by considering fixed variables such as gender and age, resulting
in contrasting findings of the threshold temperature and minimum mortality temperature (MMT).
MMT is defined as the temperature at which there is the lowest risk of mortality according to a
probability risk assessment. The question of whether fixed factors are affecting the MMT has to be

Climate 2020, 8, 40; doi:10.3390/cli8030040                                     www.mdpi.com/journal/climate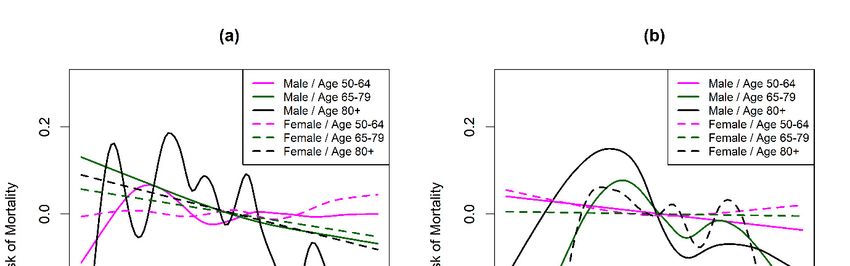
Climate 2020, 8, 40                                                                               2 of 10

addressed carefully in the eastern Mediterranean region because of the limited number of studies
showing high MMT; 29–32 °C [15]. Generally, MMT has been found to be lower for populations living
in colder climates and higher for populations living in warmer climates [11,14,16] with the
temperature–mortality relationship described as a J‐ , V‐, or U‐shaped curve.
     People acclimatize to new temperatures at varying rates and to a certain extent based on
physiological parameters such as age, gender, and other prevalent health conditions. The
environmental stress even within a day may be a factor of increased cardiovascular and respiratory
mortality. Moreover, the effect of exposure to extreme cold or heat conditions is not limited to the
specific day, but may be delayed in time [2,14,17]. The diurnal temperature range (DTR) is defined
as the difference between the daily minimum and maximum temperatures, with some studies
correlating a high DTR with an increase of mortality risk [17].
     To fill the above research gaps, we addressed the issue of temperature‐related mortality via the
use of the generalized additive model (GAM) regression technique. Using the GAM, we investigated
the effect of same day temperatures and the weighted average temperature of the preceding three on
mortality rates. The use of the GAM model to examine the short‐term mortality relationship to
regional minimum temperatures, maximum temperatures, and DTR variations revealed that MMT
should be calculated using daily minimum temperature values.

2. Methods

2.1. Study Area and Datasets
     Hourly weather data (temperature [°C]) and daily mortality data for 2007 to 2014 inclusive were
collected for two meteorological stations [18] in the urban (35.17°N, 33.36°E) and rural (35.05°N,
33.54°E) areas of Nicosia, Cyprus. Nicosia is the capital of the island of Cyprus, located in the eastern
basin of the Mediterranean Sea with a hot summer Mediterranean climate and hot semi‐arid climate
(in the northeastern part of island), according to the Köppen climate classification signs Csa
(Mediterranean hot summer climates) and BSh (Hot semi‐arid climates) [19], with warm to hot dry
summers and wet winters.
     The daily mortality counts were gathered only for circulatory and respiratory causes of death
and included ischemic heart diseases (I20–I25), cerebrovascular diseases (I60–I69), other heart
diseases (I30–I51), other circulatory diseases (I00–I15, I26–I28, I70–I99), influenza (J00–J99),
pneumonia (J12–J18), chronic lower respiratory diseases (J40–J47), and other respiratory causes (J00–
J06, J20–J39, J60–J99), according to the ICD‐10‐CM (International Classification of Diseases, Tenth
Revision, Clinical Modification). The daily mortality data were provided by the Health Monitoring
Unit of the Ministry of Health of Cyprus.

2.2. Log‐Linear Regression of Mortality–Temperature Relation
     The log mortality based on temperature was assumed to be smooth, but not necessarily linear
and a generalized additive model (GAM) was used. This GAM offered a high quality of prediction
of the dependent variable (log mortality rate) from the various distributions by estimating unspecific
(non‐parametric) functions of the predictor variables xj, which were connected to the dependent
variable (mortality rate) via a link function.
     As the death on a given day is not only a function of the same‐day exposure to temperature but
is also affected by exposure during a certain lag period, we also used the weighted average
temperature of the preceding three days prior to the death. The lag period was determined using the
cross correlation function (CCF) in RStudio software. Cross‐correlation analysis showed the
similarity of two series as a function of the displacement of one relative to the other. Figure 1 shows
the cross correlation of mortality rate with minimum daily temperature for a cold period (months
NDJFMA) and a hot period (months MJJASO). Similar analysis was also done for the mean and the
maximum daily temperatures. The mortality rate decreased with increasing temperature during the
cold period (Figure 1a) with a lag period of four days (that is, the highest peak of mortality four days
after the coldest temperature), whereas the mortality rate reached a peak on the same day (no lag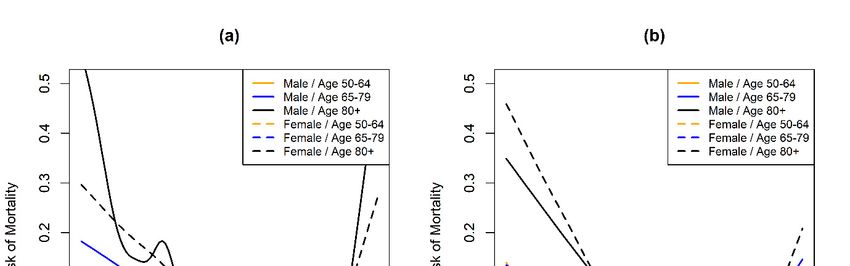
Climate 2020, 8, 40                                                                                3 of 10

period) as the maximum temperature (Figure 1b). The lag period of cross correlation function (CCF
analysis) that had an effect on mortality rate was four days during the cold period and 0 days during
the hot period. In an individual, the lag period should not be regarded as a well‐defined interval as
it may vary according to the magnitude of the temperature and individual characteristics such as
acclimatization habits to heat, genetic background, and income.

      Figure 1. Cross correlation for (a) minimum daily temperature (x) and mortality (y) for
      months November to April; (b) Minimum daily temperature (x) and mortality (y) for
      months May to October). Dotted blue horizontal lines show the 95% significance limits.

     To address the lagged dependence of mortality on temperature, the same‐day maximum (Tmax)
and minimum (Tmin) temperatures, the same‐day diurnal temperature range (DTR), and the average
temperature of the preceding three days (Tmax[–3] and Tmin[–3], respectively) and weighted average DTR
of the preceding three days (DTR[–3]) were used in order to closer examine the lag period of four days
found during the cold period. Diurnal temperature range is the temperature difference of the daily
maximum value and the daily minimum value [20].
     The advantage of GAM was to limit the error in the prediction of the dependent variable—
mortality rate—by defining the model in terms of smooth function. In the GAM, the degree of
smoothness of the estimated mortality–temperature relative risk curve is controlled by its number of
degrees of freedom (df). Many degrees of freedom were preferred to allow highly nonlinear shapes.
                      Relative risk of Mortality   β   f x     f x      ⋯    f   x                    (1)
    The functions fj may have a parametric or non‐parametric form. xj represents the temperature
term, which could be Tmin, Tmax, Tmax[–3], Tmin[–3], DTR or DTR[–3], as explained above. The relative risk
of mortality was calculated using the gam function of the mgcv package in RStudio software [21].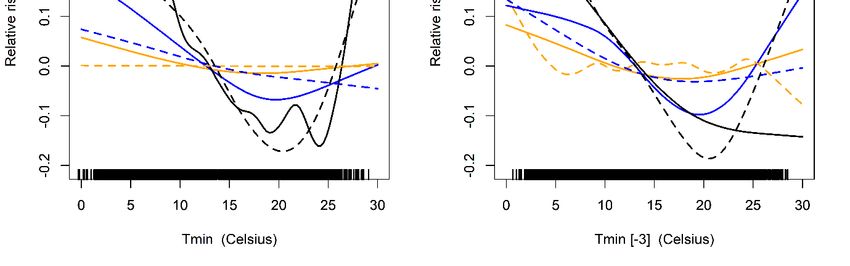
Climate 2020, 8, 40 4 of 10
The limitation of this short‐term temperature analysis was that longer‐term population characteristics
were not considered such as health behaviors (smoking, drinking), comorbidities (hypertension,
diabetes, cancer, etc.), medications, and access to health care.
3. Results
3.1. Temperature–Mortality Relative Risk Analysis
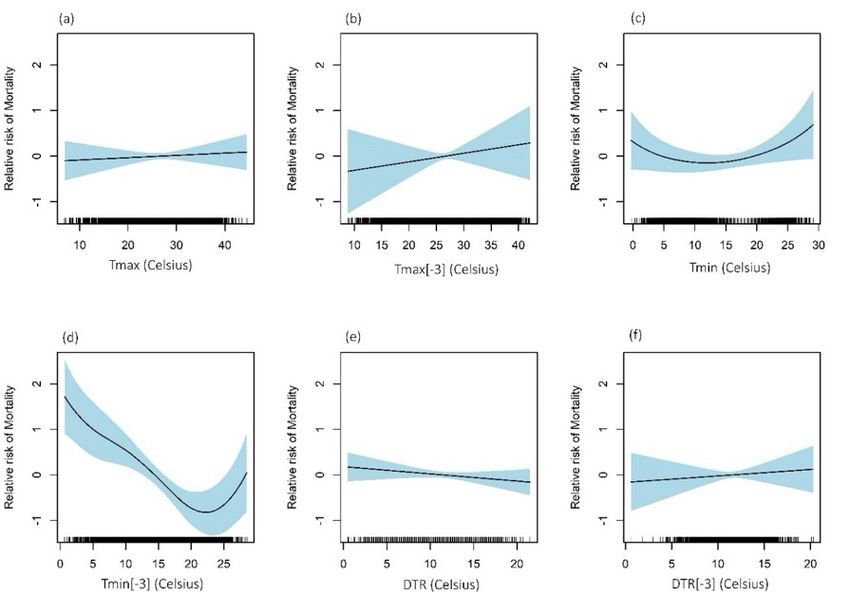
Figure 2 shows the temperature–mortality relative risk function estimated for Nicosia using
GAM analysis. We examined six temperature parameters: the maximum daily temperature (Tmax), the
weighted average of the maximum daily temperatures of the preceding three days (Tmax[–3]), the
minimum daily temperature (Tmin), the weighted average of the minimum daily temperatures of the
preceding three days (Tmin[–3]), the diurnal temperature range (DTR) of the day, and the weighted
average of the DTR of the preceding three days (DTR[–3]). A smooth function of time with 50 df over
the investigated years was used for the model. Similar findings were also found for smaller and larger
df.
The relationship between maximum daily temperature and probability risk of mortality seems
linear, with a steeper slope when the average of the preceding three days’ maximum temperature is
considered. The analysis of the minimum daily temperature with respect to the mortality’s
probability risk (Figures 2 c, d) showed a U shape for same‐day relationship and an inverse J shape
when Tmin[–3] was used. That is, mortality risk decreased as the minimum temperature increased from
the coldest temperatures and began to rise as the temperature increased from a certain threshold
temperature (approximately 22 °C). The applied model offers flexibility and agrees with Curriero et
al. [14] as the population in a warm region (such as Nicosia) tends to be more vulnerable to cold
rather than those residing in cold climates who are most sensitive to heat.
The analysis of DTR (Figures 2d, f) showed no significant results (mortality relative risk close to
zero), insinuating that the human body could adapt to any DTR within the same day. These results
thus need to be interpreted with attention, as previous studies have reported noteworthy findings of
DTR with the probability risk of mortality, therefore a more focused analysis sub‐grouped by age
could elaborate on better assumptions.Climate 2020, 8, 40 5 of 10
Figure 2. Temperature–mortality relative risk functions for Nicosia, Cyprus, 2004–2014.
Tmax, Tmax[–3], Tmin, Tmin[–3], DTR, and DTR[–3] are shown in (a–f), respectively.
Further analysis focused on the Tmin of the current day and the weighted average of the
preceding three days (Tmin[–3]) by subgrouping the risk by gender and age groups. The variables
gender and age were related using GAM with these minimum temperatures and the results are
shown in Figures 3(a)(b). According to Figures 3a, b, cold temperatures impose a greater risk than
hot temperatures, but other factors such as respiratory epidemics, usually present in winter, made
unclear the exact role of temperatures on increased mortality.
On the other hand, high minimum temperatures and heatwaves were also associated with
increased mortality. Heat waves have gained more attention due to the urban warming attributed to
greenhouse gases and other anthropogenic sources. Other studies have shown that different cities
have different sensitivities to extremes in temperature and that the latitude and local climate are
factors to consider [14,22]. Air conditioning and human behavior can substantially modify the
adverse effects of high temperatures, but even in the hot city of Nicosia, where people are more
accustomed to higher temperatures and use air conditioning frequently, the effect of heat on health
showed increasing deaths during heat waves. Thus, adaptation should be readdressed and
governments should aim for adequate people awareness.Climate 2020, 8, 40 6 of 10
Figure 3. Mortality relative risk functions for Nicosia, Cyprus, 2007–2014 with (a) minimum
temperature of the same day (Tmin), (b) Weighted average minimum temperature of the
preceding three days (Tmin[–3]).
Figure 4 shows the relative risk of mortality for the DTR of the same day and the weighted
average DTR of the preceding three days. Kan et al. (2007) hypothesized that large diurnal
temperature change might be a source of additional environmental stress, leading to a greater risk
factor for death [17]. In contrast, our results showed a greater risk at DTR in the range of 6–8 °C, and
smaller risk at larger DTRs. Men and women aged 50–64 (magenta lines) were not affected by the
variations in DTR throughout the day or the preceding three days. Men 65 years and over had a
greater relative risk for DTR smaller than 5 °C, whereas for larger DTR, there was a negative relative
risk, showing that large DTR did not impose a risk factor for death in Nicosia. Overall, we found that
DTR was independently associated with daily mortality in Nicosia and that fluctuations in DTR
appeared to mostly affect people over 80, probably because they have reduced ability to regulate
body temperatures, thus making them marginally more vulnerable.Climate 2020, 8, 40 7 of 10
Figure 4. Mortality relative risk functions for Nicosia, Cyprus, 2007‐2014 with (a) DTR of
the same day, (b) Weighted average DTR of the preceding three days (DTR[–3]).
4. Discussion
The mortality risk by respiratory and circulatory causes for different age groups and per gender
in relation to temperature has been examined. We employed two regression techniques to evaluate
the impact of fixed and time‐dependent factors on the vulnerability to temperature–mortality
associations for 6882 deaths resulting from cardiovascular and respiratory causes between the years
2007 and 2014, in Nicosia, Cyprus. To model the relationship between temperature and mortality, we
used the generalized additive model (GAM) to assess the interaction between a variable and the
observation time and to interpret quantitative results. The GAM model revealed significantly
increased mortality on hot (no lag period) and cold days (with a lag of 3–4 days), agreeing with a
similar study in Estonia [4,9]. The adverse effects of heat on health are usually more direct with
increased mortality on the same day or a couple of days after a heatwave [2,10]. As proposed by
Curriero et al. [14], adaptation of populations to their local climate is evident by the increased health
risk in relation to cold temperatures in warmer climates and on the contrary in relation to high
temperature in colder climates. In warmer climates such as Nicosia, the people are more acclimatized
to high temperature conditions and therefore, a steeper increase of the relative risk of mortality in
colder conditions was observed.
The most important result to emerge from the analysis is that in the investigated area, the
threshold temperature was about 21 °C, supporting the assumption that people in the area are more
acclimatized to higher temperatures. MMT has been calculated in over 400 locations using the mean
daily temperatures showing values of 29–32 °C in the eastern Mediterranean region and over 23 °C
in the rest of the Mediterranean [15]. The probability risk of mortality using GAM revealed a stronger
relation with the minimum daily temperature, so future studies should focus on the investigation of
MMT using daily minimum temperatures. A similar GAM analysis in Shanghai [17] found smaller
relative risk for elderly people with values of 0.3, therefore in Nicosia, where the population is more
accustomed to higher temperatures, they are more vulnerable to lower temperatures with relative
risk up to 0.5.
Our cross‐correlation results agreed with previous studies where the effects of heat on mortality
rate shortly after temperatures start to increase, whereas the effects of cold may take longer to emerge,Climate 2020, 8, 40 8 of 10
and, depending on the latitude and the local climate, these periods may vary [2,9,23]. The results are
in complete agreement with previous studies [24], finding no difference in heat‐mortality risk
between men and women, and weak evidence of a higher association of cold‐mortality risk for men.
The results are also in line with a study in Nicosia and a study in Stockholm [11], which found a
difference in heat wave duration effects by age groups [2], while the increasing susceptibility to cold
temperatures in the elderly has not been shown before.
This study has not confirmed previous research on DTR. In fact, in contrast with what was
previously thought, we found that DTR does not have a noteworthy effect on mortality risk. This
serves to allow for more focused research on environmental stress factors and whether prolonged
duration of extreme heat or cold conditions is more important than within day variations of
temperature.
A limitation of this study is the poor correlation of indoor and outdoor temperatures due to a
number of modifying factors such as air conditioning, ventilation, and clothing. Time indoors affects
the individual’s exposure as well as workplace conditions and other comorbidities. Another
limitation is that we did not adjust the analysis for micro‐level socio‐economic or demographic
variables or other comorbidities that could have a potential confounding or modifying effect on the
mortality–temperature relationship.
5. Conclusions
The main concern of the paper was to examine the mortality risk in relation to high or low
temperatures of different age groups and compare them between the two genders. Mortality risk has
only been evaluated for respiratory and circulatory causes. Particular attention is paid to elderly
people, over 65 years old, as the results have shown a great vulnerability to ambient air temperature.
We have addressed not only minimum and maximum daily temperatures, but also the diurnal
temperature range (DTR) in order to examine the sensitivity for within the same day air temperature
variations.
The originality of our approach lies in the fact that we have combined the cross correlation
analysis to identify the effect of the preceding days’ temperature with the generalized additive model
(GAM) regression technique. From the research that has been performed, it is possible to conclude
that there was increased mortality on extremely hot and cold days. The effects of the heat had no lag
period, whereas cold effects had a lag effect of 3–4 days. The existence of these responses implies that
in warmer climates, people are more acclimatized to high temperatures, and therefore a higher
mortality risk was observed at colder temperatures with a lag of three days.
The approach used in this paper is applicable to several environmental areas such as air quality
analysis where the results may be subjective to a delay period and may slowly diminish human health
and well‐being. The results of this study should alert organizations and governments on the possible
impacts of climate change on public health by not considering adaptation. The identification of a
threshold temperature per latitude and local climate will assist in the evaluation of the adaptation
capacity of a specific population. This threshold temperature, according to our results, should be
calculated using the daily minimum temperature. Nevertheless, even if humans become fully
acclimatized to high temperatures, their health may still be negatively affected as a result of the
poorer air quality associated with extremely high temperatures [2,25].
On the basis of the promising findings presented in this paper, work on the remaining issues is
continuing to examine whether socio‐economic or demographic variables or other comorbidities
could have a potential confounding or modifying effect on the mortality–temperature relationship.
Acknowledgements: The authors are grateful to the Ministry of Agriculture, Rural Development,
and Environment (MADRE) of the Republic of Cyprus for the Department of Meteorology historical
meteorological data, and the Health Monitoring Unit of the Ministry of Health of Cyprus for the
mortality data. The ideas and opinions expressed herein are those of the authors. Endorsement of
these ideas and opinions by the Ministry of Health of Cyprus is not intended nor should it be inferred.Climate 2020, 8, 40 9 of 10
Author contributions: M.S. conceived the research topic. A.P. obtained the datasets, created the
figures, and analyzed the results. Both authors (A.P. and M.S.) contributed in the discussion of the
results and reviewed the manuscript.
Additional Information: The authors declare no conflicts of interest.
References
1. Hondula, D.M.; Balling, R.C.; Vanos, J.K.; Georgescu, M. Rising Temperatures, Human Health,
and the Role of Adaptation. Curr. Clim. Chang. Rep. 2015, 1, 144–154, doi:10.1007/s40641‐015‐
0016‐4
2. Pyrgou, A.; Santamouris, M. Increasing Probability of Heat‐Related Mortality in a
Mediterranean City Due to Urban Warming. Int. J. Environ. Res. Public Health 2018, 15, 1571,
doi:10.3390/ijerph15081571
3. Coffel, E.D.; Horton, R.M.; De Sherbinin, A. Temperature and humidity based projections of a
rapid rise in global heat stress exposure during the 21st century. Environ. Res. Lett. 2018, 13,
doi:10.1088/1748‐9326/aaa00e
4. Chen, R.; Yin, P.; Wang, L.; Liu, C.; Niu, Y.; Wang, W.; Jiang, Y.; Liu, Y.; Liu, J.; Qi, J.; et al.
Association between ambient temperature and mortality risk and burden: Time series study in
272 main Chinese cities. BMJ 2018, 363, doi:10.1136/bmj.k4306
5. Rocklöv, J.; Forsberg, B.; Ebi, K.; Bellander, T. Susceptibility to mortality related to temperature
and heat and cold wave duration in the population of Stockholm County, Sweden. Glob. Health
Action 2014, 7, 1–11, doi:10.3402/gha.v7.22737
6. Gronlund, C.J.; Berrocal, V.J.; White‐Newsome, J.L.; Conlon, K.C.; O’Neill, M.S. Vulnerability to
extreme heat by socio‐demographic characteristics and area green space among the elderly in
Michigan, 1990–2007. Environ. Res. 2015, doi:10.1016/j.envres.2014.08.042
7. Goggins, W.B.; Ren, C.; Ng, E.; Yang, C.; Chan, E.Y.Y. Effect modification of the association
between meteorological variables and mortality by urban climatic conditions in the tropical city
of Kaohsiung. Taiwan. Geospatial Health 2013, doi:10.4081/gh.2013.52
8. Milojevic, A.; Armstrong, B.G.; Gasparrini, A.; Bohnenstengel, S.I.; Barratt, B.; Wilkinson, P.
Methods to estimate acclimatization to urban heat island effects on heat‐and cold‐related
mortality. Environ. Health Perspect. 2016, 124, 1016–1022, doi:10.1289/ehp.1510109
9. Orru, H.; Åström, D.O. Increases in external cause mortality due to high and low temperatures:
Evidence from northeastern Europe. Int. J. Biometeorol. 2017, 61, 963–966, doi:10.1007/s00484‐016‐
1270‐4
10. Åström, D.O.; Åström, C.; Rekker, K.; Indermitte, E.; Orru, H. High summer temperatures and
mortality in Estonia. PLoS ONE 2016, 11, 1–10, doi:10.1371/journal.pone.0155045
11. Oudin Åström, D.; Tornevi, A.; Ebi, K.L.; Rocklöv, J.; Forsberg, B. Evolution of minimum
mortality temperature in Stockholm, Sweden, 1901–2009. Environ. Health Perspect. 2016, 124, 740–
744, doi:10.1289/ehp.1509692
12. Huynen, M.M.T.E.; Martens, P.; Schram, D.; Weijenberg, M.P.; Kunst, A.E. The impact of heat
waves and cold spells on mortality rates in the Dutch population. Environ. Health Perspect. 2001,
109, 463–470, doi:10.1289/ehp.01109463
13. Anderson, B.G.; Bell, M.L. Weather‐related mortality: How heat, cold, and heat waves affect
mortality in the United States. Epidemiology 2009, 20, 205. Available online:
http://www.pubmedcentral.nih.gov/articlerender.fcgi?artid=3366558&tool=pmcentrez&rendert
ype=abstract (accessed on 15th December 2019)
14. Curriero, F.C.; Heiner, K.S.; Samet, J.M.; Zeger, S.L.; Strug, L.; Patz, J.A. Temperature and
mortality in 11 cities of the eastern United States. Am. J. Epidemiol. 2002, doi:10.1093/aje/155.1.80
15. Yin, Q.; Wang, J.; Ren, Z.; Li, J.; Guo, Y. Mapping the increased minimum mortality temperatures
in the context of global climate change. Nat. Commun. 2019, 10, 4640, doi:10.1038/s41467‐019‐
12663‐yClimate 2020, 8, 40 10 of 10
16. Baccini, M.; Biggeri, A.; Accetta, G.; Kosatsky, T.; Katsouyanni, K.; Analitis, A.; Anderson, H.R.;
Bisanti, L.; D’Ippoliti, D.; Danova, J.; et al. Heat effects on mortality in 15 European cities.
Epidemiology 2008, doi:10.1097/EDE.0b013e318176bfcd
17. Kan, H.; London, S.J.; Chen, H.; Song, G.; Chen, G.; Jiang, L.; Zhao, N.; Zhang, Y.; Chen, B.
Diurnal temperature range and daily mortality in Shanghai, China. Environ. Res. 2007, 103, 424–
431, doi:10.1016/j.envres.2006.11.009
18. Republic of Cyprus. Department of Meteorology, Cyprus. Available online:
http://www.moa.gov.cy/moa/ms/ms.nsf/DMLannual_en/DMLannual_en?OpenDocument
(accessed on 25th April 2019)
19. Peel, M.C.; Finlayson, B.L.; McMahon, T.A. Updated world map of the Koppen‐Geiger climate
classification. Hydrol. Earth Syst. Sci. 2007, 11, 1633–1644.
20. Pyrgou, A.; Santamouris, M.; Livada, I. Spatiotemporal Analysis of Diurnal Temperature Range:
Effect of Urbanization, Cloud Cover, Solar Radiation, and Precipitation. Climate 2019, 7, 89,
doi:10.3390/cli7070089
21. Wood, S. Mgcv: Mixed GAM Computation Vehicle with Automatic Smoothness Estimation.
Available at: https://cran.r‐project.org/web/packages/mgcv/index.html (accessed on 20th
October 2019); doi:10.1007/s10853‐011‐5868‐y
22. Braga, A.L.F.; Zanobetti, A.; Schwartz, J. The effect of weather on respiratory and cardiovascular
deaths in 12 U.S. cities. Environ. Health Perspect. 2002, 110, 859–863, doi:10.1289/ehp.02110859
23. Brooke Anderson, G.; Bell, M.L. Heat waves in the United States: Mortality risk during heat
waves and effect modification by heat wave characteristics in 43 U.S. communities. Environ.
Health Perspect. 2011, 119, 210–218, doi:10.1289/ehp.1002313
24. Son, J.‐Y.; Liu, J.C.; Bell, M.L. Temperature‐related mortality: a systematic review and
investigation of effect modifiers. Environ. Res. Lett. 2019, 14, 073004, doi:10.1088/1748‐
9326/ab1cdb
25. Pyrgou, A.; Hadjinicolaou, P.; Santamouris, M. Enhanced near‐surface ozone under heatwave
conditions in a Mediterranean island. Sci. Rep. 2018, 8, 9191, doi:10.1038/s41598‐018‐27590‐z
© 2020 by the authors. Licensee MDPI, Basel, Switzerland. This article is an open access
article distributed under the terms and conditions of the Creative Commons Attribution
(CC BY) license (http://creativecommons.org/licenses/by/4.0/).You can also read