FIRE WEATHER Heat, dryness, and wind are driving wildfires in the Western U.S - August 25, 2021 Research brief by Climate Central - Climate Matters
←
→
Page content transcription
If your browser does not render page correctly, please read the page content below
FIRE WEATHER
Heat, dryness, and wind
are driving wildfires
in the Western U.S.

August 25, 2021

Research brief by
Climate Central

                          1
FIRE WEATHER
Heat, dryness, and wind are driving wildfires in the Western U.S.
INTRODUCTION
Climate change is worsening wildfires across forested land and lengthening wildfire seasons in the Western United States.
Warming from heat-trapping pollution is drying out forests, grasslands and other landscapes, increasing the likelihood that
destructive fires will erupt and spread. And warming is also affecting day-to-day weather in ways that this analysis shows are
increasing the frequency of fire weather days.
To explore changes in weather conditions that increase the spread of fire, Climate Central analyzed data from weather
stations in 225 locations across 17 states going back to 1973. This review of historical trends in fire weather—a combination
of high heat, low humidity, and strong winds—aims to investigate how climate change is affecting wildfire risk throughout
the American West.
Long-term warming trends lead to accelerated
evaporation from soils and plants, creating drier
conditions. Our analysis of the U.S. West shows
that this drying has been driving increases in the
frequency of fire weather days, affecting states
from the Pacific Coast to the western Great Plains
and from the Canadian to the Mexican borders. In
addition to increasing the risk of fire to communities
throughout these states, these extreme conditions
are also causing problems even when fires don’t
ignite. In response to high-risk fire weather
conditions, and in the hopes of avoiding equipment-
related ignitions, power companies are shutting off
electricity to millions of people, creating health risks
to those who depend on power for refrigeration of
medications and to stay cool during heat waves.
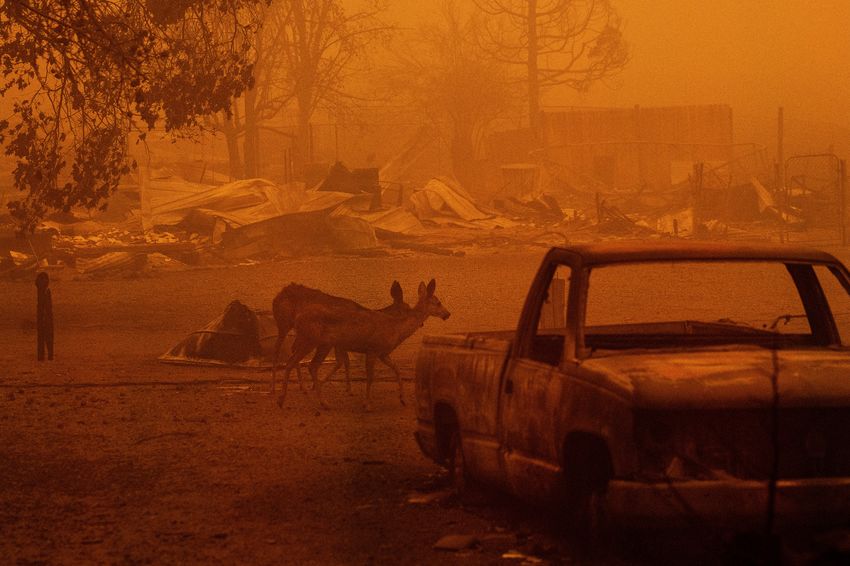
Cover photo: AP Photo/Noah Berger
2WHAT IS ‘FIRE WEATHER?’
Three factors influence fire behavior: weather, fuels, and topography. Changes to the weather element can affect fire
behavior and increase fire risks, regardless of the nature of the fuels present or the natural contours of the land.
Fire weather generally refers to meteorological conditions that promote the spread of wildfires, although definitions of fire
weather can vary. Variables such as temperature, relative humidity, wind, precipitation, and atmospheric instability all affect
fire behavior. This analysis focuses on three meteorological elements fundamental to fire weather—temperature, relative
humidity, and wind. When these three elements converge in particular ways, the stage is set for wildfire growth.
Relative humidity is a measure of how close the
air is to being saturated by water vapor. When WHAT ELSE IS FUELING
humidity levels are very low, the air feels dry and it MODERN WILDFIRES?
sucks moisture from the land, leaving vegetation
dry and prone to burning. As temperature
Fire weather is an important factor for wildfire, but it’s just one
increases, relative humidity decreases. Our
part of the story. Humans play a key role in influencing the amount
analysis shows decreasing relative humidity has
of fuel available. We also play a role in igniting fires through a
been a major factor in boosting the number
variety of activities. Additional human-induced forces include:
of days each year of wildfire weather for many
locations. Thresholds at which low relative
• The legacy of generations of firefighting efforts and the loss
humidity can drive fire weather vary depending
of indigenous approaches to land management have both led
upon fuel types and local climate. (See more
to buildups of fuels in places where fire was always a natural
details on relative humidity in the sidebar on page 9).
part of the environment.
Hotter temperatures affect humidity and
• The arrival and spread of invasive grasses and other exotic
dryness and they also have a direct influence on
species are creating more combustible and fire-prone
fire behavior, heating the fuels and making them
environments.
more likely to ignite.
• The ongoing urbanization of forests, forest edges and other
Wind is critical for several reasons. Wind supplies
areas where fires are prone to burn puts more residents in
oxygen to a fire, which leads to the fire burning
harm’s way and forces firefighting agencies to allocate greater
more rapidly. It also increases evaporation,
resources toward protecting homes.
helping to dry out the land which provides
more fuel for the fire. Wind also carries embers,
• Urban development causes more wildfire ignitions. Discarded
which help a fire spread. Changes in wind speed
cigarettes, sparks from cars, fireworks, and other human
or direction can cause a fire to shift, and can
activities can start fires at times of year when lightning is
increase the rate of spread and intensity of the fire.
uncommon and fires would naturally be rare.
To be considered a fire weather day, these three
• Rising temperatures contribute to tree mortality caused by
elements must co-occur at or above certain
beetles, causing a buildup of dead trees that some scientists
levels, producing dangerous weather conditions
worry will lead to larger and worse wildfires.
that increase the risk of wildfire. While the
critical relative humidity values for fire weather
• As firefighting agencies try to respond to larger and more
vary across the country, our analysis shows
numerous fires, their resources are being stretched thin,
decreasing relative humidity has been a major
forcing them to make difficult decisions about responding to
factor in boosting the number of days each year
some fires while allowing others to burn unchecked.
of wildfire weather for many locations.
3Figure 1. What’s driving increases in fire weather?
TEMPERATURE DRYNESS WIND SPEED
>= 45˚- 55˚F Meets local thresholds >= 15 Mph
Change in % of annual days variable met or exceeded threshold, 1973 to 2020
-26 -20 -10 -5 -1 +1 +5 +10 +20 +26
Insu�cient data/stations
Source: NOAA/NCEI’s Local Climatological Data, Climate Central analysis
When temperature, low relative humidity, and wind converge in particular ways, they set the stage for rapid wildfire growth.
Climate change is driving an increase in days when temperatures and low relative humidity reach dangerous thresholds.
4CLIMATE CENTRAL FINDINGS:
FIRE WEATHER TRENDS
As explained in the methodology section of this report, Climate Central analyzed data from individual weather stations and
then aggregated them by climate division when possible. These climate divisions are defined by the National Oceanic and
Atmospheric Administration (NOAA).
The analysis shows strong increases since the 1970s in both the total number of annual fire weather days and in the
percentage increases in the number of fire weather days experienced every year. These results are consistent with findings
from previously published research.
Parts of New Mexico, Texas, and Southern California have experienced some of the greatest increases in fire weather days
each year, with parts of New Mexico now seeing two more months of fire weather than was the case nearly a half century
ago. Some of the climate divisions in Texas, California, Oregon, and Washington are experiencing fire weather more than
twice as often now than in the early 1970s.
Increases in fire weather days were higher in the interior regions compared to coastal regions. Living along the coast typically
means higher humidity levels, so it’s harder for these areas to reach the low relative humidity threshold used in the analysis.
While there are still relatively few days per year when the fire weather conditions occur in these coastal areas, the analysis
shows an increase in these conditions over time (see maps on pages 7 & 8).
By contrast, some parts of North Dakota, South Dakota, Kansas, and Nebraska experienced a decline in the frequency of fire
weather days. This is part of a region where springs and summers have been cooling slightly while much of the rest of the
country and world has been warming. This cooling is expected to be temporary and may be influenced by the cooling effects
of agricultural development, crop irrigation, and natural variation.
This analysis is intended to provide a greater understanding of the role that changes in day-to-day weather are playing in
wildfire risks through the American West. Warming and drying trends are also altering the dryness, flammability, and other
conditions of vegetation that promote larger and more intense wildfires.
MORE FIRE FUNDAMENTALS AND RESOURCES
When the wind is blowing hot, dry air, it’s fire weather, which affects fire ignition, behavior and suppression. While 80% of
wildfires are started by humans, there are also a number of other elements that can raise the risk and danger of fire:
• Dry lightning is cloud-to-ground lightning without any accompanying rainfall nearby and is the lightning type most
likely to cause wildland fires.
• Fuels are any combustible material that can feed a fire, including grass, leaves, ground litter, plants, shrubs, trees and
other vegetation.
• Topography can cause dramatic shifts in fire behavior. Slope steepness and direction, elevation, barriers, and land
configuration all play a role.
• Climate change is a major contributor to the severe and persistent droughts in southwestern North America in
recent decades.
You can find daily fire reports at the National Interagency Fire Center. There are fire and smoke maps at AirNow, the
San Francisco Chronicle CA Fire Map and the California Smoke Information Map. The weekly U.S. Drought Monitor map
shows parts of the U.S. that are in varying levels of drought. The National Wildfire Coordinating Group has a glossary of
wildfire terms. And check out the Society for Professional Journalists’ toolbox on covering fires.
5Figure 2. Fire weather trends in Western U.S. climate divisions (1973-2020)
Top 10 Fire weather annual average days
1 Nevada - 95 6 New Mexico - 72
CD4 - Extreme Southern (Las Vegas) CD5 - Central Valley (Albuquerque)
2 Nevada - 93 7 New Mexico - 70
CD3 - South Central (Tonopah, Goldfield) CD7 - Southeast Plains (Roswell, Carlsbad)
3 California - 85 8 New Mexico - 70
CD7 - Southeast Desert (Palm Springs) CD3 - Northeast Plains (Mosquero, Clayton)
4 New Mexico - 74 9 New Mexico - 68
CD2 - Northern Mountains (Santa Fe, Taos) CD1 - Northwest Plateau (Gallup, Aztec)
5 Utah - 74 10 Wyoming - 68
CD4 - South Central (Beaver, Kanab) CD3 - Green & Bear Drainage (Evanston, Kemmerer)
Top 10 Increase in Total Fire Weather Days (# of days)
1 New Mexico - 60 6 Nevada - 55
CD2 - Northern Mountains (Santa Fe, Taos) CD3 - South Central (Tonopah, Goldfield)
2 New Mexico - 59 7 Arizona - 51
CD1 - Northwest Plateau (Gallup, Aztec) CD7 - Southeast (Tucson)
3 California - 59 8 Arizona - 43
CD7 - Southeast Desert (Palm Springs, San Bernardino) CD2 - Northeast (Flagstaff, Holbrook)
4 Texas - 56 9 Colorado - 43
CD5 - Trans Pecos (El Paso) CD1 - Arkansas Drainage (Colorado Springs, Pueblo)
5 New Mexico - 55 10 Colorado - 42
CD3 - Northeast Plains (Mosquero, Clayton) CD5 - Rio Grande Drainage Basin (Alamosa, Del Norte)
Top 10 Increase in fire weather days (% change)
1 Texas - 284 6 Idaho - 173
CD9 - Southern (Laredo, Asherton) CD5 - Southwestern Valleys (Boise)
2 California - 269 7 California - 173
CD5 - San Joaquin (Bakersfield, Merced) CD2 - Sacramento Drainage (Sacramento, Paradise)
3 Oregon - 253 8 Oklahoma - 169
CD1 - Coastal area (Astoria, Gold Beach) CD7 - Southwest (Hollis, Mountain View)
4 Washington - 236 9 Colorado - 161
CD9 - Northeastern (Spokane) CD4 - Platte Drainage Basin (Denver, Boulder, Ft. Collins)
5 Arizona - 186 10 Utah - 158
CD6 - South Central (Phoenix, Scottsdale) CD1 - Western (Knolls, Lakeside)
Source: NOAA/NCEI’s Local Climatological Data, Climate Central analysis
6Figure 3. Fire weather season is lengthening across the West
Change in annual �re weather days 1973-2020 (% change)
-200 -100 -50 0 +50 +100 +200
Insu�cient data/stations
Source: NOAA/NCEI’s Local Climatological Data, Climate Central analysis
7Figure 4. Fire weather days are increasing across the West
Change in annual �re weather days 1973-2020 (total # days)
-60 -56 -28 -14 -7 0 +7 +14 +28 +56 +60
Insu�cient data/stations
Source: NOAA/NCEI’s Local Climatological Data, Climate Central analysis
8WHY DOES FIRE WEATHER MATTER?
As wildfire weather becomes more prevalent, there are more days when extreme conditions can blow small blazes up into
big ones or fuel the continued growth of large wildfires. That’s creating greater risks to public health, property, and local
and regional economies from flames and smoke. Smoke is a dangerous pollutant that can contribute to a variety of health
problems, increasing susceptibility to asthma and asthma attacks. It can also make one more susceptible to influenza and
other viruses like COVID-19, and poses especially high risks to those with other health problems, particularly among seniors
and others with weakened lung health. And fire weather conditions restrict firefighters’ ability to put out existing wildfires.
With climate change, nights have warmed significantly, even more so than days. This has decreased the overnight relative
humidity that once helped firefighters gain control over wildfires.
Wildfire weather days are a new challenge for utilities
who are laboring to keep up with record power HOW SCIENTISTS MEASURE
demand during heat waves. California utilities have DRY CONDITIONS FOR RISK OF FIRE
started shutting down parts of their electrical grids
during periods of fire weather to reduce the risks As the air warms, more water vapor is required before the air
that their power lines will ignite fires during those reaches saturation. Effectively, this means warmer air holds
dangerous times. For decades, utilities have paid more water, allowing more rain and snow to fall.
compensation to victims of such fires, and this
was regarded as a cost of their approach to doing But in an arid climate like the Western United States, there is
business. But the sheer size and magnitude of the limited ground moisture to evaporate into the atmosphere.
damage caused by fires in recent years has increased As a result, warming temperatures are drying out the air.
compensation costs to levels that bankrupted the Scientists are now calling these conditions “hot droughts.”
Northern California utility Pacific Gas & Electric This low relative humidity accelerates evaporation from
Corporation. Consequently, policy changes have now vegetation already in place, like leaves, brush, or dead trees,
resulted in frequent rolling blackouts across large increasing the risk of intense fires.
parts of the state.
Relative humidity (RH) is a measure of how close air is to
Research led by scientists at the University of saturation, expressed as a percentage--it’s the ratio of the
California in Merced and published last year showed amount of moisture in the air to the amount of moisture
that the daily power needs for 12 million people were needed to saturate the air. Relative humidity is lowest during
unavailable in Northern California in 2019 because of the afternoon when air temperatures are highest. The Storm
these public safety power shutoffs” (PSPSs). PSPSs Prediction Center (SPC) defines regional relative humidity
had an estimated economic impact of around $10 thresholds for fire weather based on local climate.
billion. Reducing these impacts at a time of escalating
fire dangers could involve replacing long-distance Vapor pressure deficit (VPD) is another way to monitor
power transmission with localized grids comprised of surface dryness, or aridity. The more water vapor in the air,
renewable energy generators and advanced battery the greater the pressure (i.e. vapor pressure) it exerts at
systems. PG&E recently proposed spending upward of the surface. The greater the difference between the vapor
$15 billion burying overhead power lines. pressure and the vapor pressure at saturation, the greater
the evaporation potential from the ground. As VPD increases
There are solutions to mitigating risk in the face (meaning the air is further away from saturation), plants must
of longer and more extreme wildfire seasons. draw more moisture from their roots, which can lead to the
These include increased use of land management plants drying out or dying. Like relative humidity, VPD has
techniques that eliminate excessive fuels, such as been linked to burned forest areas in the Western
prescribed burns, forest thinning to remove young United States.
trees and bushes, and allowing small fires to burn
themselves out when it’s safe to do so.
The above steps would help adapt western regions in the United States to the dangers of increasing fire-weather conditions.
Adaptation is a short-term and expensive solution. In the long-term, fire weather conditions will increase around the world as
the planet warms. Reducing carbon pollution to net zero by 2050 by aggressively switching away from fossil fuels would limit
global warming and stabilize climate conditions.
9METHODOLOGY
This study defines a fire weather day as one where the following three conditions are met in the same hour at least twice in
one calendar day::
RH: Within 5% of TEMP: >= 45°-55°F SUSTAINED WIND:
regional thresholds depending on season >= 15mph
Definitions of a “fire weather day” vary from one place to the next. For our analysis we selected thresholds based on (although
not exactly the same as) criteria from NOAA’s Storm Prediction Center for an elevated fire weather forecast, which is the
lowest risk category they use. Additionally, our thresholds are consistent with criteria used by various western utility companies
for a Public Safety Power Shutoff (PSPS), including PG&E and Pacific Power as well as in research like Abatzoglou et al. 2020.
Our criteria was chosen in order to identify not only the days we could expect a fire to break out but days where the combined
meteorological conditions pose a threat to people and infrastructure. Our analysis is based on criteria that uses relative
humidity to represent the amount of moisture in the air. Scientists are also moving towards using vapor pressure deficit (VPD)
as another method for measuring atmospheric moisture.
This analysis defines a “fire weather day” as one where the temperature, relative humidity, and wind speed all meet or exceed
the following criteria in at least two hourly measurements:
• Relative humidity within 5% of regional thresholds defined by NOAA’s Storm Prediction Center (based on predominant fuel
type and local climate)
• Temperature at least 45-55°F, depending on the season (winter: 45°F; summer: 55°F; spring and fall: 50°F)
• Sustained wind speeds of 15 mph or greater
Using hourly observations from NOAA/NCEI’s Local Climatological Data (LCD) dataset, we selected weather stations in the
western half of the contiguous United States that met the following conditions:
• At least 40 years of data, beginning in 1973 (which is the start of the period of record for most stations in the LCD dataset).
• Each year must have data for at least 50% of the days, and a daily average of at least 12 hours of data with at least 4 of
those hours occurring between noon and 6 pm (this is around the time we see maximum temperature, minimum relative
humidity, and high wind speeds). Since our analysis spans many states, this is a general range. The actual time of day that is
the hottest, driest, and windiest will depend on your location.
• Had no more than four years missing in either the first (1973-1982) or last decade (2011-2020) of the analysis as data at
the end of time series have a larger impact on the overall trend).
• An average of at least one fire weather day per year.
We mapped our results to each station’s NOAA climate division. For climate divisions with multiple stations, we averaged the
annual fire weather days across these stations. For each climate division, we used linear regression to calculate the total change
and percent change in average annual fire days from 1973 to 2020. Some climate divisions only had one weather station inside
its boundary. While confidence in our results increase with additional stations, our results are consistent with recent findings (for
example, here and here).
Climate Central would like to thank John Abatzoglou, Associate Professor, University of California, Merced and Daniel Swain,
Climate Scientist at the Institute of the Environment and Sustainability at University of California, Los Angeles and The Nature
Conservancy. Their thoughtful comments and guidance in the research process were invaluable to this report.
10You can also read