Muon telescope: An experimental observation of leptonbased on coincidence technique - Inspire HEP
←
→
Page content transcription
If your browser does not render page correctly, please read the page content below

Journal of Physics: Conference Series

PAPER • OPEN ACCESS

Muon telescope: An experimental observation of leptonbased on
coincidence technique
To cite this article: Sonali Bhatnagar 2021 J. Phys.: Conf. Ser. 1804 012150

View the article online for updates and enhancements.

                              This content was downloaded from IP address 131.169.5.251 on 06/03/2021 at 16:57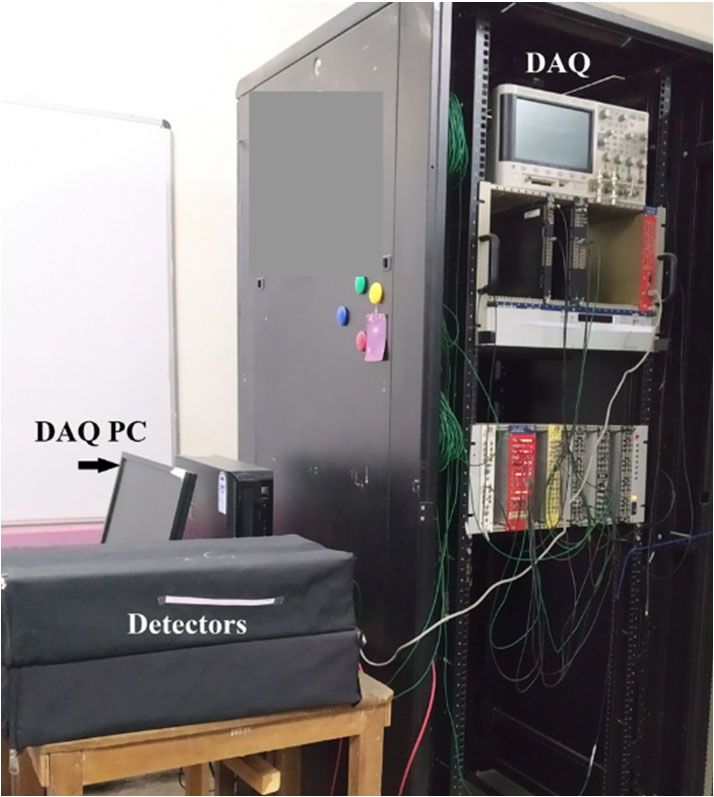
ICMAICT 2020                                                                                                    IOP Publishing
Journal of Physics: Conference Series                         1804 (2021) 012150          doi:10.1088/1742-6596/1804/1/012150

 Muon telescope: An experimental observation of leptonbased on
 coincidence technique

                            Sonali Bhatnagar1,
                        1
                            Assistant Professor, Department of Physics and Computer Science, Faculty of Science,
                            DayalbaghEducational Institute, Agra,U.P.

                        sonalibhatnagar@dei.ac.in

                            Abstract.Cosmic rays are high energy radiation originating in the cosmos, consisting of
                            nucleonic fragments that rain down on the earth from outside the solar system in the form of
                            Extensive Air Shower (EAS). There are several secondaries generated in these showers. The
                            most common fundamental particles to reach the Earth’s surface are muons, electrons, neutrinos,
                            and gamma rays. The easiest way to extract information from these particles is by keeping the
                            detector on earth’s surface. By requiring coincidence in several detectors, background radiation
                            will automatically be sorted out. A muon telescope consisting of two polystyrene plastic
                            scintillation detectors has been set up in our laboratory. In this paper, secondary flux has been
                            observed by increasing the distance between the detectors, horizontally as well as vertically.
                            This study has been extended for observing the flux on keeping the detector inside, outside and
                            on the top (4.5 meters) of the laboratory building. Horizontal separation, vertical separation,
                            data inside, outside and at the roof of the laboratory building, are five measurements performed
                            using Muon Telescope at constant threshold of discriminator. In this process, one detector was
                            kept at the fixed position and the other detector has been moved with respect to the first one.
                            SEASA (Stockholm Educational Air Shower Array) in Alba Nova Physics Centre in Stockholm,
                            has performed this detector separation study with three detectors and it has been observed that
                            the count rate decreases with the separation between the detectors because the telescope loses
                            the sensitivity to lower energy shower.

                            Keywords—Cosmic rays, Count rate, Muon Telescope, Detector.
       1.Introduction
       Cosmic rays are basicallyhigh energetic particle which travels to us from our galaxy and outer galaxy
       but their actual source of origin is a question mark. It consists of proton, pion, kaon, muon, electron,
       positron, gamma rays and neutrinos. The detectable cosmic rays begin at energies of about 1 GeV. The
       highest energy cosmic ray so far detected had energy of 51J [1]. Cosmic ray energy spectrum can be
       explained by power-law with a detectable steepening at a little below 1016 eV called knee and a
       flattening above 1018 eV called ankle as shown in figure 1.

              Content from this work may be used under the terms of the Creative Commons Attribution 3.0 licence. Any further distribution
              of this work must maintain attribution to the author(s) and the title of the work, journal citation and DOI.
Published under licence by IOP Publishing Ltd                          1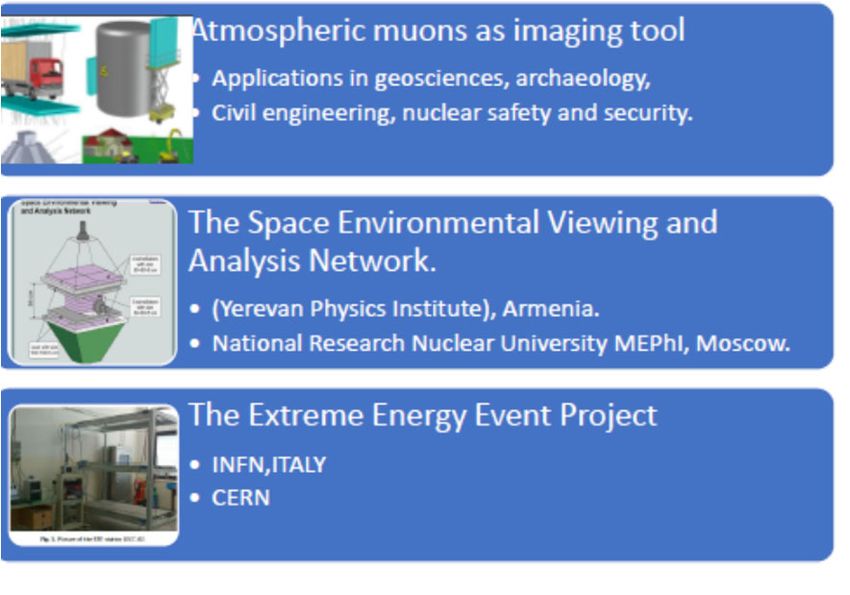
ICMAICT 2020                                                                                      IOP Publishing
Journal of Physics: Conference Series               1804 (2021) 012150      doi:10.1088/1742-6596/1804/1/012150

                                     Figure 1: Cosmic Ray Energy Spectrum [2].

        The power-law form is believed to be the result from cosmic ray acceleration processes involving
     progressive acceleration in magnetic fields such as in supernova shells and astrophysical wave shock.
     High energy cosmic rays interact with Earth's atmosphere and produce a shower of secondary particles
     in which many particles are produced from a single primary particle but because of coulomb scattering
     and momentum distribution, these secondary particles deviate from their track. This shower is called
     Extensive Air Shower (EAS) or cosmic ray showers.
          Interaction of primary particle with the atmospheric nuclei produce pions (charged and neutral) and
     the charged pions interact again and decay into muons, as muon is weakly interactingparticle, so it usually
     continues its path to the sea level. Neutral pions immediately decay into pairs of gamma-rays which
     initiate the electromagnetic shower and produce electrons and positrons by bremsstrahlung process and
     further produce gamma-rays [3]. The electromagnetic shower develops until the energy losses due to
     photoelectric and ionization becomes dominant. At sea, there are mainly three components: first, the
     muon component which is a highly penetrating particle and produced in the atmosphere; second, the
     electromagnetic component in which electrons, positrons and gamma-rays are produced; and third is a
     hadronic component [4]. These particles are directly associated with the primary particle of cosmic
     shower. Many muons are produced by quite low energy primary particles whose electromagnetic
     components die in the atmosphere. The result is that there is a large ground level flux [5]. Their flux at
     sea level is about one particle per square cm per minute. The sum of the total energy deposited by the
     total number of particles in a shower is approximately equal to the energy of the primary particle which
     can be expressed in GeV. A single primary particle of shower involves approximately 10 billion of
     particles. These numbers of particles are then spread across an area of km2[6]. Primary cosmic rays
     interact with the atmosphere so no primary cosmic rays can be detected on the earth’s surface. To detect
     the primary before the interaction takes place, the satellite and balloon experiments have been used. This
     is called direct detection method. At the ground level these particles are detected using large detector
     arrays and these arrays detect many secondary particles at the same time. For this mainly two methods
     are used,the detection of air fluorescence, in which charged particles in the shower cause excitation
     (ionization) of air molecules which emit light of a characteristic wavelength. The intensity of
     fluorescence gives information about the primary energy. This method is used to locate the shower
     energy and the type of the primary particle.
        The other method is detection of muons, electrons and photons using scintillation detectors.From this
     secondaries particle’s data is collected and that data is used to reconstruct the primary parameters. These
     are called indirect detection methods because in these methods the primary particles have not been
     detected directly but by the reconstruction. Muon telescope is the base of many advanced studies

                                                          2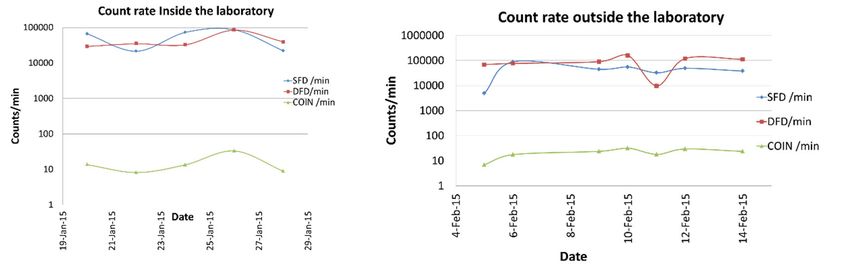
ICMAICT 2020                                                                                                           IOP Publishing
Journal of Physics: Conference Series                                       1804 (2021) 012150   doi:10.1088/1742-6596/1804/1/012150

   effecting our lives. The outline of its applications has been summarized in the Figure 2.
                                                Galactic Cosmic
                                                 ray transport
                                                in heliosphere.

                                                                  BATATA( Muon
                           Estimation of
                                                                   track study in
                            intracloud
                                                                       buried
                           electric field
                                                                     telescope)

                                               Muon Telescope
                                                  studies

                              Muon                                   Muon
                           radiography                              metrology

                                                    Muon
                                                 tomography

                                            Figure 2.Applications of muon telescope to real life.
       The galactic cosmic ray solar diurnal anisotropy data from the Nagoya muon telescope made way to
   calculate the detail parameters of particle rigidities through interplanetary magnetic fields. Another
   important application of muon’s absorption or scattering results in imaging methods. The muon detector
   measures its incoming flux, whereas absorption-based muon radiography depends on the rate of muon
   absorbed by a given target along the given direction. Two- and three-dimensional imaging is done along
   with Monte carlo simulation. In fact, the author has recently completed calculations of high energy
   muons with the nuclear waste containers in our country [7].The muons from cosmic rays have several
   applications, are a forever source with no radiological side effects, identified on some known detectors
   and being studied for a long period in Astroparticle physics. The following figure 3 outlines some very
   interesting experimental studies involving the muon detectors. The first diagram [8] describesmuon
   radiography explained in different scenarios as a cargo check, nuclear radiation check, underground
   digging and open structurescanning’s.The SEVAN resembles our muon telescope in detector
   specifications, is using the time series of count rates to observe effects of electric fielddisturbances [9].

                                                        Figure 3: Muon telescopes at work.
       In the above figure, the EEE Collaboration is studying the EAS using muon telescopes of resistive
      plate chambers [10]. They are studying solar flares and its correlation to muons from EAS. In our
   telescope the detector is plastic scintillator. Scintillation detectors are used due to its quality to convert
        the kinetic energy of the charged particle into a detectable light pulse of withlarge scintillation
   efficiency and good optical quality [11]. For these studies organic scintillators are used over inorganic
    scintillators due to their fast response time and cheap price.In inorganic scintillators, the scintillation
     arises due to the structure of the crystal lattice. But in organic scintillators, scintillations arise from

                                                                                    3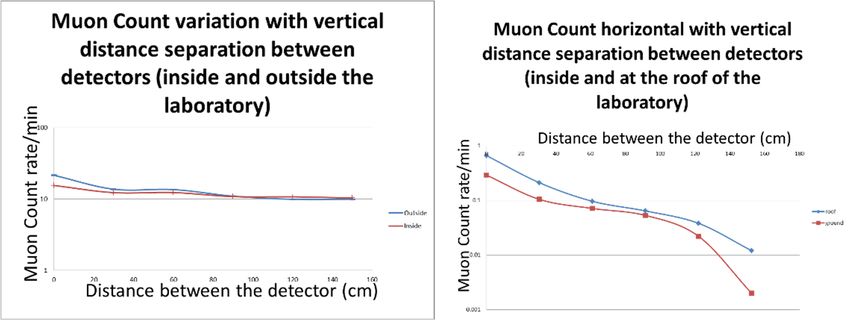
ICMAICT 2020                                                                                         IOP Publishing
Journal of Physics: Conference Series                 1804 (2021) 012150       doi:10.1088/1742-6596/1804/1/012150

   transitions in the energy levels by a single molecule so from there the fluorescence can be observed [5].

                          Figure 4: Energy Level Diagram for the Organic Scintillators [5].
    Figure4 shows the energy level diagram for the organic scintillators. As observed in the figure, the
   energy from a charged particle is absorbed by the electron which jumps into the various excited states;
   the singlet states which has spin 0 are labeled as S1, S2, S3, the spacing between ground state S0 and S1
   is 3 - 4 eV for organic scintillators and this space goes on decreasing on going to S1-S2, S2-S3 and so
   on. Each of the S levels is subdivided into a series of levels with much finer structure that shows the
   vibrational states of molecules. The spacing between these series is typically 0.15 eV. S2, S3 etc. are
   considered as higher states and from here the molecule de-excite in (psec) to the S1 state. States S11, S12
   have extra vibrational energy so these states are not in thermal equilibrium hence from thesestates the
   molecule loses its energy very quickly. Scintillation light, prompt fluorescence is emitted in transitions
   between S10 and the ground state. Fluorescence decay time in organic scintillators is of the order of
   nsec, leading to a fast response time of organic scintillators [12]. Transition from T1 to S0 gives the
   phosphorescence which is also known as delayed light emission and wavelength of the phosphorescence
   is larger than the fluorescence. When the charged particle hits the detector, it excites the electron of the
   material and these electrons emit energy in the form of photon which are in UV (10 nm to 400 nm)
   range. This can be seen from our eyes on holding the scintillator slab in our hand and observe it from
   its edges, it will be in blue colorbecause of production of scintillation by the charged particle passing
   through it. Once this photon is created it is randomly oriented and may or may not move towards the
   photo-multiplier tube (PMT) [13]. To catch the maximum number of photons,wavelength shifting fibers
   are used which not only catch the photon but also shift the wavelength of the absorbed photons to the
   wavelength for which the PMT has the maximum efficiency. The plastic scintillator is being polished
   and wrapped in black Tyvek sheet so that no unwanted photon (from the background) can enter the
   system.

   2.Experimetal setup and methodology
   Muon Telescope (μT) has been setup in Nuclear Electronics laboratory, Dayalbagh Educational Institute,
   Agra with latitude of 27.1767° N and longitude of 78.0081° E at an altitude of 171 m. It consists of two
   plastic scintillation detectors of dimensions 23.5x24x2 cm3, which has been kept together and with the
   help of coincidence technique muons are being filtered from its background. These scintillators are
   connected to the photo-multiplier tubes (PMT) via light guides and generate electronic pulses which are
   being measured using NIM (Nuclear Instrumentation Module) electronics. The signal from PMT, goes
   into discriminator (Phillips Scientific, model 704, Quad 300 MHz) which setup a threshold for that signal
   and convert the analog pulse into digital pulse. Figure 5 is showing the analog pulse from the PMT and
   its corresponding pulse from the discriminator after getting converted into digital pulse. The amplitude
   of the pulse coming from double fiber detector is ~250 mV and from the single fiber detector it is of
   ~220 mV.Discriminators threshold is fixed at the value -150 mV which convertsthe analog pulse into
   digital pulse with the pulse width of 60 nsec. After getting converted into digital pulse, the signal is wired
   to the logic unit (Phillips Scientific, model 756, Quad Four – Fold),using AND logic a coincidence
   between the detector within 60 nsec is produced. Whenever a particle will pass through both the detectors
   within 60 nsec the system will trigger,and the coincidence count increments. From the discriminator and
   logic unit the counts are observed,feeding their output into the scalar (CAEN, Model N1145, Quad Scalar

                                                            4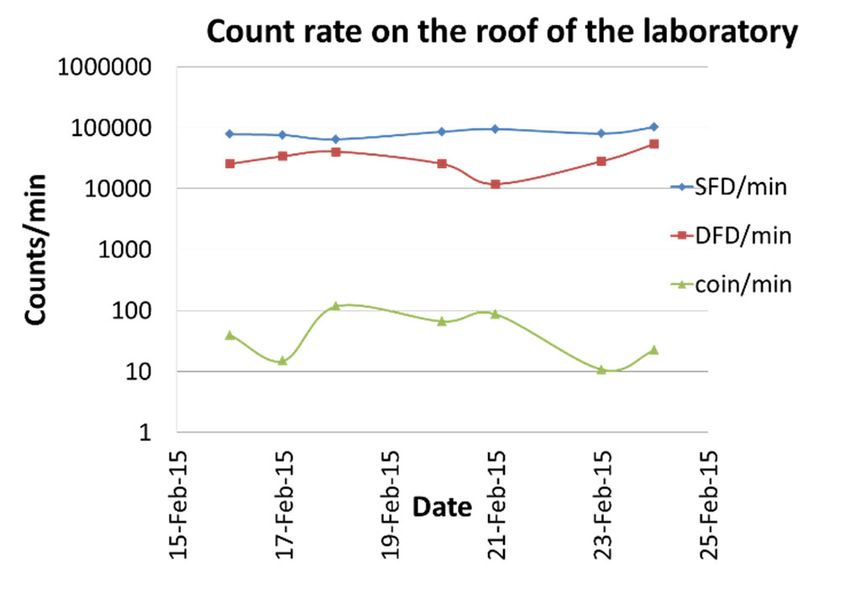
ICMAICT 2020                                                                                        IOP Publishing
Journal of Physics: Conference Series                1804 (2021) 012150       doi:10.1088/1742-6596/1804/1/012150

      andPreset Counter/Timer). The coincidence counts are mostly muons because only muon has the
      property to penetrate through both the detectors without getting absorbed. Figure 6 shows the muon
      telescope setup in our laboratory, in which on the left side there are two detectors (wrapped in black
      cover) one above the other and right side shows the Data Acquisition System (Nuclear Instrumentation
      Modules electronics). This muon system detects coincidence for every 5-minute interval.

           Figure 5 Double Fiber Detector Pulse and single fiber detector pulse from PMT and Discriminator.

                        Figure 6:Data Acquisition System in Nuclear Electronics Laboratory
          For a better understanding, variation of cosmic muon flux has been analyzed with increasing the
      distance between the detectors, horizontally as well as vertically and by placing the telescope inside,
      outside and on the top (4.5 meter) of the laboratory building. As a solar timevariation, the cosmic ray
      daily variation is often being referred to as a local time phenomenon. It is not possible to assume the
      same variation in all altitude regions as besides a diurnal variation the pressure displays a semidiurnal
      wave as well as still harmonics dependence on the climate region concerned. The data is being analyzed
      from 2016. The earlier studies have been reported in [6], [7]. These studies were further extended in 2016
      to 2018.
         3.Result and discussion
          Muon count rate has been observed at different places in the laboratory: inside, outside and at the roof
      of the laboratory i.e. at 4.5 m height. This observation is important to study many applications like low
      background measurements, count rate variation with the atmospheric parameter etc. Figure 6, 7 and 8
      are showing the variation in count rate with the different placement of detectors and it can be observed
      from the Figure 6 that single detector counts are high when measuring inside the laboratory; this is due
      to the high probability of secondaries to decay inside the laboratory from the wall of the laboratory. The
      graph has been plotted on a logarithmic scale and x-axis denote the date on which the counts has been
      taken. The other important factor to note here is the change in coincidence rate with respect to the
      placement of the detector and it can be observed form the figure 6 and 7 that coincidence count rate does
      not change by placing the detector inside or outside the laboratory but it does change on changing the
      altitude or height of the placement of detectoras shown in figure 8.

                                                            5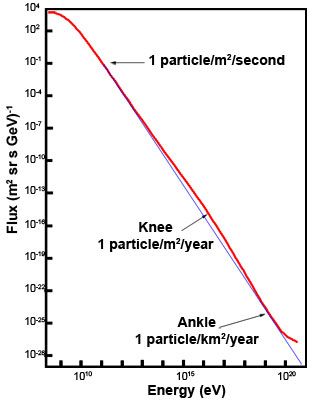
ICMAICT 2020                                                                                             IOP Publishing
Journal of Physics: Conference Series                   1804 (2021) 012150         doi:10.1088/1742-6596/1804/1/012150

                     Figure 7: Count rate variation of the detectorsinside and outside the laboratory

                        Figure 8: Count rate variation of the detectors at the roof of the laboratory.

          On keeping the detector at 4.5 m above, the coincidence count rate increased by a factor of 10 which
      shows that ongoing above the sea level the probability of getting large number of muons increases which
      is confirmed in other experiments too which are running at higher altitude such as GRAPES-3 experiment
      in Ooty. The probability of getting muon is directly proportional to the altitude i.e. as we go to the higher
      altitude the more muon,we'll be able to detect. Second study that has been carried out here is the variation
      in muon count rate (coincidence count rate) with the separation between the detectors (vertically and
      horizontally).
         Table 1: Count rate variation on increasing the distance between the detectors vertically and on the roof.
       Distance (cm)      Outside     Inside       Distance                  Roof             Ground
                          Counts/sec Counts/sec (cm)                         Counts/sec       Counts/sec
                      0         21.49         15.5 0                         0.66             0.29
                     30         13.71        12.27 30.48                     0.21             0.10
                     60         13.57        12.32 60.96                     0.096            0.07
                     90         10.98        10.80 91.44                     0.064            0.05
                    120          9.92        10.73 121.92                    0.038            0.02
                    150          9.92        10.32 152.4                     0.012            0.002

                                                               6
ICMAICT 2020 IOP Publishing
Journal of Physics: Conference Series 1804 (2021) 012150 doi:10.1088/1742-6596/1804/1/012150
Figure 9: Count rate variation
It has been observed that the count rate decreases while increasing the separation between the
detectors because of less probability of existing of vertical slant muons while passing through both the
detectors. Here the detector separation gives a possible approach to collect single muons and the detected
coincidences from related air shower particles. Table 1 is showing the muon count rate variation on
increasing the separation between the detectors vertically when the detectors are placed inside and
outside the laboratory. It has been observed from the table 1 and figure 9 that the counts rate does not
change much on placing the detectors outside and inside the laboratory. The muon rates inside and
outside the building showa slight variationin the studies done by the students in the Physics Department
of Genova University [14] but the other experimental muon rates are comparable. In this work, they have
designed the AstrO telescopeusing plastic scintillator, SiPMs and FPGA based DAQ in the INFN Genova
Unit. This is since the muon absorption factor is more in their case due to the presence of surrounding
materials.
The count rate decreases on increasing the distance between the detectors.Table 1 is showing the
count rate variation on increasing the separation between the detectors horizontally when the detectors
were placed at the ground and at the roof of the laboratory. Figure 9 shows that the muon count rates are
larger on placing the detectors on the roof as compare to the ground. This is because of the probability
of getting muon increases at higher altitudes while coincidence count rate decreases on increasing the
distance horizontally. The number of vertical muons is much more than the number of horizontal muons
i.e. most muons come vertically to the ground. We can interpret this as the muons are produced from
the shower only, so muon gives the information about the primary particles.
These studies have been done by using NIM electronics after successfully setting up the muon
telescope, the DAQ has been setup to study energy and time of flight experiments. Finally, the DEASA
(Dayalbagh Educational Air Shower Array) is being setup in the Department of Physics and Computer
Science, Dayalbagh Educational Institute, Agra.
4.Acknowledgment
We would like to thank Prof. Sunil Gupta and the staff of cosmic ray laboratory (CRL), Ooty, for
providing us with the scintillation detectors. A special appreciation to GRAPES-3 experiment for guiding
us in setting up the muon telescope.
REFERENCES
[1] Roger W. Clay, ZiawuddinKurban_ and Neville R. Wil, Cosmic Ray Related Undergraduate
Experiments, 2000.
[2]http://astronomy.swin.edu.au/cosmos/C/Cosmic+Ray+Energies
[3]RafaeA.Batista et al, Open questions in cosmic ray research at
UHE,https://doi.org/10.3389/fspas.2019.00023.
[4] Peter K. F. Grieder, Cosmic rays at earth, Researchers reference manual and data book, 2001.
7ICMAICT 2020 IOP Publishing
Journal of Physics: Conference Series 1804 (2021) 012150 doi:10.1088/1742-6596/1804/1/012150
[5] Glenn F. Knoll, Radiation Detection and Measurement, 3rd Edition, John Wiley & Sons, New York,
1989.
[6] S.N.L. Sirisha, K. Garg, and S. Bhatnagar. Nim Based Muon Telescope - An Educational
Experiment for Post Graduate Students physedu.com, N, Volume 32, Issue 1, Article Number
:10, 2016.
[7] K.Garg, S Bhatnagar, Identification of Nuclear Wastage with the help of Scintillation detectors,
accepted in Pramana Journal of Physics, Indian Academy of Sciences September2020.
[8]L.Bonechi et. al., Atmospheric muons as an imaging tool, Reviews in Physics 5 (2020) 100038.
[9] A.Chilingarian et.al., Stopping muon effect and estimation of intracloud electric field, Astroparticle
Physics 124 (2021) 102505.
[10] M.P. Panetta, on behalf of EEE Collaboration, The EEE Project: An extended network of muon
telescopes for the study of cosmic rays, Nuclear Instruments and Methods in Physics Research
A 824(2016) 642.
[11]Study the Correration of Muon Paddle Efficiency with Temperature, Pressure, Decoherence Curve
and Effect of Multiple Scattering Physics in Geant4 based Detector Simulation, Interna-tional
Journal of Current Research, vol. 8, Issue, 09, pp.39537-39545, September, 2016.
[12] R. Gilman, et al., Studying the Proton Radius Puzzle with µp Elastic Scattering arXiv:1303.2160.
[13]M. Bektasoglu, H Arslan. Investigation of the zenith angle dependence of cosmic ray muon at sea
level Pramana-journal of physics,may, 2013.
[14] S.Grazzi, et.al., AstrO: A portable cosmic ray telescope, Nuclear Inst. and Methods in Physics
Research, A 976 (2020) 164275.
8You can also read