THE WEEKLY UPDATE WEEK 15, 2021 - Squarespace

Page created by Janice Wood
 
CONTINUE READING
THE WEEKLY UPDATE WEEK 15, 2021 - Squarespace
THE WEEKLY UPDATE    Want to sponsor this report?
     WEEK 15, 2021            Click here
THE WEEKLY UPDATE WEEK 15, 2021 - Squarespace
Market Update
1   ▪   A brutal weekend in the crypto market, as positions worth
        almost $10 billion got liquidated in just 24 hours on Sunday.
        Bitcoin topped out just below $65,000 on Wednesday but
        dropped more than 20% from the top this weekend.

    ▪   The open interest in the bitcoin futures market denoted in
        bitcoin soared above 430,000 BTC last week, but the weekend
        crash caused a large decline.                                                                               BTC: Liquidations Data

    ▪   Cumulative bitcoin returns by trading hours suggest that the       $6,000m
        2020-2021 rally has been driven by investors from the western
        world (Europe and America).
                                                                                                                                                                                  $4,870m
                                                                           $5,000m

    Valuation                                                              $4,000m

2   ▪   After a few days above $60k, bitcoin is now back in the range
        where it spent most of the past month. Is the trend shifting, or
        are we just back to consolidation?                                 $3,000m

    ▪   As the market crashed down on Sunday and liquidations
        escalated, futures went into backwardation for the first time      $2,000m                                                                        $1,680m   $1,638m
        since the bloody days of March 2020.                                                                                          $1,510m

    ▪   On April 17th, $4.87 billion worth of BTC longs got liquidated
        as bitcoin flashed down towards $50k. This is by far the largest   $1,000m
        value of daily long liquidations ever recorded in bitcoin.

    Blockchain Activity                                                        $0m

3   ▪   The bitcoin hashrate declined sharply going into the weekend
                                                                           -$1,000m                                        $652m        $614.4m    $602.5m
                                                                                                                                                                    $357.5m       $474.21m
        following an incident in a coal mine in Xinjiang, leading
        transaction fees to skyrocket.                                            22 Sep         15 Oct   7 Nov   30 Nov     23 Dec      15 Jan   7 Feb       2 Mar      25 Mar    17 Apr

                                                                                      Source: Bybt
    ▪   In the last three months, North American bitcoin services have                                                      Longs     Shorts
        accumulated 35,000 BTC from Western European bitcoin
        services and 13,000 BTC from Eastern Asian bitcoin services.
THE WEEKLY UPDATE WEEK 15, 2021 - Squarespace
THE NEWSROOM

               Bank of England and HM Treasury                            Here’s How Much Stock Coinbase’s                          Gary Gensler is now head of the SEC.
               Launch Taskforce for UK CBDC                               Largest Shareholders Sold Last Week                       What comes next?

               The Bank of England and HM Treasury have announced         In a tweet that garnered several thousand retweets, one   In the crypto world, Gary Gensler has been one of the
               the launch of a taskforce to explore a potential U.K.      spectator noted that Coinbase's management team           most talked-about figures in government for many
               central bank digital currency (CBDC). The U.K. central     sold off the lion's share of their equity. But data       months, despite the fact that he hasn’t formally been in
               bank and government have not yet decided whether to        compiled by The Block from filings with the Securities    government at all yet. A moderate, Gensler is not likely
               launch a CBDC, so will use the task force to explore the   and Exchange Commission suggests that the firm's          to cut down on the SEC’s work getting token issuers to
               practicalities of doing so, according to an                largest shareholders sold off just a fraction of their    toe the line, but his interest in technology and financial
               announcement Monday. The Bank of England stated            shares in the firm over the course of April 14 and 15.    data suggests serious interest in updating markets.
               that a CBDC would not replace cash and bank deposits
               but exist alongside them.

Apr 20, 2021                                                                                       3
THE WEEKLY UPDATE WEEK 15, 2021 - Squarespace
Market tops out with hefty liquidations
                                                                                                         Bitcoin Correlation:

                                                                                                                                                ETH                   XRP                   GOLD                     S&P500
                                                                                                               90-day correlation

                    A brutal weekend in the crypto market, as positions worth almost $10 billion
                                                                                                             (weekly change included)
               ▪
                    got liquidated in just 24 hours on Sunday. Bitcoin topped out just below                         BTC                0.767         0.023   0.267         0.042   0.094          0.038       0.181            0.044
                    $65,000 on Wednesday but dropped more than 20% from the top this
                                                                                                          Source: CoinMetrics
                    weekend.

               ▪    As the market was heavily biased towards the upside with a euphoric futures
                    market, this flush of overleveraged traders have been a very healthy event to                                Top 3 by Market Cap: Percentage Change in Price Over the Last Week
                    balance the market. At one point on Sunday, BTC futures traded at an
                    approx. 40% annualized discount to spot, not seen since the bloody Thursday
                    of March 12th, 2020. More on this on page 14.

               ▪    Dogecoin is still making headlines this week and climbed into the top 5 this
                    week, after gaining almost 500% in a week. DOGE is up more than 7000%
                    this year and illustrates the state of the crypto market right now.

           Best Performing                                  Price   Last week   Last month         YTD                                                                                                                 -2.3%       $2,113
           Dogecoin                                         0.419    468.30%      628.50%     7216%
           VeChain                                          0.236     76.11%      152.60%     1135%
                                                                                                                                                                                                                       -9.5%        $498.2
           NEO                                            105.349     67.98%      155.50%      631%
                                                                                                                                                                                                                       -10.1%      $54,856
           Worst Performing                                 Price   Last week   Last month         YTD
           Elrond                                         163.276    -26.46%       21.23%      548%
           Stellar                                          0.488    -22.25%        22.90%     267%
           Avalanche                                       25.401    -21.22%       -21.79%     591%

           Last week of top 50 by market capitalization
           Source: cryptowat.ch, messari.io                                                                                                                                                          Source: NYDIG

Apr 20, 2021                                                                                             4
THE WEEKLY UPDATE WEEK 15, 2021 - Squarespace
Mid Caps ballooning last week
               But is the altcoin trend turning?
                                                                                               Percentage of Total Market Capitalization
                                                                                                              BTC       ETH        BCH     LTC     XRP      DASH           NEM           XMR           IOTA       NEO
                                                                                                 Market
                                                                                                            53.85%     12.78%      0.84%   0.87%   3.03%    0.15%         0.17%          0.32%         0.28%      0.38%
                                                                                                 Share
                                                                                                 Weekly
                                                                                                 Change*
                                                                                                             -2.07%     0.51%      0.22%   0.02%   -0.62%   0.02%         -0.01%         0.04%         0.01%      0.16%

               The Mid Caps Index ballooned last week, while Large Caps struggled. Is              * Weekly change in percentage points
               this a change in trend after some profitable months for altcoins, or is it                                                                                                         Source: Coinpaprika.com
               just a pullback and shift in focus among traders?
                                                                                                               Monthly Performance of Market Capitalization Weighted Indexes

               •   The Mid Caps Index was only up 22% last Tuesday but closed yesterday at
                   72%. The Index has been skyrocketing thanks to DOGE, VET, and NEO,
                   among others, seeing incredible gains lately.                                                                                                                                       72%

               •   The Small Caps Index ended yesterday at a 28% gain and has not
                   managed to follow the trend of the Mid Caps Index.

               •   The Large Cap Index is now trending towards losses this month, getting
                   dragged down by bitcoin, which is down 5% so far in April
                                                                                                                                                                                                       28%
               •   Bitcoin’s market share is still declining in this altcoin-focused market,
                   down another two percentage points this week.

                                                                                                                                                                                                       2%

                                                                                                                                                                                                       -5%

                                                                                                                                                            Source: NYDIG, Bletchleyindexes.com

Apr 20, 2021                                                                                       5
THE WEEKLY UPDATE WEEK 15, 2021 - Squarespace
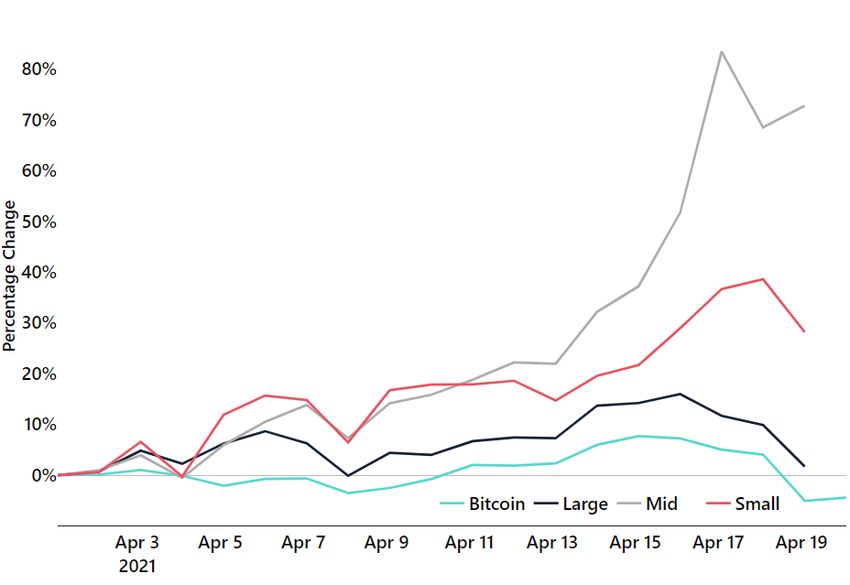
Market sentiment stays high despite market turmoil
       The Fear and Greed Index looks reasonably unaffected by the weekend pullback. The index now at 73, just slightly lower
       than last week’s 74. While the sentiment has stabilized outside of the “Extreme Greed” area, there is still a significant risk
       appetite, at least according to this indicator.

                                                                Fear & Greed Index

               Extreme Greed

                                                                                                                                        73

                                                                                                                                                                         73

                                                                                                                                               Now        Last week    Last month

               Extreme Fear                                                                                                                  Greed (73)   Greed (74)   Greed (74)

          Source: Alternative.me, NYDIG

Apr 20, 2021                                                                                               6
Fifth highest volume of 2021 as market crashes down
          The bitcoin volume spikes again this week, as Sunday saw the fifth highest volume of 2021 when the market crashed down. Almost $18 billion changed hands on the leading spot
          exchanges. The 7-day average real bitcoin volume* is now back above $10 billion and at the highest level since the beginning of March, as activity has picked up again.

                                       16
                                                                                                Real BTC Daily Volume (7-day average)

                                       14

                                       12
               Trading Volume ($ bn)

                                       10

                                       8

                                       6

                                       4

                                       2

                                       0
                                       Apr 20               May 20   Jun 20   Jul 20   Aug 20     Sep 20     Oct 20       Nov 20   Dec 20   Jan 21   Feb 21          Mar 21             Apr 21
                                            Source: Messari, Skew                                                                                       *as defined by Arcane Research. Read more here.

Apr 20, 2021                                                                                                          7
Volatility climbing again
               The short-term volatility is climbing again this month. Since the 7-day volatility bottomed out at the beginning of the month around 2%, we are now back above 3.5%. A few
               days of substantial intraday action for bitcoin has taken the 7-day volatility back above the 30-day volatility.

      20%
                                                                                                 BTC-USD Volatility

                                                                                Daily Return        30-Day Volatility        7-Day Volatility
      15%

      10%

       5%
                                                                                                                                                                                            3.55%

                                                                                                                                                                                            3.01%
       0%

       -5%

      -10%
         Apr 20                May 20           Jun 20   Jul 20        Aug 20           Sep 20          Oct 20          Nov 20          Dec 20    Jan 21         Feb 21        Mar 21

               Source: cryptowat.ch, Coinbase

Apr 20, 2021                                                                                                8
The western world has been the key driver of this bitcoin bull market
               Cumulative bitcoin returns by trading hours suggest that the 2020-2021 rally
               has been driven by investors from the western world (Europe and America).                                               Bitcoin Returns – North America, Europe, Asia Hours
                                                                                                                300%
               ▪   In January, NYDIG Research published an excellent research piece on the geographic
                   drivers of bitcoin returns. The report analyzed bitcoin’s cumulative returns by dividing
                   the day into three trading sessions: North America (9 am – 5 pm ET), Asia (5 pm – 1 am       250%                                                                     2021
                   ET), Europe (1 am – 9 am ET).

               ▪   The piece clearly illustrated the historical importance of the Asian market during bitcoin   200%
                   rallies. Additionally, the piece highlighted that since 2020, the western world has been
                   the definite driver of the bitcoin bull market.

                                                                                                                150%
               ▪   In 2020, bitcoin saw most of its returns during the North American and European
                   trading hours, with North American trading hours seeing the large cumulative gains of
                   132% (since Jan 1st, 2020).
                                                                                                                100%

               ▪   In 2021, European trading hours have seemingly been a more important driver of the
                   bitcoin returns. From Jan 1st, 2020, till April 19th, 2021, European trading hours have
                                                                                                                50%
                   seen 254% in cumulative returns, while American trading hours have seen 162% in
                   cumulative returns. This could be a result of a European overlap in trading hours with
                   both Asian evenings and American pre-market hours.
                                                                                                                 0%
               ▪   Asian trading hours, on the other hand, are contributing in the opposite direction. From
                   Jan 1st, 2020, till April 19th, 2021, Asian trading hours have had a negative cumulative
                   return of 15%!                                                                               -50%
                                                                                                                    Jan 20            Apr 20           Jul 20          Oct 20           Jan 21   Apr 21
               ▪   The bitcoin returns clearly suggest that Europe and America is the key driver of this
                   bitcoin rally, and as we show on slide 20, North American entities have accumulated a                                        Asia        Europe      North America
                   sizeable chunk of the bitcoin supply since January 2020.
                                                                                                                 Source: NYDIG Data

Apr 20, 2021                                                                                                     9
The weekend crash caused a sharp decline in the open interest in the bitcoin futures

               The open interest (OI) in the bitcoin futures market denoted in bitcoin
               soared above 430,000 BTC last week, but the weekend crash caused a                                                   Bitcoin Futures: Total open interest (BTC) vs BTCUSD (log)
               large decline. We argue that contextualizing the open interest in terms                   ₿ 550,000
               of the underlying may shed light on the relative extent of leverage in the
               market.

               ▪   The OI denoted in bitcoin has pushed above 400,000 BTC throughout April for
                   the first time since the summer of 2020.                                              ₿ 500,000

               ▪   Last week, the OI denominated in bitcoin peaked at 430,000 BTC. The cataclysmic                                                                                                            $40,000
                   crash this weekend resulted in a sharp decline in the open interest, which
                   declined to 392,000 BTC by EOD Sunday.
                                                                                                         ₿ 450,000
               ▪   Measuring the open interest in terms of bitcoin is not the norm. Usually, the OI is
                   measured in dollars, but we argue that OI denoted in bitcoin could be value-
                   adding in terms of understanding whether the market is turning over-extended.
                                                                                                         ₿ 400,000
               ▪   When denoting OI in BTC, we contextualize how much of the actual supply is
                   affiliated with leveraged trades. Given bitcoin’s very strong performance over the                                                                                                        OI, Apr 18th:
                   last year, it is natural that the open interest has increased in dollar terms. We                                                                                                          392k BTC
                   clearly see that the OI has not grown at the same rate in BTC terms until the end
                   of March, when the OI measured in BTC climbed from 350,000 BTC to 430,000             ₿ 350,000
                   BTC.

               ▪   Given that OI is a result of both longs and shorts, the OI alone is not a suitable
                   indicator to make assumptions on the state of the market.
                                                                                                         ₿ 300,000
               ▪   However, when combined with more indicators, we can make assumptions on
                   which direction the market is leveraged towards. With the huge futures premiums
                   we’ve seen and the high funding rate lately, it was fair to assume that the market
                   was geared towards further upside.                                                                                                                                                         $4,000
                                                                                                         ₿ 250,000
               ▪   In hindsight, following the weekend crash, the degree of leverage towards the                 Jan 20                 Apr 20          Jul 20           Oct 20            Jan 21   Apr 21
                   upside becomes evident. Analyzing the OI in BTC terms might be useful in the
                   future to determine when it’s reasonable to take some chips off the table.                    Source: Skew, TradingView

Apr 20, 2021                                                                                                      10
Coinbase’s first week of trading on Nasdaq

               The direct listing of Coinbase on Nasdaq took place last week, and while the
               first few hours saw huge volatility, the price has later stabilized at around                                                    First week of trading: Coinbase COIN
               $330 per share.                                                                          $420

               ▪   Coinbase was listed on Nasdaq on Wednesday under the ticker COIN.
                                                                                                        $400
               ▪   Coinbase began trading at $381 per share and reached an intraday high of
                   $429.54 before closing the day trading at $328.28 on Wednesday.
                                                                                                        $380
               ▪   For the two remaining trading days of the week, Coinbase stabilized at around
                   $330 per share, and it closed its first week of trading at $342, giving Coinbase a
                   market cap of $63.6 billion.
                                                                                                        $360

               ▪   During the first day of trading, Coinbase’s management team sold off
                   considerable amounts of equity. This is usual in direct listings, where the
                   existing shareholders ensure the supply of shares available in the book              $340
                   building.

               ▪   According to The Block, CEO Brian Armstrong sold 1.5% of his shares, while           $320
                   CFO Alesia Haas sold 15% of her total holdings.

               ▪   COO Emilie Choi and CAO Jennifer Jones sold the most shares in percentage            $300
                   terms selling 24% (Choi) and 38% (Jones), respectively.                                 14 Apr, 13:30                15 Apr, 9:30        15 Apr, 13:30     16 Apr, 10:30   16 Apr, 14:30

                                                                                                               Source: Tradingview, Nasdaq

Apr 20, 2021                                                                                              11
VALUATION
What’s next for bitcoin?

               After a few days above $60k, bitcoin is
                                                                  Bitcoin / U. S. Dollar, 4H, Coinbase
               now back in the range where it spent a lot
               of time over the past month. Is the trend
               turning, or are we just back to
               consolidation?

               ▪   Bitcoin dropped all the way down to the
                   $51k area on Sunday, but recovered
                   quickly. The first resistance is now around
                   $58k.

               ▪   Climbing above this level and retaking
                   the $60k level would be a bullish signal
                   and potentially take us towards the ATH
                   again.

               ▪   The lower $50k area should be a fairly
                   strong support level. This area was
                   resistance both in late February and early
                   March, but acted as support in late
                   March and this weekend.

               ▪   Losing $50k would be short-term bearish
                   and could potentially take us down to the
                   $45k area.

                                                                 Source: Tradingview, Coinbase

Apr 20, 2021                                                                                             13
Bitcoin futures in backwardations as market panics
                                                                                                                   BTC Futures Annualized Rolling 3-Month Basis
                                                                                  60%
               The sentiment in the futures market has changed
               drastically over the past week. As the market crashed
               down on Sunday and liquidations escalated, futures went            50%
               into backwardation for the first time since the bloody
               days of March 2020.                                                40%

               ▪   During the most turbulent hours on Sunday, the                 30%
                   annualized 3-month basis dropped close to -40% on
                   some platforms.                                                20%

               ▪   However, and very different from last time this happened,       10%
                   the basis jumped back in contango quickly. A healthy flush
                   of overleveraged traders and the futures premiums are           0%
                   now half of what was seen last week.

                                                                                  -10%
               ▪   There is still a significant gap between CME and the retail-
                   focused platforms. These offshore platforms are now
                                                                                  -20%
                   seeing an annualized premium just above 20% on the 3-
                   months contract, while CME is closer to 10%.
                                                                                  -30%

               ▪   We have been highlighting the danger of this euphoric
                                                                                  -40%
                   futures market over the past month, and traders without
                   proper risk management were punished hard this
                   weekend.                                                       -50%
                                                                                     28 Feb    4 Mar   8 Mar   12 Mar 16 Mar 20 Mar 24 Mar 28 Mar   1 Apr     5 Apr    9 Apr     13 Apr    17 Apr

                                                                                                                 FTX      BitMEX       Deribit      Binance           CME*
                                                                                    Source: Skew.com                                                                           *Closed Saturday - Sunday

Apr 20, 2021                                                                                           14
Funding rate reset
               The weekend dump led funding rates to fall heavily, and for a
               period, the funding rates were substantially negative before                                     BTC Price vs Funding Rates
               turning neutral.

               ▪   The weekend crash in bitcoin caused funding rates to decline as
                   an incredible $4.8 billion worth of overleveraged longs got
                   liquidated (see the next slide).

               ▪   Prior to the crash, the funding rates had been very high
                   throughout April, peaking above 0.16% on April 10th.

               ▪   The funding rates later declined, first to around 0.08% before
                   declining further towards 0.04% as bitcoin drifted down from its
                   peak towards $60,000.

               ▪   Once the $60,000 support was broken, a massive sell-off
                   occurred, leading to a cascade of liquidations of over-leveraged
                   longs.

               ▪   The massive sell-off on Saturday led the funding rates to decline
                   further. The funding rates declined far into the negative territory,
                   with the average funding rates reaching -0.045% as the
                   sentiment among traders quickly shifted from absolute euphoria
                   to agonizing panic.

               ▪   During this bitcoin rally, negative funding rates have usually
                   been a great entry point. However, with the extreme events in
                   the market this weekend it makes sense being extra cautious –          Source: NYDIG Data
                   at least when it comes to leveraged plays.

Apr 20, 2021                                                                                               15
$4.9 billion worth of longs liquidated on Saturday
               On April 17th, $4.9 billion worth of BTC longs got liquidated as                                                          BTC: Liquidations Data
               bitcoin flashed down towards $50k. This is by far the largest value of
               daily long liquidations ever recorded.                                           $6,000m

               ▪   The $4.87 billion worth of liquidated longs is the largest long                                                                                                                       $4,870m
                                                                                                $5,000m
                   liquidation volume ever recorded and is bigger than the three largest
                   long liquidation days combined.

                                                                                                $4,000m
               To put the astronomical $4.87 billion liquidation into further context:

               The $4.87 billion worth of long liquidations is larger than the total value of   $3,000m
               all long liquidations in October and November combined. In the flash of
               one dreadful and violent correction, more longs were liquidated than in the
               span of two entire months!
                                                                                                $2,000m                                                                         $1,680m    $1,638m
                                                                                                                                                           $1,510m

               ▪   Amid the volatility, longs were not alone in suffering. A total of $474
                   million worth of shorts were liquidated as well. In other words, a total     $1,000m
                   of $5.3 billion worth of leveraged trades got liquidated on Saturday,
                   highlighting the absurd amount of leverage and risk appetite in the
                   market right now.
                                                                                                    $0m

                                                                                                                                                                                          $357.5m
               ▪   Hopefully, this was a proper wakeup call for all the extreme risk-                                                                                                                    $474.21m
                                                                                                                                               $652m
                   takers, with this remarkable liquidation day enabling the market to          -$1,000m                                                      $614.4m    $602.5m
                   evolve in a more substantial manner onwards.                                         22 Sep       15 Oct   7 Nov   30 Nov     23 Dec      15 Jan     7 Feb       2 Mar       25 Mar   17 Apr

                                                                                                          Source: Bybt                         Longs      Shorts
               ▪   We once again repeat ourselves with this message, but it is important.
                   Avoid the intense FOMO. Stack sats and be conservative with the
                   leverage. As in Aesop’s fables, the tortoise ended up beating the hare.
                   Slow and steady wins the race. Be smart, not greedy.

Apr 20, 2021                                                                                           16
BLOCKCHAIN ACTIVITY
Bitcoin on-chain summary: Hashrate decline causes fees to skyrocket

           It’s been an eventful week on-chain, with a significant decline in
           hashrate causing transaction fees to surge.

           ▪ A coal mine incident in Xianjing caused the hashrate to plummet (see
             next slide).

           ▪ This has caused the block creation to decline substantially, with the
             average rate of blocks created per hour over the last week sitting at
             5.14, far below the normal rate of 6.

           ▪ The slower block creation rate has caused transaction fees to rise.
             The average daily transaction fee grew by nearly 75% this week, from
             $5.5 million to $9.6 million.

           ▪ With the rising transaction fees and the declining revenue from block
             subsidies, transaction fees over the last week contributed to 17% of
             the miner revenue.

           ▪ With median transaction fees hitting $50, the average transaction
             value has climbed by 26%, which makes sense as smaller transactions
             become less attractive with growing fees.

                                                                                     Source: Bytetree

Apr 20, 2021                                                                                    18
Sharp decline in hashrate following coal mine incident in Xinjiang

               The bitcoin hashrate declined sharply in two days following an incident in a coal
               mine in Xinjiang, leading fees to skyrocket.
                                                                                                                                                                                      Bitcoin hashrate
               ▪   From Thursday to Saturday, the bitcoin hashrate declined from 198 exahashes per second to
                                                                                                                                                                                                                             April 15th:
                   107 exahashes per second, a 46% decline in two days.
                                                                                                                                                                                                                             198 EH/s
                                                                                                                                                      200
               ▪   We emphasize that these data are prone to some daily inaccuracies due to the method used to
                   estimate the hashrate. Reported numbers from the various mining pools suggest that the
                   hashrate decline was a less severe, yet still significant, 20%.                                                                    180

                   The key drivers to this decline are issues in several coal mines in China, most notably in the                                     160

                                                                                                                               Exahashes per second
               ▪
                   Xinjiang province. This is a region that historically has attracted a lot of hashrate during the dry
                   season in China.
                                                                                                                                                      140

               ▪   The timing of the Xinjiang incident could not be worse. The decline occurred only a few hours
                   after bitcoin’s difficulty was adjusted to new highs.                                                                              120

                                                                                                                                                                                                                             April 17th:
               ▪   An interesting side note following this incident is that the dominance of Chinese miners in                                        100                                                                    107 EH/s
                   bitcoin has seemingly declined, as Mustafa Yilham of Bixin Group pointed out in this Twitter-
                   thread.
                                                                                                                                                       80

               ▪   The decline in hashrate carried some short-term consequences. Far fewer blocks have been
                   created over the last few days, leading to slower transactions and higher fees.                                                    60
                                                                                                                                                       Apr 20               Jul 20          Oct 20              Jan 21   Apr 21

               ▪   As bitcoin saw a violent correction last week, the demand for on-chain transactions also rose                                                                     EH/s       7 day average
                   with traders seeking arbitrage opportunities across exchanges. Thus, fees climbed further, and
                   from Sunday, April 11th to Sunday, April 17th, the average transaction fee has risen from $14.90
                                                                                                                                                        Source: Glassnode
                   to $44.07.

Apr 20, 2021                                                                                                              19
The Regional Flows of Bitcoin
               North American Bitcoin Services are accumulating bitcoin from both Europe and Asia
                                                                                                                                                       Regional Flows of bitcoin
               In the last three months, North American bitcoin services have
               accumulated 35,000 BTC from Western European bitcoin                                           From Eastern Asia to                                                          From North America to
               services and 13,000 BTC from Eastern Asian bitcoin services.
                                                                                      ₿ 80,000                                                                           ₿ 70,000
                                                                                                                                                                         ₿ 60,000
               ▪   Chainalysis has identified geographic locations of various         ₿ 60,000
                   bitcoin services – and the data indicates that American entities                                    ₿ 21,343                                          ₿ 50,000
                                                                                                                                                                                                       ₿ 24,611        ₿ 23,076
                                                                                                                                          ₿ 24,765
                   have accumulated a lot of bitcoin in this entire market cycle.     ₿ 40,000
                                                                                                                                                                         ₿ 40,000     ₿ 24,198
                                                                                                    ₿ 18,022
                                                                                                                                                                         ₿ 30,000
                                                                                      ₿ 20,000                         ₿ 44,283                                          ₿ 20,000
                                                                                                                                                                                                       ₿ 32,990        ₿ 33,753
               ▪   From mid-March 2020 till the end of 2020, American entities                      ₿ 28,647
                                                                                                                                          ₿ 35,308            ₿ 7,618
                                                                                                                                                                          ₿ 10,000
                                                                                                                                                                                      ₿ 27,528                                          ₿ 4,997
                   had a net inflow of approximately 700,000 BTC according to                                                                                ₿ 11,215                                                                   ₿ 12,140
                                                                                           ₿0                                                                                  ₿0
                   Chainalysis.
                                                                                                    January           February             March              April                   January          February         March               April

                                                                                                  North America        Western Europe         Rest of the world                      Eastern Asia     Western Europe    Rest of the World
               ▪   The trend has continued in 2021. We see that North American
                   bitcoin services have seen a net inflow of nearly 50,000 BTC
                   from Western European and Eastern Asian entities this period.
                                                                                                       From Western Europe to                                                  Net North American Inflow (last 3 months)
                                                                                      ₿ 80,000
               ▪   North American services have accumulated more than 35,000
                   BTC from Western European services in the last three months,
                                                                                      ₿ 60,000
                   and more than 13,000 BTC from Eastern Asian services.                                              ₿ 23,233                                           From Western Europe                               ₿ 35,487
                                                                                                   ₿ 16,648
                                                                                      ₿ 40,000
                                                                                                                                         ₿ 17,033
               ▪   We clearly see that Northern American entities is
                   strengthening its grip on bitcoin. While stories of the Chinese    ₿ 20,000     ₿ 37,457           ₿ 41,998
                                                                                                                                         ₿ 26,227
                   bitcoin dominance is once again spreading like wildfire in the                                                                            ₿ 6,414
                                                                                                                                                                            From Eastern Asia         ₿ 13,041
                                                                                                                                                             ₿ 6,688
                   media, on-chain data suggest that the pendulum is moving                ₿0
                   towards America.                                                                January            February            March              April

                                                                                                      North America     Eastern Asia    Rest of the World
                                                                                                                                                                                                 ₿0          ₿ 15,000        ₿ 30,000

                                                                                        Source: Chainalysis

Apr 20, 2021                                                                                             20
Are you looking for exclusive research or analysis?

                         Visit us at research.arcane.no

Apr 20, 2021                           21
Disclaimer

               •   The Weekly Update (the “Report”) by Arcane Research is a report focusing on cryptocurrencies, open blockchains and fintech. Information published in the Report aims to spread knowledge and summarise developments in
                   the cryptocurrency market.

               •   The information contained in this Report, and any information linked through the items contained herein, is for informational purposes only and is not intended to provide sufficient information to form the basis for an
                   investment decision nor the formation of an investment strategy.

               •   This Report shall not constitute and should not be construed as financial advice, a recommendation for entering into financial transactions/investments, or investment advice, or as a recommendation to engage in investment
                   transactions. You should seek additional information regarding the merits and risks of investing in any cryptocurrency or digital asset before deciding to purchase or sell any such instruments.

               •   Cryptocurrencies and digital assets are speculative and highly volatile, can become illiquid at any time, and are for investors with a high risk tolerance. Investors in digital assets could lose the entire value of their investment.

               •   Information contained within the Report is based on sources considered to be reliable, but is not guaranteed to be accurate or complete. Any opinions or estimates expressed herein reflect a judgment made as of the date of
                   publication and are subject to change without notice.

               •   The information contained in this Report may include or incorporate by reference forward-looking statements, which would include any statements that are not statements of historical fact. No representations or warranties
                   are made as to the accuracy of these forward-looking statements. Any data, charts or analysis herein should not be taken as an indication or guarantee of any future performance.

               •   Neither Arcane Research nor Arcane Crypto AS provides tax, legal, investment, or accounting advice and this report should not be considered as such. This Report is not intended to provide, and should not be relied on for,
                   tax, legal, investment or accounting advice. Tax laws and regulations are complex and subject to change. To understand the risks you are exposed to, we recommend that you perform your own analysis and seek advice from
                   an independent and approved financial advisor, accountant and lawyer before deciding to take action.

               •   Neither Arcane Research nor Arcane Crypto AS will have any liability whatsoever for any expenses, losses (both direct and indirect) or damages arising from, or in connection with, the use of information in this Report.

               •   The contents of this Report unless otherwise stated are the property of (and all copyright shall belong to) Arcane Research and Arcane Crypto AS. You are prohibited from duplicating, abbreviating, distributing, replicating or
                   circulating this Report or any part of it (including the text, any graphs, data or pictures contained within it) in any form without the prior written consent of Arcane Research or Arcane Crypto.

               •   By accessing this Report you confirm you understand and are bound by the terms above.

               •   Arcane Research is a department within Arcane Crypto AS, org. 994 608 673, and can be contacted at research@arcane.no or tbj@arcane.no

Apr 20, 2021                                                                                                                     22
Subscribe to
The Weekly Update

Contact: research@arcane.no
You can also read