IRobot Corporation Investor Presentation - June 2020 - Investors | IROBOT ...
←
→
Page content transcription
If your browser does not render page correctly, please read the page content below
iRobot Corporation
Investor Presentation
              June 2020

                          June 2020   1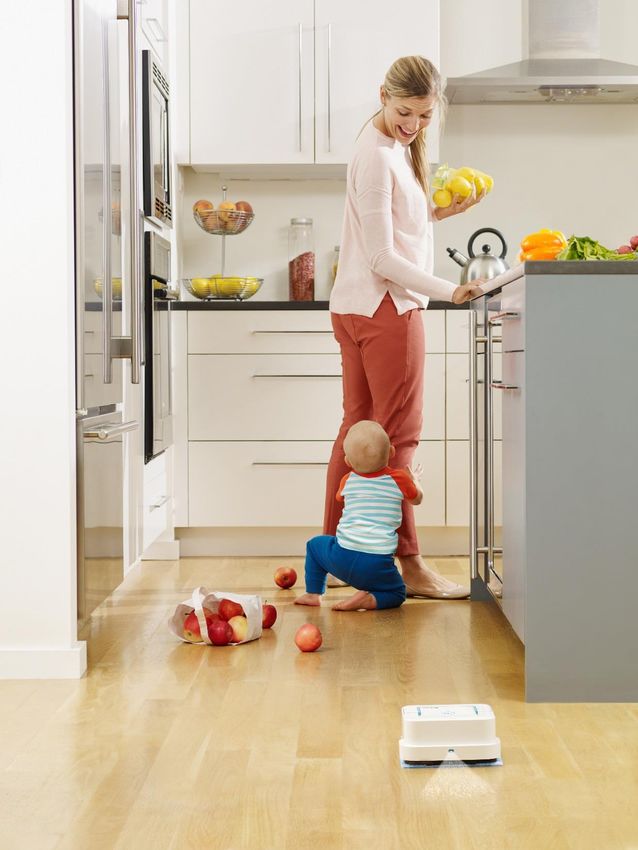
Forward Looking Statements

• Certain statements made in this presentation that are not based on historical information are forward-looking
  statements which are made pursuant to the safe harbor provisions of the Private Securities Litigation Reform Act of
  1995.
• These statements are neither promises nor guarantees, but are subject to a variety of risks and uncertainties, many
  of which are beyond our control, which could cause actual results to differ materially from those contemplated in
  these forward-looking statements.
• Investors are cautioned not to place undue reliance on these forward-looking statements, which speak only as of the
  date hereof. iRobot Corporation undertakes no obligation to update or revise the information contained in this
  presentation, whether as a result of new information, future events or circumstances or otherwise.
• For additional disclosure regarding these and other risks faced by iRobot Corporation, see the disclosure contained
  in our public filings with the Securities and Exchange Commission.

                                                                                                       June 2020        2
Non-GAAP Financial Metrics
Regulation G Disclosure
This presentation contains references to the non-GAAP financial measures as defined by SEC Regulation G, including non-GAAP gross profit and non-GAAP
gross profit margin, non-GAAP operating expenses, non-GAAP operating income and non-GAAP operating income margin, non-GAAP income tax expense,
non-GAAP net income (earnings) and non-GAAP net income (earnings) per share. These non-GAAP financial measures should not be considered a
substitute for, or superior to, financial measures calculated in accordance with GAAP, and the financial results calculated in accordance with GAAP and
reconciliations from these results should be carefully evaluated.

Non-GAAP gross profit removes expenses related to the amortization of acquired intangible assets and stock-based compensation while non-GAAP gross
profit margin is calculated as non-GAAP gross profit divided by revenue for the applicable period. Non-GAAP operating expenses excludes the amortization
of acquired intangible assets, stock-based compensation, net merger, acquisition and divestiture (income) expense, and net IP litigation expense. Non-GAAP
operating income removes the aforementioned non-GAAP operating expenses while non-GAAP operating income margin is calculated as non-GAAP
operating income divided by revenue for the applicable period. Non-GAAP income tax expense reflects the tax effect of the non-GAAP adjustments,
calculated using the appropriate statutory tax rate for each adjustment. Non-GAAP net income includes the aforementioned items related to non-GAAP
income from operations, and also removes gain or loss on strategic investments. Non-GAAP net income (earnings) per share is calculated by dividing non-
GAAP net income (earnings) by the number of diluted shares used in per share calculations for the applicable period. Definitions of each item and why they
are used in calculating non-GAAP financial measures is detailed in the appendix of this presentation.

We use non-GAAP measures to internally evaluate and analyze financial results. We believe these non-GAAP financial measures provide investors with
useful supplemental information about the financial performance of our business, enable comparison of financial results between periods where certain items
may vary independent of business performance, and enable comparison of our financial results with other public companies, many of which present similar
non-GAAP financial measures. The reconciliation of these non-GAAP metrics to the comparable GAAP metrics are set forth in the accompanying tables in the
appendix of this presentation and are available on our website at https://investor.irobot.com/.

                                                                                                                                       June 2020         3
Investment Highlights

    Category creator, innovator and leader in Robotic Floor Care & AI                    NASDAQ:
             ̶ Strong revenue growth with continued runway                               IRBT
              ̶ Consistent innovation, category leadership and portfolio expansion
               ̶ Cutting-edge robotic AI and home understanding

    Accelerating strategic initiatives aimed at
             ̶ Differentiating the cleaning experience                                   Market Cap:
              ̶ Building direct relationships with 5+m connected, engaged owners         $2.1B*
               ̶ Nurturing lifetime value of customer relationships

    Taking actions to navigate challenging market conditions
             ̶ Recalibrating spending                                                    Headquarters in
              ̶ Investing to scale our direct-to-consumer sales channel
               ̶ Well-positioned to drive sustainable, profitable growth
                                                                                         Bedford, MA,

* Based on stock price as 6/1/20
                                                                                     June 2020     4
Category Creator, Innovator & Leader                                                                                     $1B+
                                                                                                                         in 2019 sales
Global category leader well positioned for future expansion
                                                                                                     9M+
                                                                                                     connected
Broadened portfolio over the past two years
                                                                                                     robots
                                                                                                                         5M+
with innovative new products
Consistent innovation across the portfolio                                                                               opted-in
to widen competitive moat
                                                                                                    30M+                 consumers
             Global $ Segment Share (RVC+, +$200)
                                                                                                    units sold
                10%             11%                 9%              Others
  19%           1%                                  1%              Dyson
                2%               1%
                                 1%
                3%               2%                 5%
   1%           1%
                4%
                                 3%                 3%              Samsung
   2%           1%               3%                 3%
   3%
   2%           4%
                                 3%                                 Panasonic
                                 4%                 8%
  10%                            5%
                                                                    Cecotec
                11%                                 4%
                                                                    Neato
                                14%                 14%             Shark
                                                                    Roborock
                                                                    Mi
                                                                    Ecovacs

 64%          62%             52%             52%
                                                                    iRobot

  CY'16        CY'17            CY'18           CY'19
                                                          *Source: Global market size for Vacuum
                                                          Cleaners >$200 (Third-Party Market Data            June 2020        5
                                                          and iRobot internal estimates).
An Expanding Global Franchise
Double-digit revenue growth since 2014                                          Revenue by Geography

                              Revenue                                                      FY16
                              ($ in millions)
$1,400
                                                                                       APAC
                                                                                        22%
                                                                       $1,214
                                                                                              Americas
$1,200                                                                              EMEA        53%
                                                       $1,093   +11%    $203
                                                                                     25%

$1,000
                                    +24%                $171
                       $884                                                                FY19
                                                                        $358
 $800                  $154

         $656
                +35%                                    $312
                                                                                    APAC
                                                                                     17%
 $600                  $242
         $141

         $166                                                                                         America
 $400                                                                                                   s
                                                                        $653    EMEA                   54%
                                                        $610
                                                                                 29%
                       $488
 $200
         $349

    $-
         2016          2017                             2018            2019

                         Americas    EMEA       APAC

                                                                                              June 2020         6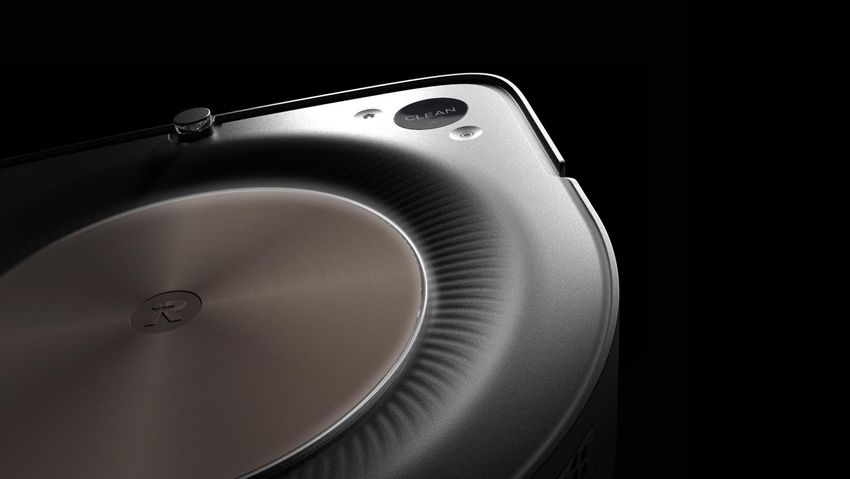
Continued Runway to Support Expansion
   RVCs Gaining Momentum with Consumers but Household Penetration Remains Low

                  2012: ~$5B Market

                                        RVC
                                                                      Immediate addressable market
                                        13%
                                                                      ~1.5X current installed base

                       Non-RVC
                         87%
                                                                                                                                               90MM
                                                                                                                                               HH’s
                  2019: $11B Market
                                                                                                                                                                               128MM
                    11.5% CAGR
                                                                                                                                                                                HH’s
                                                         RVC:
                                                         22% CAGR
                                              RVC
                                              24%
                                                                      15MM - 17MM HH’s
                                                                      12% - 13% of Total                                22MM
Non-RVC:                                                                                                                 HH’s
9% CAGR

                                                                             Installed Base                        Addressable Market   Longer Term Potential               Total U.S. HH's
                    Non-RVC
                      76%

                                                                                                                                                                June 2020            7
           *Source: Global market size for Vacuum Cleaners >$200      Source: iRobot estimate at the end of 2019
           (Third-Party Market Data and iRobot internal estimates).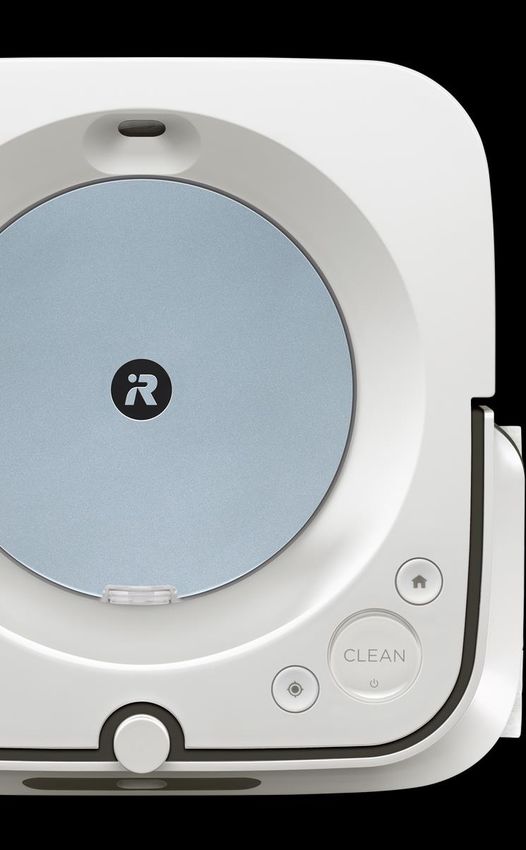
Category Leadership Fortified Through Innovation
2019 Regional Retail Share
1% 3% 1% EMEA
North America 3% iRobot
2019 Size: $764M 2019 Size: $869M iRobot
Shark 12%
Growth: -1% Growth: +20% Cecotec
IRBT position: Held share 10% Neato IRBT position: Modest Ecovacs
9%
Samsung share erosion Neato
Ecovacs 5% Roborock
82%
All Others
6%
55% All Others
14%
3%
2%
3% iRobot
Global (excl iRobot
Japan 11%
3% Panasonic China) Shark
2019 Size: $219M
Hitachi 2019 Size: $1,936M 3% Neato
Growth: +11% 4% Cecotec
15% Electrolux Growth: +9%
IRBT position: Meaningful 6% Ecovacs
Dyson IRBT position: Slight share
Share gain Roborock
All Others erosion 3%
74% 4% 67% All Others
* Source: 2019 market size for Vacuum Cleaners >$200 (Third-Party Market Data and iRobot internal estimates). Growth from prior year reflects normalization of 52-week June 2020 8
calendar year, updates to certain data sources and other changes.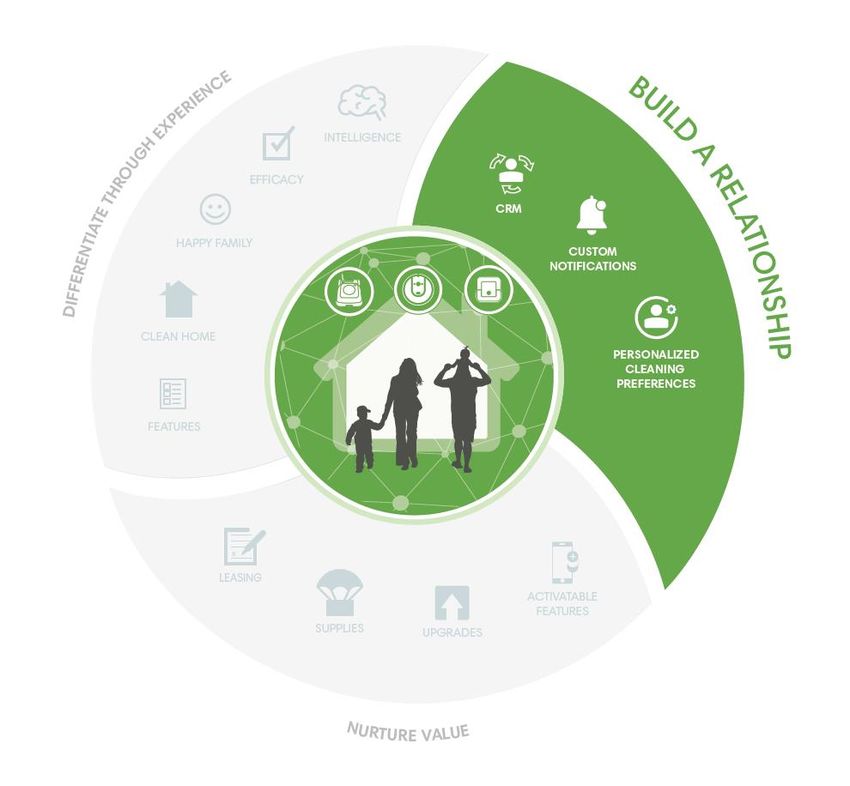
Robust Product Portfolio Spans Range of Price Points
                     Roomba s9 / s9+                                      Roomba i7 /              i7+                Roomba 900                                Braava jet m6
                                   $899       $1,099                                   $599      $799                                       $499                                $499
BEST

                                   with Clean Base™                                    with Clean Base™                                     vSLAM Advanced                      vSLAM Advanced Navigation
                                   Automatic Dirt Disposal                             Automatic Dirt Disposal                              Navigation                          ImprintTM Smart Mapping
                                   ImprintTM Smart Mapping                             ImprintTM Smart Mapping                              Recharge & Resume                   Multi-room, large space coverage
                                   vSLAM Advanced Navigation                           vSLAM Advanced Navigation                            Coverage maps                       Home Base unit for recharging
                                   Recharge & Resume                                   Recharge & Resume                                    5x the air power*
                                   40x the air power*                                  10x the air power*

                                   Introduced in May 2019                              Introduced in September 2018                                                             Introduced in May 2019

                                  Roomba e5                                                             Braava jet 380t
 BETTER

                                                          $375
                                                          3-Stage Cleaning System
                                                                                                                       $299
                                                                                                                       Ideal for larger spaces
                                                                                                                                                                   Introduce innovation
                                                          Dual Multi-Surface Rubber Brushes
                                                          5x the air power
                                                                                                                       iAdapt 2.0 Navigation
                                                                                                                       Turbo charge cradle                          in flagship product
                                                          Introduced in September 2018

                                                                                                                                                                      Flow innovation
                                 Roomba 675                                                              Braava jet 240                                              across lower price
GOOD

                                                       $299
                                                       3-Stage Cleaning System
                                                                                                                          $199
                                                                                                                          Precision jet spray
                                                                                                                                                                       point products
                                                       Dual Multi-Surface Rubber Brushes                                  iAdapt 2.0 Navigation
                                                                                                                          Optimized for smaller spaces

                                                                                                                                                                        June 2020               9
            * Compared to Roomba 600 series
Mix Shifts Toward Higher-End Products
                                           Product Revenue Mix
                        100%

                         90%                                                       s9/s9+       i7/i7+                   Braava jet m6

High-end                 80%

                         70%
                                                                                    Roomba i7 & s9 and Braava m6
                                                                                    Continue to Gain Recognition as
                                                                                   GAME-CHANGING ROBOTS
                         60%

 Mid-tier                50%

                         40%

                         30%

                         20%
      Entry              10%

                             0%
                                  FY16   FY17       FY18         FY19   FY20 YTD

RVCs $200+ (based on MSRP)
High-end defined as $500+
Mid-tier defined as $300-$500                                                                  Best Health Innovations   Best Robot Mop EVER Built!
                                                                                                For The Home 2019
Entry defined as $200-$300

                                                                                                       June 2020               10
State-of-the-Art Robot AI and Home Understanding
200+
Powering Differentiated Digital Features and Experiences
Patents related to
Our Home Understanding captures the context of the home
̶ Physical layout through Smart Maps
̶ Home activity insights through smart home device integrations
Robot AI &
Home Understanding
S T R O N G PA R T N E R S
Our Robot AI intelligently controls the robot’s actions
̶ Adapts to a given user’s home & activities
̶ Combination of home understanding, advanced computer vision and machine learning
AI innovation helps drive differentiated user experience THOUGHT LEADERSHIP
̶ Continuous improvement of our product’s performance
̶ Unlocks expansive range of user benefits (greater control over the “when, where and how”)
Fits seamlessly into the owner’s lifestyle
̶ Directed Commands & Responsive Behavior:
̶ Customizable Settings: “clean here but not here” through Clean Zones & Keep Out Zones
June 2020 11Fortifying and Expanding Our Segment Leadership …
THREE STRATEGIC GOALS:

                         “A focus on elevating the
                         cleaning experience
                         through digital capabilities
                         that enable users to
                         customize how, when and
                         where our robots clean.”
Software & AI are the Catalysts To Winning
EXTENDS ACROSS SPEED TO MARKET DEFENDABLE
ENTIRE PORTFOLIO
Average product
30M+ 9M+
release cycle is
Robots Connected
Sold Robots
INTELLIGENT USER
Average software CENTRICITY
release cycle is
on top of physical product
1500+
3 MONTHS* 5M+
5M+
Engaged
1500+
Patents
Engaged Patents
Owners
* Current
June 2020 14Integration into the Consumer’s Lifestyle
June 2020 15“We can uniquely identify both our customers’ true needs, and what parts of the experience enabled by our robots they value the most.”
Driving Personalization of the Experience
                                                                                                       You can tell Roomba to go to specific spots to clean up messes
                                                                                                       right away:

                                                                                             Unique
                                                                                        Partnerships

                                                                      Smart Home
                                                                      Integrations

Roomba learns your routine and makes suggestions that fit your life
Data science driving richer personalization
                                                                                             Home
                                                                                     Understanding

                                                                      Personalization

                                                                                                                                            June 2020               17
Strong Growth of Engaged, Connected Customer Base
Continual OTA updates help drive growth of owners who opt-in to receive digital communications
Connected, Engaged Owners
6.0
(in millions)
Q120
5+m
4.0 As Roomba becomes
increasingly
integrated into the
2.0 owner’s life,
it solidifies iRobot’s
relationship with the
- owner
2017 2018 2019 2020 YTD
June 2020 18“With increased loyalty comes increased opportunity.”
Well-Position to Succeed                                                                                Home
                                                                                                              Map
                                                                                            Experiential
                                                                                           Differentiation   Smart Home
                                        Build                                                                Integrations

                                      Installed
                                        Base                                                        Exclusive
                                                                                                   Partnerships

Able to grow our connected                    Able to engage customer                      Able to build strong long-
installed base at scale                       with our outreach                            term loyalty/stickiness
•   Retail remains important, offering        •   WiFi-connectivity across the portfolio   •   Strong brand preference, high NPS
    efficient customer acquisition at scale
                                              •   High connection rate                     •   Product experience is rapidly
•   Compelling strategy for sustained                                                          becoming more sticky
                                              •   Continued growth of owners who
    differentiation
                                                  opt-in to our communications             •   Commitment to data privacy
                                                                                                             June 2020    20
Potential to Scale Direct-to-Consumer Sales Channel
Direct to Consumer Revenue
• Increase transactional velocity for ($ in millions)
product upgrades and cross-selling $75
$70.5
10%
• Leverage robust usage data to drive
accessory sales $60 +47% 8%
• Pilot new offerings to increase purchase $48.0
flexibility and create new recurring $45
+30%
6%
6%
revenue streams $36.8
̶ Care as a Service $30
4%
4% 4%
̶ Digital as a Service
$15 2%
̶ Robotic Cleaning as a Service
$- 0%
2017 2018 2019
Direct to Consumer Direct to Consumer %
June 2020 21Chief Supply Chain Officer?
COVID-19 PANDEMIC
NAVIGATING CHALLENGING
MARKET CONDITIONS
$$ $ $ $ $
TARIFFS
$ $ $ $
$
COMPETITIONCOVID-19 Interjects Unprecedented Challenges
iRobot withdrew original 2020 guidance
COVID-19 directly and indirectly $30m cost-reduction initiative to
impacts all aspects of our business recalibrate and realign resources
• Q120 revenue below original targets • Reduced headcount 5% and pared back
spending in other areas
• Uncertain economic environment is likely to
weigh heavily on consumer spending • Shifting R&D resources to software
• Retailers striving to carefully manage • Suspended Terra robot mower launch
inventory amid difficult operating environment
• Accelerating direct-to-consumer initiatives
• Limited visibility into timing and magnitude of
orders • All other product and digital roadmaps funded
and on schedule
Anticipated Q220 Performance Highlighted by
Substantially Stronger-than-Expected Quarterly Revenue
June 2020 23Tariff Exclusion &
Manufacturing Diversification Update
Tariff exclusion granted on April 24, 2020
• Removes 25% on Roomba and other RVCs
• Entitled to a refund on $57 million for prior tariff payments
since September 2018
̶ $47 million on robots sold since 9/18
̶ $10 million for products in inventory
• Exclusion will benefit Q220 gross margin
• Exclusion set to expire in August 2020
̶ Eligible to apply for a 12-month extension
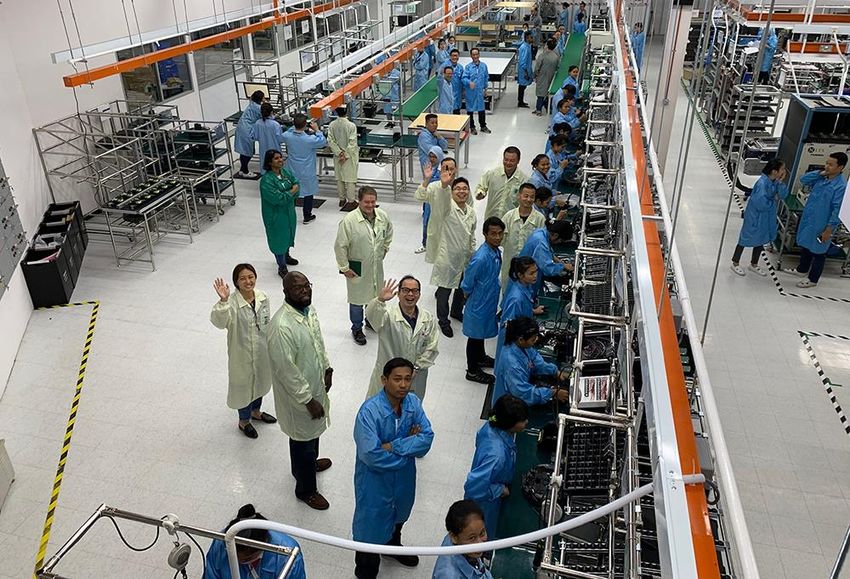
• Ramping Malaysia manufacturing volumes
but COVID-19 slows potential progress
June 2020 24Optimism for a Stronger 2H20
Moving forward with limited visibility
• iRobot is well positioned to benefit as market conditions improve
̶ Q220 performance better than expected due primarily to substantially stronger-
than-anticipated quarterly revenue
̶ Through May 2020, iRobot sell-through in units has strengthened in the US,
remained positive in EMEA and has recently started to improve in Japan
̶ Robust order growth for the Roomba i7 and s9, and Braava jet m6
̶ Through Week 16, robust growth on iRobot.com and with e-tailers more broadly
̶ Through Week 16, faring modestly better than anticipated with U.S. retailers with
extensive brick and mortar footprints
• Positioned to move into 2H with low inventory and rising
demand for our premium offerings
• Stronger 2H20 revenue (vs. 1H20) combined with cost-savings and
potential tariff extension will aid return to operating profitability
• Solid financial foundation with $264 million in cash and
investments, no debt and access to $150 million unsecured revolving
line of credit with additional $75 million accordion feature
June 2020 25Framework for
DRIVING
IMPROVED
GROSS SUBSCRIPTIONS CROSS-SELL & UPSELL FULFILLMENT SCALE &
EFFICIENCY
MARGIN
OVER
TIME
TARIFF EXCLUSION HIGHER SOFTWARE MANUFACTURING
CONTENT & COST- CHAIN EFFICIENCY
OPTIMIZED HARDWARE
June 2020 26Summary
Category creator, innovator and leader in Robotic Floor Care & AI NASDAQ:
̶ Strong revenue growth with continued runway IRBT
̶ Consistent innovation, category leadership and portfolio expansion
̶ Cutting-edge robotic AI and home understanding
Accelerating strategic initiatives aimed at
̶ Differentiating the cleaning experience Market Cap:
̶ Building direct relationships with 5+m connected, engaged owners
̶ Nurturing lifetime value of customer relationships
$1.7B*
Taking actions to navigate challenging market conditions
̶ Recalibrating spending Headquarters in
̶ Investing to scale our direct-to-consumer sales channel
̶ Well-positioned to drive sustainable, profitable growth Bedford, MA,
June 2020 27Thank you!
Any questions?
June 2020 28APPENDIX
June 2020 29Non-GAAP Financial Measures
Our non-GAAP financial measures reflect adjustments based on the following items.
• Amortization of acquired intangible assets: Amortization of acquired intangible assets consists of amortization of intangible assets including completed technology, customer relationships,
and reacquired distribution rights acquired in connection with business combinations. Amortization charges for our acquisition-related intangible assets are inconsistent in size and are
significantly impacted by the timing and valuation of our acquisitions. We exclude these charges from our non-GAAP measures to facilitate an evaluation of our current operating
performance and comparisons to our past operating performance.
• Net Merger, Acquisition and Divestiture (Income) Expense: Net merger, acquisition and divestiture (income) expense primarily consists of transaction fees, professional fees, and transition
and integration costs directly associated with mergers, acquisitions and divestitures. It also includes business combination adjustments including adjustments after the measurement period
has ended. The occurrence and amount of these costs will vary depending on the timing and size of these transactions. We exclude these charges from our non-GAAP measures to
facilitate an evaluation of our current operating performance and comparisons to our past operating performance.
• Stock-Based Compensation: Stock-based compensation is a non-cash charge relating to stock-based awards. We exclude this expense as it is a non-cash expense, and we assess our
internal operations excluding this expense and believe it facilitates comparisons to the performance of other companies.
• IP Litigation Expense, Net: IP litigation expense, net relates to legal costs incurred to litigate patent, trademark, copyright and false advertising infringements, or to oppose or defend
against interparty actions related to intellectual property. Any settlement payment or proceeds resulting from these infringements are included or netted against the costs. We exclude
costs from our non-GAAP measures as we do not believe these costs have a direct correlation to the operations of our business and may vary in size depending on the timing and results
of such litigations and settlements.
• Gain/Loss on Strategic Investments: Gain/loss on strategic investments includes fair value adjustments, realized gains and losses on the sales of these investments and losses on the
impairment of these investments. We exclude these items from our non-GAAP measures because we do not believe they correlate to the performance of our core business and may vary
in size based on market conditions and events. We believe that the exclusion of these gains or losses provides investors with a supplemental view of our operational performance.
• Income tax adjustments: Income tax adjustments include the tax effect of the non-GAAP adjustments, calculated using the appropriate statutory tax rate for each adjustment. We reassess
the need for any valuation allowance recorded based on the non-GAAP profitability and have eliminated the effect of the valuation allowance recorded in the U.S. jurisdiction. We also
exclude certain tax items that are not reflective of income tax expense incurred as a result of current period earnings. These certain tax items include, among other non-recurring tax items,
impacts from the Tax Cuts and Jobs Act of 2017 and stock-based compensation windfalls/shortfalls. We believe disclosure of the income tax provision before the effect of such tax items is
important to permit investors' consistent earnings comparison between periods.
June 2020 30GAAP-Non-GAAP Reconciliation
Q1 2020 GAAP Actuals to Q1 2019 Non-GAAP Actuals
iRobot Corporation
Supplemental Reconciliation of GAAP Actuals to Non-GAAP Actuals
(in thousands, except per share amounts)
(unaudited)
For the three months ended
March 28, 2020 March 30, 2019
GAAP Revenue $ 192,535 $ 237,661
GAAP Gross Profit $ 77,955 $ 119,546
Amortization of acquired intangible assets 285 3,077
Stock-based compensation 527 378
Non-GAAP Gross Profit $ 78,767 $ 123,001
Non-GAAP Gross Profit Margin 40.9 % 51.8 %
GAAP Operating Expenses $ 98,180 $ 97,283
Amortization of acquired intangible assets (254) (271)
Stock-based compensation (4,664) (6,486)
Net merger, acquisition and divestiture (income) expense 500 (152)
IP litigation expense, net (615) (469)
Non-GAAP Operating Expenses $ 93,147 $ 89,905
Non-GAAP Operating Expenses as a % of Non-GAAP Revenue 48.4 % 37.8 %
GAAP Operating (Loss) Income $ (20,225) $ 22,263
Amortization of acquired intangible assets 539 3,348
Stock-based compensation 5,191 6,864
Net merger, acquisition and divestiture (income) expense (500) 152
IP litigation expense, net 615 469
Non-GAAP Operating (Loss) Income $ (14,380) $ 33,096
Non-GAAP Operating Margin (7.5)% 13.9 %
GAAP Income Tax (Benefit) Expense $ (2,109) $ 1,023
Tax effect of non-GAAP adjustments (1,831) 1,824
Other tax adjustments (1,384) 4,067
Non-GAAP Income Tax (Benefit) Expense $ (5,324) $ 6,914
GAAP Net (Loss) Income $ (18,135) $ 22,520
Amortization of acquired intangible assets 539 3,348
Stock-based compensation 5,191 6,864
Net merger, acquisition and divestiture (income) expense (500) 152
IP litigation expense, net 615 469
(Gain) loss on strategic investments (87) 57
Income tax effect 3,215 (5,891)
Non-GAAP Net (Loss) Income $ (9,162) $ 27,519
GAAP Net (Loss) Income Per Diluted Share $ (0.64) $ 0.78
Amortization of acquired intangible assets 0.02 0.12
Stock-based compensation 0.19 0.24
Net merger, acquisition and divestiture (income) expense (0.02) -
IP litigation expense, net 0.02 0.02
(Gain) loss on strategic investments - -
Income tax effect 0.11 (0.20)
Non-GAAP Net (Loss) Income Per Diluted Share $ (0.32) $ 0.96
Number of shares used in diluted per share calculation 28,297 28,763
Section 301 Tariff Costs
Section 301 tariff costs $ 6,609 $ 3,518
Impact of Section 301 tariff costs to gross and operating margin (GAAP &
non-GAAP) (3.4)% (1.5)%
Impact of Section 301 tariff costs to net (loss) income per diluted share
(GAAP & non-GAAP) $ (0.23) $ (0.12)
Supplemental Information
Days sales outstanding 18 21
Days in inventory 118 144
June 2020 31GAAP-Non-GAAP Reconciliation
2019 GAAP Actuals to 2019 Non-GAAP Actuals
In thousands, except per share and % amounts
Unaudited For the twelve
For the three months ended months ended
March 30, September 28, December 31, December 31,
2019 June 29, 2019 2019 2019 2019
GAAP Revenue $ 237,661 $ 260,172 $ 289,399 $ 426,778 $ 1,214,010
GAAP Gross Profit 119,546 118,170 136,841 169,370 543,927
Amortization of acquired intangible assets 3,077 3,111 3,095 2,438 11,721
Stock-based compensation 378 405 337 366 1,486
Non-GAAP Gross Profit $ 123,001 $ 121,686 $ 140,273 $ 172,174 $ 557,134
Non-GAAP Gross Profit Margin 51.8 % 46.8 % 48.5 % 40.3 % 45.9 %
GAAP Operating Income $ 22,263 $ 5,250 $ 42,555 $ 16,550 $ 86,618
Amortization of acquired intangible assets 3,348 3,380 3,351 2,693 12,772
Stock-based compensation 6,864 7,594 4,284 5,001 23,744
1
Net merger, acquisition and divestiture (income) expense 152 143 32 138 466
IP litigation expense, net 1 469 (676) (157) 2,582 2,218
Non-GAAP Operating Income $ 33,096 $ 15,691 $ 50,065 $ 26,964 $ 125,818
Non-GAAP Operating Income Margin 13.9 % 6.0 % 17.3 % 6.3 % 10.4 %
GAAP Income Tax (Benefit) Expense $ 1,023 $ (424) $ 7,923 $ 5,011 $ 13,533
Tax effect of non-GAAP adjustments 1,824 1,797 (132) 1,159 4,648
Other tax adjustments 4,067 1,461 133 1,267 6,928
Non-GAAP Income Tax Expense $ 6,914 $ 2,834 $ 7,924 $ 7,437 $ 25,109
GAAP Net Income $ 22,520 $ 7,207 $ 35,532 $ 20,041 $ 85,300
Amortization of acquired intangible assets 3,348 3,380 3,351 2,693 12,772
Stock-based compensation 6,864 7,594 4,284 5,001 23,744
1
Net merger, acquisition and divestiture (income) expense 152 143 32 138 466
1
IP litigation expense, net 469 (676) (157) 2,582 2,218
(Gain)/loss on strategic investments 57 (629) - (8,332) (8,904)
Income tax effect (5,891) (3,258) (1) (2,426) (11,576)
Non-GAAP Net Income $ 27,519 $ 13,761 $ 43,041 $ 19,697 $ 104,020
GAAP Net Income Per Diluted Share $ 0.78 $ 0.25 $ 1.24 $ 0.70 $ 2.97
Amortization of acquired intangible assets 0.12 0.12 0.12 0.09 0.44
Stock-based compensation 0.24 0.26 0.15 0.18 0.83
Net merger, acquisition and divestiture (income) expense 1 - - - - 0.01
IP litigation expense, net 1 0.02 (0.02) (0.01) 0.09 0.08
(Gain)/loss on strategic investments - (0.02) - (0.29) (0.31)
Income tax effect (0.20) (0.11) - (0.08) (0.40)
Non-GAAP Net Income Per Diluted Share $ 0.96 $ 0.48 $ 1.50 $ 0.69 $ 3.62
Number of shares used in diluted per share calculation 28,763 28,763 28,650 28,563 28,735
Certain numbers may not total due to rounding
1
Net merger, acquisition and divestiture (income) expense and IP litigation, net are classified in General and Administrative
June 2020 32GAAP-Non-GAAP Reconciliation
2018 GAAP Actuals to 2018 Non-GAAP Actuals
For the twelve
In thousands, except per share and % amounts For the three months ended months ended
Unaudited March 31, September 29, December 29, December 29,
2018 June 30, 2018 2018 2018 2018
GAAP Revenue $ 217,068 $ 226,317 $ 264,534 $ 384,665 $ 1,092,584
GAAP Gross Profit 115,785 117,926 135,206 186,511 555,428
Amortization of acquired intangible assets 4,782 4,679 4,574 4,509 18,544
Stock-based compensation 341 347 347 372 1,407
Non-GAAP Gross Profit $ 120,908 $ 122,952 $ 140,127 $ 191,392 $ 575,379
Non-GAAP Gross Profit Margin 55.7 % 54.3 % 53.0 % 49.8 % 52.7 %
GAAP Operating Income $ 25,405 $ 13,355 $ 37,275 $ 29,787 $ 105,822
Amortization of acquired intangible assets 5,055 4,948 4,837 4,769 19,609
Stock-based compensation 5,946 6,431 6,592 6,835 25,804
Net merger, acquisition and divestiture (income) expense 1 (141) 164 - 115 138
IP litigation expense, net 1 2,571 759 187 39 3,556
Non-GAAP Operating Income $ 38,836 $ 25,657 $ 48,891 $ 41,545 $ 154,929
Non-GAAP Operating Income Margin 17.9 % 11.3 % 18.5 % 10.8 % 14.2 %
GAAP Income Tax (Benefit) Expense $ 5,523 $ 4,391 $ 5,683 $ 5,033 $ 20,630
Tax effect of non-GAAP adjustments 3,340 2,830 2,835 2,849 11,854
Other tax adjustments 712 (2,440) 2,667 1,170 2,109
Non-GAAP Income Tax Expense $ 9,575 $ 4,781 $ 11,185 $ 9,052 $ 34,593
GAAP Net Income $ 20,401 $ 10,471 $ 31,929 $ 25,191 $ 87,992
Amortization of acquired intangible assets 5,055 4,948 4,837 4,769 19,609
Stock-based compensation 5,946 6,431 6,592 6,835 25,804
Net merger, acquisition and divestiture (income) expense 1 (141) 164 - 115 138
IP litigation expense, net 1 2,571 759 187 39 3,556
(Gain)/loss on strategic investments 281 (682) 26 (61) (436)
Income tax effect (4,052) (390) (5,502) (4,019) (13,963)
Non-GAAP Net Income $ 30,061 $ 21,701 $ 38,069 $ 32,869 $ 122,700
GAAP Net Income Per Diluted Share $ 0.71 $ 0.37 $ 1.12 $ 0.88 $ 3.07
Amortization of acquired intangible assets 0.17 0.17 0.17 0.17 0.69
Stock-based compensation 0.20 0.23 0.23 0.24 0.90
Net merger, acquisition and divestiture (income) expense 1 - - - - -
IP litigation expense, net 1 0.09 0.03 0.01 - 0.13
(Gain)/loss on strategic investments 0.01 (0.02) - - (0.02)
Income tax effect (0.14) (0.01) (0.19) (0.14) (0.49)
Non-GAAP Net Income Per Diluted Share $ 1.04 $ 0.77 $ 1.34 $ 1.15 $ 4.28
Number of shares used in diluted per share calculation 28,923 28,337 28,506 28,579 28,640
Certain numbers may not total due to rounding
1
Net merger, acquisition and divestiture (income) expense and IP litigation, net are classified in General and Administrative
June 2020 33You can also read