ACCELERATED DELIVERY TO OUR GO-FORWARD BANK - ROSS MCEWAN CHIEF EXECUTIVE OFFICER - INVESTORS - RBS

Page created by Victoria Lynch
 
CONTINUE READING
ACCELERATED DELIVERY TO OUR GO-FORWARD BANK - ROSS MCEWAN CHIEF EXECUTIVE OFFICER - INVESTORS - RBS
Accelerated delivery to our
Go-Forward Bank
Ross McEwan
Chief Executive Officer

Bank of America – Merrill Lynch conference   London, 29 September 2015
ACCELERATED DELIVERY TO OUR GO-FORWARD BANK - ROSS MCEWAN CHIEF EXECUTIVE OFFICER - INVESTORS - RBS
Our blueprint for lasting success

(1) During the period of CIB restructuring. (2) Excludes restructuring, conduct, litigation and intangible write-off charges as well as the operating costs of Citizens Financial Group and Williams & Glyn.   (3)   Global Financial   1
Services (GFS) norm currently stands at 83%.
ACCELERATED DELIVERY TO OUR GO-FORWARD BANK - ROSS MCEWAN CHIEF EXECUTIVE OFFICER - INVESTORS - RBS
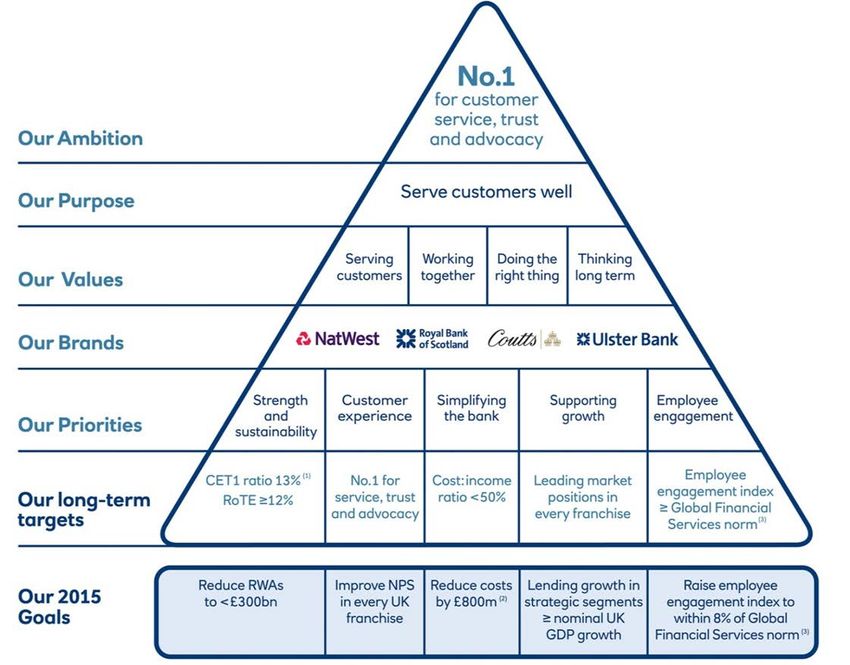
Building long-term shareholder value

                       Phase 1 – 2014                                                                                                                            Phase 3 – 2017 to 2019
                                                                                      Phase 2 – 2015/16

                Building financial strength                                                                                                                               Becoming #1
                                                                            Improve our Go-Forward Bank
                                                                             and accelerate our Exit Bank
            Rebuild capital strength –                                                                                                                      Cement customer-centric
             CET1 ratio +260bps                                                                                                                               positioning – #1 for customer
             during 2014                                              Accelerate the transformation                                                          service, trust and advocacy
                                                                                                                                                              by 2020
            De-risk – US ABP, RCR,                                    of our Go-Forward Bank
             NPLs, liquidity portfolio                                                                                                                       Achieve attractive, balanced

            Start cost reduction plan –
                                                                      Achieve material RWA reduction                                                         and sustainable financial
                                                                                                                                                              returns – target 12+% ROTE
             £1.1bn savings achieved                                   in our Exit Bank                                                                       in 2019

            Simplify our organisational
             structure – 7 divisions to 3                             Address other material
             franchises                                                remaining issues within
                                                                       our control

                                                                                                                          Discussions around resumption
                                                                                                                           of dividends / buy-backs(1)

                                                                                                                          Pay out surplus capital above 13% CET1
                                                                                                                           ratio subject to PRA approval(1)

(1) Subject to PRA approval. In addition, key milestones before seeking PRA approval for capital distributions would include, among other considerations, reaching the 13% CET1 ratio target, achieving confidence in   2
sustainable profitability, improved stress-testing results and operating within risk appetite, peak of litigation and conduct costs passed and at least £2 billion of AT1 raised.
ACCELERATED DELIVERY TO OUR GO-FORWARD BANK - ROSS MCEWAN CHIEF EXECUTIVE OFFICER - INVESTORS - RBS
Our Go-Forward Bank
UK focused Retail & Commercial bank
     With Markets and international capabilities to meet our clients’ needs,
     primarily focusing to support their UK and Western European operations

     Business mix shift towards the UK…                                                                                    …with emphasis on Retail & Commercial

     Illustrative split by total income                                           Non-UK                  UK              Illustrative split by RWAs                                   CIB(1)      R&C

                                                                                             ~10%                                                                                                  ~15%
                                                    ~35%                                                                                                                   ~30%
                 ~60%                                                                                                                  ~50%

                                                                                             ~90%                                                                                                  ~85%
                                                                                                                                                                           ~70%
                                                    ~65%                                                                               ~50%
                 ~40%

                  2008                           Current(2)                           Go-Forward(3)                                     2008                              Current(2)            Go-Forward(3)

(1) Wholesale   defined as GBM in 2008 and CIB for current and Go-Forward   (2)   Current are the FY 2014 numbers includes Citizens   (3)   Go-Forward defined as 2019.                                     3
Our Go-Forward Bank
RBS in 2019
                                   Personal &              Commercial &            Corporate &
                                    Business                 Private               Institutional

              Our
           Customers

                 Our
               Primary
               Brands

                              #2 UK Personal Current    #1 SME Bank           Top 3 UK Rates, FX and
                               Accounts                                         DCM
                                                         #1 UK Commercial
               Our            #3 Ireland(1) Personal    Bank                   Top 3 European
              Market           Current Accounts                                 Structured Finance
                                                         #1 UK Private Bank
             Positions        #2 UK Business Bank                              Top 3 Western Europe
                               main relationship                                Investment Grade
                                                                                Corporate DCM
(1)
                                                                                                        4
      Republic of Ireland.
Our Exit Bank
Rapid reduction in Exit Group RWAs expected
Illustrative run-down of RBS Exit Group RWA, £bn

                                  -80%
                  172             148

                                                   ~30-40

                FY 2014         H1 2015       FY 2016 target

                                                               5
Good progress against 2015 goals

                             Priorities                                                              2015 Goals                                                                      H1 Progress

                                                                               RWAs reduced to below £300bn                                                     £326bn RWAs

                                                                               RCR exit substantially complete                                                  Funded assets down 78% since
1      Strength & sustainability
                                                                               Citizens exit
                                                                                                                                                                     initial pool of assets identified(1)
                                                                                                                                                                 Further sell-down priced in late July 2015(2)
                                                                               AT1 issuance (£2bn)
                                                                                                                                                                  £2bn AT1 issued

                                                                                                                                                                 Over £700m annualised cost savings
2                                                                              Cost reduction of £800m(5)
        Simplifying the bank                                                                                                                                         achieved in H1

                                                                               Net Promote Score (NPS) improvement                                              Improvements in NatWest Personal.
                                                                                                                                                                     NatWest Business, RBS Business(3) Ulster
3       Customer experience                                                        in every UK customer franchise                                                    Bank Personal (Northern Ireland)(4)

                                                                               Lending growth in strategic segments                                             2% annualised growth in UK PBB and
4       Supporting growth                                                          in line with nominal UK GDP growth                                                Commercial Banking

(1) Funded assets are down 71% since 1 Jan 2014. (2) Following the offering RBS will deconsolidate Citizens for accounting purposes from Q3 but will continue to consolidate 100% of RWAs for regulatory purposes. (3) Further

details in slide 13 (4) Source: Internal research – Coyne Research June 15 based on 4 quarter roll with latest base size 365. (5) Excludes restructuring, conduct, litigation and intangible write-off charges as well as the operating   6
costs of Citizens Financial Group and Williams & Glyn.
1. Strength & Sustainability
Operating Costs Consistently Reduced
       Adjusted cost reduction progression (£m) (1)

                                             -12%                                       -20%
                    14,010                                                   6,859
                                                                   12,398               6,344
                                                                                                          5,485

                      2013                                           2014   H1 2013    H1 2014           H1 2015
         Significant future cost opportunities:
                           - Reducing costs in currently very high cost:income franchises (primarily CIB but also
                                  Ulster and Private)
                           - Operational improvements in UK PBB and Commercial Banking
(1) Adjusted   costs excluding restructuring and conduct and litigation.                                            7
1. Strength & Sustainability
Continue to invest >£1bn per annum in improving IT
Transformation Plan

         Strategic Theme                                                                      2015 Target (£m)                                         2015 – 2017 Target (£m)

         Strength & Sustainability                                                                           (640)                                                      (1,560)

         Employee Engagement                                                                                   (90)                                                      (190)

         Simplifying the Bank                                                                                (200)                                                       (590)

         Customer Experience &
                                                                                                             (410)                                                      (1,150)
         Supporting Growth

                                                                    Total                                (1,340)(1)                                                    (3,490)(1)

(1)   Excludes investment in property exits & refurbishments (~£650m), ‘Other Discretionary’ (~£550m) and W&G and ICB investment (~£1.5bn). Rounded to nearest £10m.                8
1. Strength & Sustainability
Capital and balance sheet resilience

       CET1 Ratio: 13% Target                                                                        Leverage Ratio                                                     Non-Performing Loans £bn
                                                                                                                                                                                (Risk Elements in Lending)
                                                                                                                                                                                 (as % of Gross L&As)

                                                 15.3%(1)                                                                            5.3%(2)                             39.4
                                                                                                                                       0.7%                             (9.4%)                   -53%
              +670bps                                3.0%                                       +190bps

                                                                                      3.4%                                                                               RCR
    8.6%                                                                                                                                                                 24.1
                                                                                                                                                                        (5.8%)                                              18.7
                                                                                                                                                                                                                            (4.8%)
                                                                                                                                       4.6%
                                                    12.3%                                                                                                                                                                    7.4
                                                                                                                                                                          Ex
                                                                                                                                                                         RCR
                                                                                                                                                                                                                            11.3
                                                                                                                                                                         15.3                                               (3.0%)
                                                                                                                                                                        (3.7%)

Q4 2013                                          Q2 2015                          Q4 2013                                          Q2 2015                        Q4 2013(3)                                          Q2 2015

(1) Pro-forma impact of the full disposal of Citizens at 30 June 2015. Assumes full removal of RWAs excluding operational risk and, for simplicity, no capital gains or losses assumed. (2) Pro-forma basis, assuming the

divestment of Citizens and including the benefit of AT1 issuance. (3) RCR was created on 1st January 2014. Q4 2013 assumes the numbers have not moved between the 31st December 2013 and 1st January 2014.
                                                                                                                                                                                                                                   9
2. Simplifying the Bank
 Click to edit Master title style
We are becoming simpler
  Total Number of Properties(1)                                                                                   Number of Programmes
                                -14%                       -16%                                                                                           -67%
                 2,900                                                                                                                         550
                                         2,500
                                                                2,100                                                                                                                 -18%

                                                                                 1,500                                                                                182
                                                                                                                                                                                               150

                   2013                   2014                  2015                2016                                                       2013                  2014                      2015
  Number of products(2)                                                                                          Number of registered companies
                                                                                                                                                       -6%
                         -32%                                                  -22%
                                                                                                                                        1050
       295                                                     144              146                                                                                 984          -14%
                         266
                                                                                                                                                                                                849
                                        200                                                   112
                                                                                                                                                                       X

        2014              H1            End                     2014             H1            End
                         2015           2015                                    2015           2015
                                                                                                                                       H1 2014                       2014                    H1 2015
                     Front Book                                              Back Book

(1) Whole bank including branches and head office properties. Williams & Glyn included up to end 2015. (2) Excludes CIB and GTS. Notes: The objectives set on this slide are forward looking statements - See the last page   10
of this presentation.
                                                                                                                                                                                                                                   11
3. Customer experience
Our customers deserve the optimum experience

         Stronger                Simpler                 Fairer
                        Apple Pay             Stopped teaser
UK & Ireland                                  rates/zero balance
                        availability &
focused bank                                  transfers
                        Apple Watch app

IT resilience and                             Retail & Business
                        Touch ID login
security; mirror bank                         T&C’s on 1 side
enabled                                       of A4

                        Real time app
                                              Accessible
                        registration as
Transformation plan -                         overdrafts for a
                        current account
£3.5bn to be invested                         further 600k
over 3 years            opened
                                              customers

                        Faster, more local    Reward current
Investing in our
                        lending decisions &   account launched,    3%
                        quicker current       cashback on       cashback
leadership culture                            household bills
                        account opening

                                                                        11
3. Customer experience
 Tailoring our business to changing behaviours

               Over 1000% growth in                     16 branch transformations
               mobile usage since 2010                  per week

               ~3m active mobile                        93% of branches re-branded
               customers                                by end of 2016

End of 2013         447                  3,973            0               6,106

   Our
expanding
presence      communities served   self service   banking points        Total points
              by mobile bank       points         available via Post    of presence
              vans                                Office

End of 2015         639                  5,544         11,500             19,010
                                                                                    12
3. Customer experience
 Focus on our customers is starting to deliver results
                                                                                                                                                                                                     Royal Bank of Scotland (Scotland)
      Net Promoter Scores across our core businesses                                                                                                                                                 NatWest (England & Wales)
                                                                                                                                                                                                     RBSG (GB)

                             Personal Banking(1)                                                  Business Banking(2)                                             Commercial Banking(3)
       30

       20                                                                                                                                                                              12            12
                                                                                                                                                            9            10                                        10

       10                          7                                           8
                                                 6              5                                                                       4
                    4

        0
                                  (4)                                                                                       (6)

                  (10)                                                       (10)                              (11)
     (10)                                                                                           (13)
                                               (13)                                     (15)
                                                                                                                           (17)       (17)
                                                              (18)
     (20)                                                                                                      (23)
                                                                                                    (26)
                                                                                        (30)
     (30)

     (40)
                   Q2           Q3           Q4           Q1          Q2              Q2           Q3           Q4           Q1          Q2              Q2           Q3           Q4           Q1          Q2
                              2014                             2015                              2014                             2015                              2014                             2015

(1) Personal Banking: Source GfK FRS, 6 month roll. Latest base sizes: NatWest (3340) RBS (458) Question “How likely is it that you would be to recommend (brand) to a relative, friend or colleague in the next 12 months for current account

banking?” Base: Claimed main banked current account customers. The year on year movement in NatWest Personal NPS is significant.
(2+3)Business & Commercial Banking: Source Charterhouse Research Business Banking Survey, quarterly rolling. Latest base sizes, Business £0-2m NatWest (1219) RBS (415) Commercial 3 £2m+ combination of NatWest & RBS in GB (846)
                                                                                                                                                                                                                                               13
Question: “How likely would you be to recommend (bank)”. Base: Claimed main bank. Data weighted by region and turnover to be representative of businesses in Great Britain. The year on year improvements in Business Banking are
significant.
3. Customer experience
 Customers are responding to our investment

                     We are:                                                                                                          Customers are:
               investing in advice                                                                                                    more engaged

              Number of mortgage advisors
                                                         869
                 677                +28%
                                                                                                                                   -21%
                                                                                                                                 Mortgage                        Mortgage service
                                                                                                                                complaints                        NPS NatWest

                                                                                                                                                                             +9

             H1 2014                                  H1 2015                                                                           H1 2014 / H1 2015

Source: Internal NPS Drivers Study. Latest Bases: NatWest (1233), Question: 'Based on your experience as a (brand) Mortgage customer how likely are you to recommend a (brand) Mortgage to a relative, friend or colleague14
in the next 12 months?‘ Mortgage complaints data based on internal analysis.
4. Supporting growth
Personal and Business Banking

                    UK Personal & Business Banking – Mortgages

   Balances (£bn)               Applications (£bn)        RBS Q2 2015 market share

           +4%
                                         +43%
  101.8           105.4                           9.4                      10%
                                                               8%
                                 6.5

 Q2 2014         Q2 2015       Q2 2014          Q2 2015    Stock share   Flow share

                                                                                      15
4. Supporting growth
Commercial Banking

                          Positive net lending                        Gross UK Commercial lending growth

     Balances, £bn                                                    Q2 2015 / Q2 2014

                                         +2.1%                                             +1.6%
                         83.9                                  85.7

                                                                               -4.0%

                    Q2 2014                              Q2 2015             Market(1)      RBS
       Note : Excluding RBSI and CIB transfers.

(1) Lending   to PNFCs (Private Non-Financial Corporations).                                               16
Our Go-Forward Bank
Ulster Bank, Private Banking and CIB Go-Forward

                          CIB Go-Forward                                                     Ulster Bank                         Private Banking
                Illustrative cost:income ratio:                                      Q2 2015 Adjusted cost:income           Q2 2015 Adjusted cost:income
                                ~100%(1)                                                    ratio: 78%(1)                          ratio: 86%(1)

              CIB Go – Forward is                                                  Returns benefiting from ongoing       Great Private Banking brands,
               undergoing a multi-year                                               Irish macro recovery triggering        but returns are too low
               transformation                                                        further write-backs
                                                                                                                           Targeting material productivity
              Income is broadly in line with                                       Cost:income ratio is                   improvements, both on
               expectations given the                                                unacceptably high – aim to             revenues and costs in the
               reduction in scale and scope                                          materially reduce                      coming years

              CIB Go – Forward will require                                        Accelerated reduction of tracker      Excellent opportunities to
               re-platforming of a substantial                                       portfolio continues to reduce          leverage off Commercial
               part of its IT infrastructure in                                      return drag                            customer base
               order to operate the franchise at
               a materially lower cost structure

               Clear plan to materially reduce costs and improve productivity in the Go-
                                           Forward franchises

(1)
                                                                                                                                                              17
      Adjusted costs excluding restructuring and litigation and conduct costs.
Our Go-Forward Bank
CIB Go-Forward is built around core strengths

                                                18
Strong, clear, simple investment proposition

       Strong customer franchises in large, attractive
       banking market

       UK’s pre-eminent SME, Commercial and Corporate bank

       Significant potential upside from simplification
       and risk reduction

       Robust capital, leverage and liquidity positions

             We aim to return capital to shareholders above the 13% mid-term CET1 target(1)

(1) Subject to PRA approval. In addition, key milestones before seeking PRA approval for capital distributions would include, among other considerations, reaching the 13% CET1 ratio target, achieving confidence in   19
sustainable profitability, improved stress-testing results and operating within risk appetite, peak of litigation and conduct costs passed and at least £2 billion of AT1 raised.
Forward Looking Statements

Certain sections in this document contain ‘forward-looking statements’ as that term is defined in the United States Private Securities Litigation Reform Act of 1995, such as statements that include the words
‘expect’, ‘estimate’, ‘project’, ‘anticipate’, ‘believe’, ‘should’, ‘intend’, ‘plan’, ‘could’, ‘probability’, ‘risk’, ‘Value-at-Risk (VaR)’, ‘target’, ‘goal’, ‘objective’, ‘may’, ‘endeavour’, ‘outlook’, ‘optimistic’, ‘prospects’ and
similar expressions or variations on these expressions.
In particular, this document includes forward-looking statements relating, but not limited to: The Royal Bank of Scotland Group plc’s (RBS) transformation plan (which includes RBS’s 2013/2014 strategic plan
relating to the implementation of its new divisional and functional structure and the continuation of its balance sheet reduction programme including its proposed divestments of Citizens Financial Group, Inc.
(“CFG”) and Williams & Glyn, RBS’s information technology and operational investment plan, the proposed restructuring of RBS’s CIB business and the restructuring of RBS as a result of the implementation of
the regulatory ring-fencing regime, together the “Transformation Plan”), as well as restructuring, capital and strategic plans, divestments, capitalisation, portfolios, net interest margin, capital and leverage ratios,
liquidity, risk-weighted assets (RWAs), RWA equivalents (RWAe), Pillar 2A, Maximum Distributable Amount (MDA), total loss absorbing capital (TLAC), minimum requirements for eligible liabilities (MREL),
return on equity (ROE), profitability, cost:income ratios, loan:deposit ratios, anticipated AT1 and other capital raising plans, funding and risk profile; litigation, government and regulatory investigations including
investigations relating to the setting of interest rates and foreign exchange trading and rate setting activities; costs or exposures borne by RBS arising out of the origination or sale of mortgages or mortgage-
backed securities in the US; investigations relating to business conduct and the costs of resuiting customer redress and legal proceedings; RBS’s future financial performance; the level and extent of future
impairments and write-downs; and RBS’s exposure to political risks, credit rating risk and to various types of market risks, such as interest rate risk, foreign exchange rate risk and commodity and equity price
risk. These statements are based on current plans, estimates, targets and projections, and are subject to inherent risks, uncertainties and other factors which could cause actual results to differ materially from
the future results expressed or implied by such forward-looking statements. For example, certain market risk and other disclosures are dependent on choices relying on key model characteristics and
assumptions and are subject to various limitations. By their nature, certain of the market risk disclosures are only estimates and, as a result, actual future gains and losses could differ materially from those that
have been estimated.
Other factors that could adversely affect our results and the accuracy of forward-looking statements in this document include the risk factors and other uncertainties discussed in the 2014 Annual Report and
Accounts and the 2015 Interim Results. These include the significant risks for RBS presented by the execution of the Transformation Plan; RBS’s ability to successfully implement the various initiatives that are
comprised in the Transformation Plan, particularly the balance sheet reduction programme including the divestment of Williams & Glyn and its remaining stake in CFG, the proposed restructuring of its CIB
business and the significant restructuring undertaken by RBS as a result of the implementation of the ring fence; whether RBS will emerge from implementing the Transformation Plan as a viable, competitive,
customer-focused and profitable bank; RBS’s ability to achieve its capital targets which depend on RBS’s success in reducing the size of its business; the cost and complexity of the implementation of the ring-
fence and the extent to which it will have a material adverse effect on RBS; the risk of failure to realise the benefit of RBS’s substantial investments in its information technology and operational infrastructure
and systems, the significant changes, complexity and costs relating to the implementation of the Transformation Plan, the risks of lower revenues resulting from lower customer retention and revenue
generation as RBS refocuses on the UK as well as increasing competition. In addition, there are other risks and uncertainties. These include RBS’s ability to attract and retain qualified personnel; uncertainties
regarding the outcomes of legal, regulatory and governmental actions and investigations that RBS is subject to (including active civil and criminal investigations) and any resulting material adverse effect on
RBS of unfavourable outcomes; heightened regulatory and governmental scrutiny and the increasingly regulated environment in which RBS operates; uncertainty relating to how policies of the new government
elected in the May 2015 UK election may impact RBS including a possible referendum on the UK’s membership of the EU and the consequences arising from it; operational risks that are inherent in RBS’s
business and that could increase as RBS implements its Transformation Plan; the potential negative impact on RBS’s business of actual or perceived global economic and financial market conditions and other
global risks; how RBS will be increasingly impacted by UK developments as its operations become gradually more focused on the UK; uncertainties regarding RBS exposure to any weakening of economies
within the EU and renewed threat of default or exit by certain counties in the Eurozone; the risks resulting from RBS implementing the State Aid restructuring plan including with respect to the disposal of certain
assets and businesses as announced or required as part of the State Aid restructuring plan; the achievement of capital and costs reduction targets; ineffective management of capital or changes to regulatory
requirements relating to capital adequacy and liquidity; the ability to access sufficient sources of capital, liquidity and funding when required; deteriorations in borrower and counterparty credit quality; the extent
of future write-downs and impairment charges caused by depressed asset valuations; the value and effectiveness of any credit protection purchased by RBS; the impact of unanticipated turbulence in interest
rates, yield curves, foreign currency exchange rates, credit spreads, bond prices, commodity prices, equity prices; basis, volatility and correlation risks; changes in the credit ratings of RBS; changes to the
valuation of financial instruments recorded at fair value; competition and consolidation in the banking sector; regulatory or legal changes (including those requiring any restructuring of RBS’s operations);
changes to the monetary and interest rate policies of central banks and other governmental and regulatory bodies and continued prolonged periods of low interest rates; changes in UK and foreign laws,
regulations, accounting standards and taxes; impairments of goodwill; the high dependence of RBS’s operations on its information technology systems and its increasing exposure to cyber security threats; the
reputational risks inherent in RBS’s operations; the risk that RBS may suffer losses due to employee misconduct; pension fund shortfalls; the recoverability of deferred tax assets; HM Treasury exercising
influence over the operations of RBS; limitations on, or additional requirements imposed on, RBS’s activities as a result of HM Treasury’s investment in RBS; and the success of RBS in managing the risks
involved in the foregoing.
The forward-looking statements contained in this document speak only as of the date of this announcement, and RBS does not undertake to update any forward-looking statement to reflect events or
circumstances after the date hereof or to reflect the occurrence of unanticipated events.
The information, statements and opinions contained in this document do not constitute a public offer under any applicable legislation or an offer to sell or solicitation of any offer to buy any securities or financial
instruments or any advice or recommendation with respect to such securities or other financial instruments.
You can also read