GEOGRAPHIC INFORMATION SYSTEM FOR DROUGHT RISK MAPPING IN AUSTRALIA - DROUGHT RISK ANALYSER WEB APP
←
→
Page content transcription
If your browser does not render page correctly, please read the page content below
The International Archives of the Photogrammetry, Remote Sensing and Spatial Information Sciences, Volume XLIV-3/W1-2020, 2020
    Gi4DM 2020 – 13th GeoInformation for Disaster Management conference, 30 November–4 December 2020, Sydney, Australia (online)

               GEOGRAPHIC INFORMATION SYSTEM FOR DROUGHT RISK MAPPING IN
                      AUSTRALIA - DROUGHT RISK ANALYSER WEB APP

                                           C. Sun 1, S. Choy 1,*, Z. Chua 2, I. Aitkenhead 2, Y. Kuleshov 1,2,3,*
          1
              School of Science, RMIT University Melbourne, 3000, Australia - (chayn.sun, suelynn.choy, yuriy.kuleshov)@rmit.edu.au
      2
          Climate Risk and Early Warning Systems (CREWS), Bureau of Meteorology, Docklands, 3008, Australia – (zhi-weng.chua,
                                                   isabella.aitkenhead)@bom.gov.au
                         3
                             School of Mathematics and Statistics, The University of Melbourne, Melbourne, 3000, Australia

                                                                     Commission IV

KEY WORDS: Drought Risk Mapping; GIS, Drought Hazard; Drought Vulnerability; Drought Exposure; Drought Preparedness

ABSTRACT:

Australia frequently experiences extended periods of severe droughts which have a significant negative impact on populations and
economy. To improve preparedness for drought, decision-support tools which provide comprehensive information about current dry
conditions are essential. In this paper, we present a conceptual design for a Drought Risk Analyser (DRA) - web-based information
App for drought risk mapping developed using geographic information system (GIS). The developed DRA is based on combining
Drought Hazard/Vulnerability/Exposure Indices (DHI, DVI and DEI respectively) into a final Drought Risk Index (DRI) for total of
542 Local Government Areas (LGA) in Australia. Drought indicators selected to compute drought hazard - the Standardised
Precipitation Index (SPI), the Vegetation Health Index (VHI) and Soil Moisture - were obtained through the World Meteorological
Organization (WMO) Space-based Weather and Climate Extremes Monitoring (SWCEM) international initiative. Australian Bureau
of Statistics (ABS) census data were used to develop the drought-related population vulnerability index – DVI. Australian national
Digital Elevation Model and catchment scale land use data were used to calculate the DEI. Implemented functionality of the
designed DRA is illustrated using a case study for the 2019 drought in Australia. The DRA App will be beneficial for Australian
farmers and rural communities to assist with decision making, as well as for LGA planners to gain insights on current state of
drought risk at both local and national levels. The developed methodology of using space-based observations for assessing drought
hazard could be applied for developing similar web-based information tools in drought-prone areas of other countries.

                              1. INTRODUCTION                                   As an example, a map of rainfall deciles for Australia in January
                                                                                2017 – December 2019 derived from the Australian BoM rain
Australia frequently experiences extended periods of severe                     gauge observations is presented in Figure 1. The map shows
droughts which have significant negative impact on populations                  that rainfall over about half of the country was below-average,
and economy. Coping with regular droughts became a                              with rainfall recorded over most parts of the Murray-Darling
challenging experience for Australia’s farmers and rural                        Basin – the main agricultural region of Australia - being in the
communities. As a consequence of climate change, droughts                       lowest decile (or 10 per cent), i.e., indicating that this region
will likely be more frequent, longer in duration, and more                      was in meteorological drought.
severe. Droughts will also affect a broader area, which means
that farmers and communities who rarely experienced drought
are likely to experience it more often. Analysis of drought risk,
therefore, is of key importance. To improve preparedness for
drought, decision-support tools which provide comprehensive
information about current dry conditions are essential. In this
paper, we present a conceptual design for a Drought Risk
Analyser (DRA) – a web-based information App for drought
risk mapping designed using geographic information system
(GIS).

                      2. DROUGHT IN AUSTRALIA

Australia is a dry continent and precipitation observations are
vital for drought monitoring. To obtain precipitation data, the
Australian Bureau of Meteorology (BoM) operates an extensive
observation network of more than 6,000 rain gauge stations.
Historical precipitation records from archives of the Australian                         Figure 1. Australian rainfall deciles 2017 – 2019
BoM (BoM, 2020) demonstrate that on average, widespread
drought in Australia occurs once every 18 years; however, the
severity and duration of droughts vary. *                                       Surface-based precipitation observations from the Australian
                                                                                BoM rain gauge network provide valuable information for
                                                                                drought monitoring; however, this network has a certain
*
    Corresponding authors                                                       deficiency. Spatial distribution of the surface-based stations is

                                                       This contribution has been peer-reviewed.
                       https://doi.org/10.5194/isprs-archives-XLIV-3-W1-2020-139-2020 | © Authors 2020. CC BY 4.0 License.                   139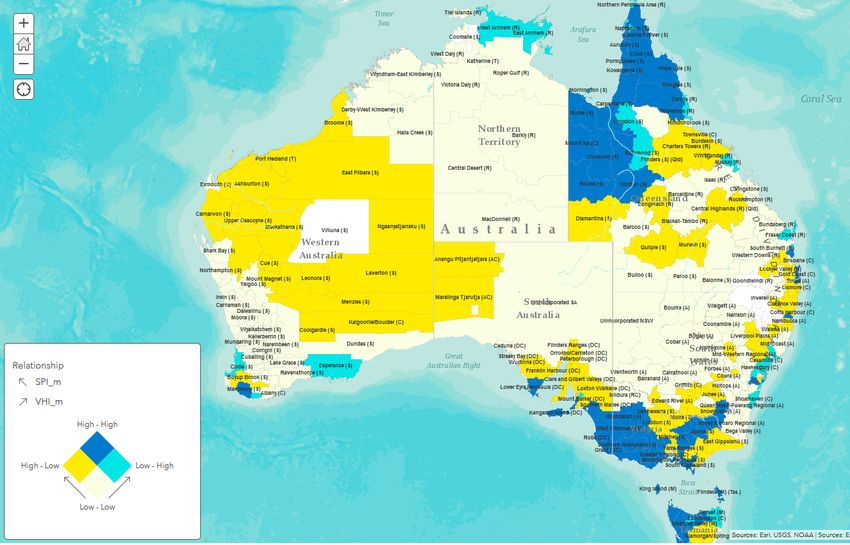
The International Archives of the Photogrammetry, Remote Sensing and Spatial Information Sciences, Volume XLIV-3/W1-2020, 2020
Gi4DM 2020 – 13th GeoInformation for Disaster Management conference, 30 November–4 December 2020, Sydney, Australia (online)

not uniform across Australia, as although eastern, southern and       (Livada, Assimakopoulos, 2007), the Vegetation Health Index
south-western areas of the country are densely covered by rain        (VHI) (Karnieli et al., 2006) and Soil Moisture (SM) (Atlas,
gauge stations, large areas in central Australia have very sparse     Wolfson, Terry, 1993) were considered as suitable drought
coverage.                                                             indicators to be included in the calculation of the Drought
                                                                      Hazard Index (DHI). Spatial datasets for the SPI, the VHI and
Modern technology - space-based observations - provides               SM were obtained from the WMO SWCEM.
global uniform coverage and in this way complements
conventional in situ observations. Recognising the importance         Various social and economic factors could be combined into a
of enhancing the capacity of meteorological services in               multidimensional model to assess a population's vulnerability to
providing users with accurate precipitation monitoring products,      drought. Following the approach of Aitkenhead et al. (2020) to
in 2017 the World Meteorological Organization (WMO)                   compute the Drought Vulnerability Index (DVI), the following
established the Space-based Weather and Climate Extremes              indicators were selected as representative for Australia:
Monitoring (SWCEM) international initiative; the first                agricultural occupation (% of total population in the labour
demonstration project was successfully implemented in East            force) and Socio-Economic Indexes for Areas (SEIFA), which
Asia and Western Pacific (Kuleshov et al. 2019). WMO                  is an Australian Bureau of Statistics (ABS) product that ranks
SWCEM products were specifically designed to assist with              areas in Australia according to relative socio-economic
extreme precipitation monitoring, including drought. In our           advantage and disadvantage. The selected indices are based on
conceptual design of the DRA, WMO SWCEM products were                 information from the five-yearly Census of Population and
used to assess drought hazard. This is a novel approach which         Housing average household income, and social dependency (%
we explored in this study for Australia. The developed                of population >15 and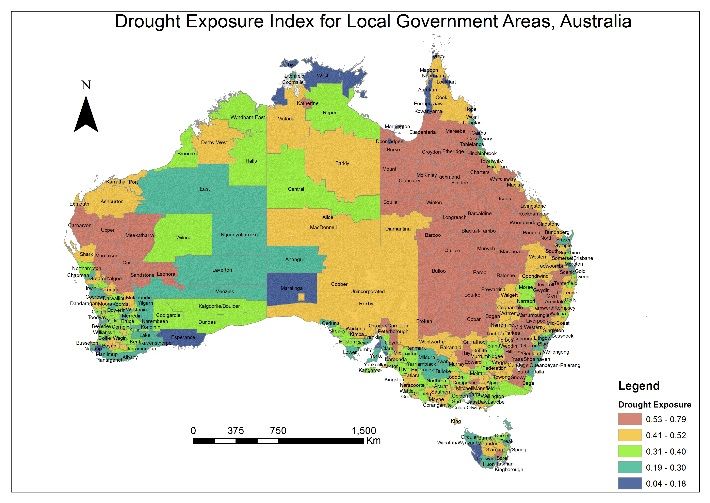
The International Archives of the Photogrammetry, Remote Sensing and Spatial Information Sciences, Volume XLIV-3/W1-2020, 2020
Gi4DM 2020 – 13th GeoInformation for Disaster Management conference, 30 November–4 December 2020, Sydney, Australia (online)
3.3 Design of a web-based GIS application for a DRA 3.5 Case study for the 2019 drought in Australia
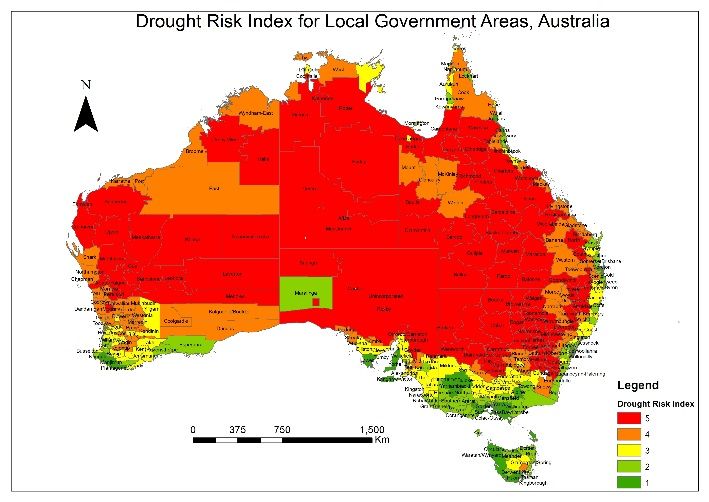
DRA, a web-based information App, displays a map of drought Using a case study for the 2019 drought in Australia, we
risk (level 1 product), maps of the drought hazard, vulnerability illustrate mapping functionality implemented in the designed
and exposure indices (level 2 products), and their indicators, web-based DRA App. In Figure 2, the DRI for Australia (level
e.g., the SPI, the VHI, SM, topographic layers, LGAs drought 1 product) for October 2019 is presented indicating severe (4)
related population vulnerability indicators etc. (level 3 and extreme (5) drought risk for many LGAs in Australia.
products).
The DRI map was produced by integrating the DHI, DVI and
DEI maps using the fuzzy gamma overlay function in ArcGIS.
The extent of drought hazard, vulnerability, exposure and risk
displayed on the respective maps was classified into five
categories based on the quintile values: mild (1), moderate (2),
serious (3), severe (4), and extreme (5).
The designed web-based DRA App allows users to query the
latest values of drought hazard indicators and indices updated
monthly, as well as archived historical data. The DRA App will
be also beneficial for researchers and LGA planners to gain
insights on the current state of drought risk at both local and
national levels.
In addition, statistics and plots, e.g., pie charts and boxplots,
could be generated as level 4 products (as examples, an Figure 2. DRI at LGA level for Australia for October 2019
overview of DRI LGA distribution across states and territories
is presented in Appendix 2 and a map of top 10 DRI LGAs – in
Appendix 3). As an example of level 2 products, a map of the DHI index for
Australia for October 2019 is presented in Figure 3. The index
3.4 DRA App with an interactive dashboard and maps was computed using the SPI, the VHI and SM combined. The
map indicates severe (4) and extreme (5) drought conditions for
We built a DRA App in GIS to disseminate the DRI indicators most of LGAs across the country apart from some LGAs in
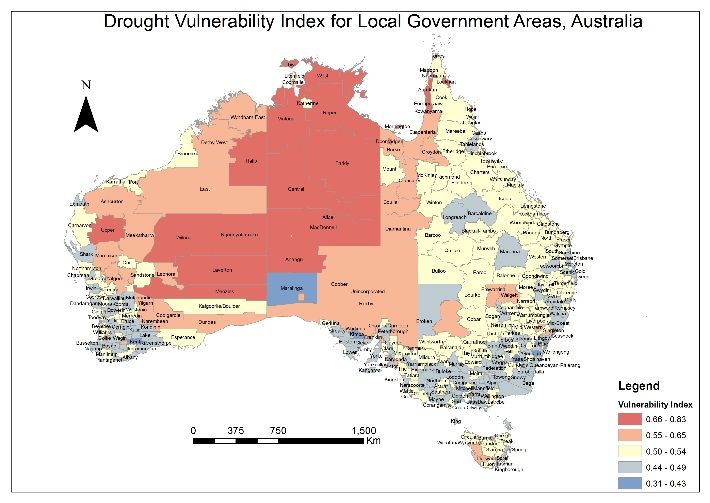
and Index using an interactive dashboard and maps. Multiple Victoria and Tasmania. Other examples of level 2 products –
layers representing indicators and indices were uploaded to the maps of drought vulnerability and drought exposure - are given
maps for visualisation, query and generating graphics. in Appendix 4 and Appendix 5 respectively.
To compute the DHI, users have a choice to select the SPI, the
VHI and SM individually, or in combination, and then the
selected indicators are used to compute the index. Similarly, a
flexible approach is incorporated in computing the DVI,
allowing users to select a set of indicators which is tailored to
users' needs.
In this study, only land use/cover types from ALUM Class 3,
Production from Dryland Agriculture and Plantations, were
selected as inputs for the computation of the DEI. In the
developed DRA design, there is an option for users to make a
selection from a number of ALUM Class 3 types of land
use/cover, e.g., grazing modified pastures, cropping, perennial
horticulture, etc., could be selected individually or in
combination to examine exposure to drought. In our future
work, an option to add other ALUM Classes of land use/cover
will be explored.
Figure 3. DHI for Australia for October 2019
Assessing drought exposure, we used a non-compensatory
method to combine selected indicators; this implies that Examples of level 3 products presented here include maps of
superiority in one indicator cannot be offset by inferiority in three drought indicators used in calculating the DHI - the SPI,
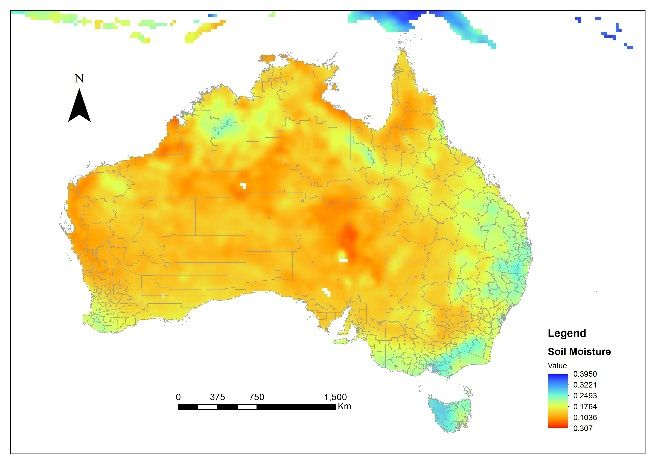
another indicator. Thus, an LGA is highly exposed to drought if the VHI and SM. A map of the 90-day SPI for Australia for
at least one of the indicators is abundant there. For example, an
October 2019 is presented in Figure 4; a map of the VHI for
LGA that is completely covered by rain-fed crops is considered
October 2019 – in Figure 5, and a map of SM for October 2019
as fully exposed to drought, independently of the presence or – in Figure 6.
absence of livestock.
Once the indicators for drought hazard, vulnerability and
exposure are selected, they are combined with a built-in
algorithm using equation 1, and maps are generated.
This contribution has been peer-reviewed.
https://doi.org/10.5194/isprs-archives-XLIV-3-W1-2020-139-2020 | © Authors 2020. CC BY 4.0 License. 141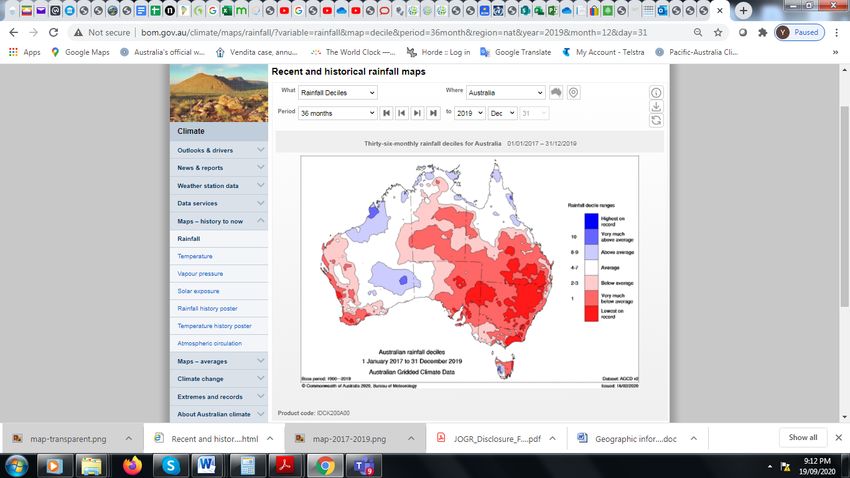
The International Archives of the Photogrammetry, Remote Sensing and Spatial Information Sciences, Volume XLIV-3/W1-2020, 2020
Gi4DM 2020 – 13th GeoInformation for Disaster Management conference, 30 November–4 December 2020, Sydney, Australia (online)
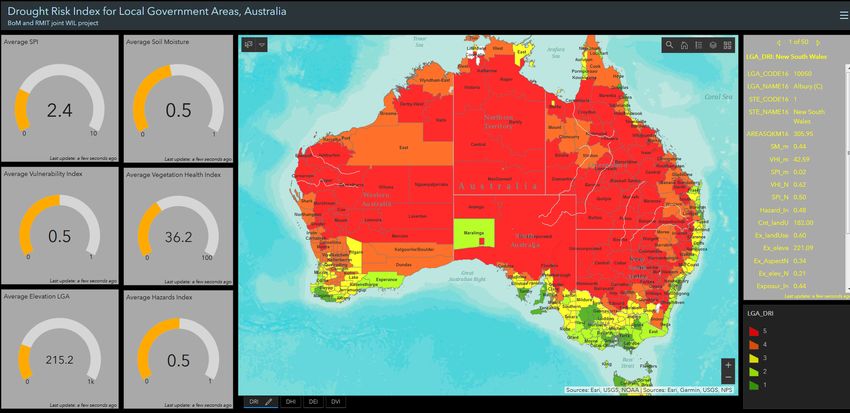
Figure 7. Web GIS Dashboard for DRA
Figure 4. 90-day SPI for Australia ending 31 October 2019
Figure 8. Local correlation map for the SPI and the VHI
In summary, this case study for the 2019 drought in Australia
demonstrates that the developed DRA App is informative and
interactive, whilst also having effective educational and
decision-making functionalities.
Figure 5. VHI for Australia for October 2019
3.6 Further Development of a DRA
In this paper, we presented a conceptual design of a Drought
Risk Analyser, DRA, and illustrated its functionality using a
case study of drought risk assessment for Australia in 2019.
As part of a peer-review process, useful comments on further
improvement of the developed web-based App were received
from GIS experts suggesting the implementation of additional
functionality which will allow the derivation of statistics for
spatial units defined under the Australian Statistical Geography
Standard (ASGS). The ASGS is a hierarchical geographical
classification, defined by the ABS, which is used in the
collection and dissemination of official statistics. The possible
implementation of these suggestions to enhance the
functionality of the designed DRA App will be explored in our
Figure 6. SM for Australia for October 2019 future work.
Further developing the DRA App, we will explore ASGS
All the selected indicators clearly demonstrate severe rainfall
hierarchical structure. In order to provide spatially explicit DRI
deficiency and its impact on vegetation health and soil moisture
maps and robust statistical analysis, we will compute the level 3
content, collectively describing extremely dry conditions which
products at the Statistical Area 1 (SA1) level. SA1s have a
many parts of Australia experienced in October 2019.
population of between 200 and 800 people with an average
population size of approximately 400 people. The SA1 based
The DRA App also includes charts and gauges to show the
drought risk indicators, three components of the drought risk
statistics of the indicators (Figure 7). Dashboard elements were
index (DHI, DVI and DEI) and the final DRI can be aggregated
configured to communicate with each other. A set of widgets
into products at higher hierarchical levels, e.g., Statistical Area
were built in to enable interaction with the map (e.g., layer
3 (SA3) and LGA levels. SA3s are designed to provide a
visibility, search, sharing, etc.). Furthermore, a spatial analysis
regional breakdown of Australia. They generally have a
was included in the App, e.g., Figure 8 presents the local
population of between 30,000 and 130,000 people. The ASGS
correlation between the SPI and the VHI.
LGAs are an ABS approximation of gazetted local government
boundaries as defined by each State and Territory Local
Government Department. As a result, the web-based Drought
This contribution has been peer-reviewed.
https://doi.org/10.5194/isprs-archives-XLIV-3-W1-2020-139-2020 | © Authors 2020. CC BY 4.0 License. 142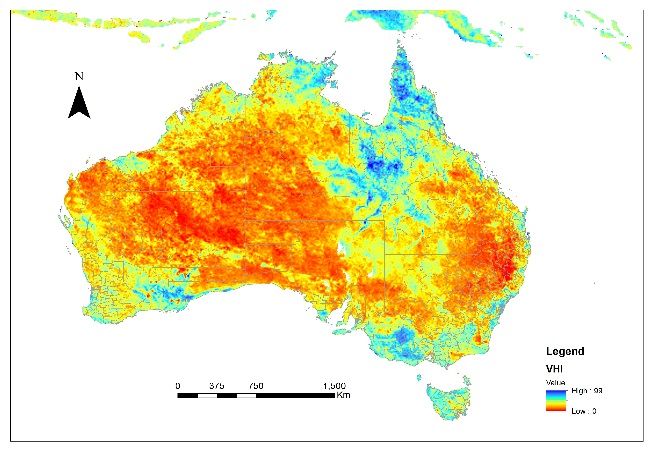
The International Archives of the Photogrammetry, Remote Sensing and Spatial Information Sciences, Volume XLIV-3/W1-2020, 2020
Gi4DM 2020 – 13th GeoInformation for Disaster Management conference, 30 November–4 December 2020, Sydney, Australia (online)

Risk Analyser will be a scalable and hierarchical decision-                                   DISCLAIMER
making tool for federal, state and local governments to query,
compare and run statistics for a variety of decision support         The views and opinions expressed in this publication are those
applications related to drought monitoring and strategic             of the authors and do not necessarily reflect those of the
planning.                                                            Australian Government. While reasonable efforts have been
                                                                     made to ensure that the contents of this publication are factually
In this concept design of the DRA App, drought hazard                correct, the Commonwealth does not accept responsibility for
assessment is based on using drought monitoring products – the       the accuracy or completeness of the contents, and shall not be
SPI, the VHI and SM - from the WMO SWCEM; the products               liable for any loss or damage that may be occasioned directly or
are available for East Asia and Western Pacific. While the           indirectly through the use of, or reliance on, the contents of this
presented case study describes the application of the DRA for        publication.
drought risk assessment for LGAs in Australia, availability of
space-based observations which provide global coverage will                                   REFERENCES
allow us to extend this approach and use the DRA App for
assessment of drought risk in other countries. In the near future,   ALUM, 2016. The Australian Land Use and Management
spatial coverage for WMO SWCEM products will be extended             (ALUM)                    Classification               system
beyond the Asia-Pacific region to include Africa and South           https://www.agriculture.gov.au/abares/aclump/land-use/alum-
America. As a result, more countries around the world affected       classification (August 2020).
by drought could potentially benefit from using the DRA App
for improving drought preparedness of farming communities.           Aitkenhead, I., Kuleshov, Y., Watkins, A.B., Bhardwaj, J.,
                                                                     Asghari, A., 2020. Assessing Agricultural Drought
Severe, frequent and prolonged droughts have a detrimental           Management Strategies in the Northern Murray-Darling Basin.
impact on the productivity of agriculture sector; farming            Natural Hazards (under review).
communities in developing and least developed countries in
Africa, Asia-Pacific and South America are particularly              Asghari, A., Kuleshov, Y., Watkins, A.B., Bhardwaj, J.,
vulnerable due to their low capacity to cope with drought. The       Aitkenhead, I., 2020. Improving Drought Resilience in Northern
importance of a user-centred Integrated Early Warning System         Murray-Darling Basin Farming Communities: Is Forecast-based
for Drought to assist communities at risk is now widely              Financing Suitable? Natural Hazards (under review).
recognised. Accurate and timely drought early warnings could
potentially save many lives and reduce hardship for affected         Atlas, R., Wolfson, N., Terry, J., 1993. The effect of SST and
communities. Moreover, proactively responding to predicted           soil moisture anomalies on GLA model simulations of the 1988
dry conditions, humanitarian aid agencies could trigger a set of     US summer drought. Journal of Climate, 6(11), 2034-2048.
actions including Forecast-based Financing (FbF) assistance
which is specifically focused on providing aid to communities        Bhardwaj, J., Kuleshov, Y., Watkins, A.B., Aitkenhead, I.,
most vulnerable to drought hazard (Asghari et al. 2020). The         Asghari, A., 2020. Building Capacity for a user-centred
DRA App is an integral part of a user-centred Integrated Early       Integrated Early Warning System (I-EWS) for Drought in the
Warning System for Drought and its further development will          Northern Murray-Darling Basin. Natural Hazards (under
be focused on addressing the needs of users in drought-prone         review).
areas around the world.
                                                                     Carrão, H., Naumann, G., Barbosa, P., 2016. Mapping global
                     4. CONCLUSIONS                                  patterns of drought risk: An empirical framework based on sub-
                                                                     national estimates of hazard, exposure and vulnerability. Global
In this paper, we presented a conceptual design for a DRA -          Environmental Change, 39, 108-124.
web-based information App for drought risk mapping
developed using GIS. The developed DRA is based on                   Commonwealth of Australia, Bureau of Meteorology (BoM),
combining drought hazard, vulnerability and exposure to              2020,     http://www.bom.gov.au/climate/drought/archive.shtml
provide users with an integrated drought risk assessment. The        (October 2020).
presented case study for drought risk assessment in Australia in
2019 demonstrates flexible functionality of the DRA and its          Emrich, C. T., Cutter, S. L., 2011. Social vulnerability to
ability to generate various maps, graphs and statistics which        climate-sensitive hazards in the southern United States.
could be brought down to a level of an individual LGA.               Weather, Climate, and Society, 3(3), 193-208.
Dashboards present the data in intuitive and compelling ways.
The DRA App will be beneficial for Australian farmers and            Esri. 2018. ArcMap: Release 10.6. 1.
rural communities to assist with decision making, as well as for
LGA planners to gain insights on current and future states of        Geoscience Australia. 2010. 3 second SRTM Digital Elevation
drought risk at both local and national levels.                      Model (DEM) v01. Bioregional Assessment Source
                                                                     Dataset, http://data.bioregionalassessments.gov.au/dataset/12e0
                 ACKNOWLEDGEMENTS                                    731d-96dd-49cc-aa21-ebfd65a3f67a (July 2020).

Satellite-derived products used in this study for drought            Karnieli, A., Bayasgalan, M., Bayarjargal, Y., Agam, N.,
monitoring were provided through the World Meteorological            Khudulmur, S., Tucker, C., 2006. Comments on the use of the
Organization (WMO) Space-based Weather and Climate                   vegetation health index over Mongolia. International Journal of
Extremes Monitoring (SWCEM) demonstration project for East           Remote Sensing, 27(10), 2017-2024.
Asia and Western Pacific. The authors express sincere gratitude
to two anonymous reviewers for their valuable comments on the
possible enhancement of DRA design.

                                                This contribution has been peer-reviewed.
                https://doi.org/10.5194/isprs-archives-XLIV-3-W1-2020-139-2020 | © Authors 2020. CC BY 4.0 License.                 143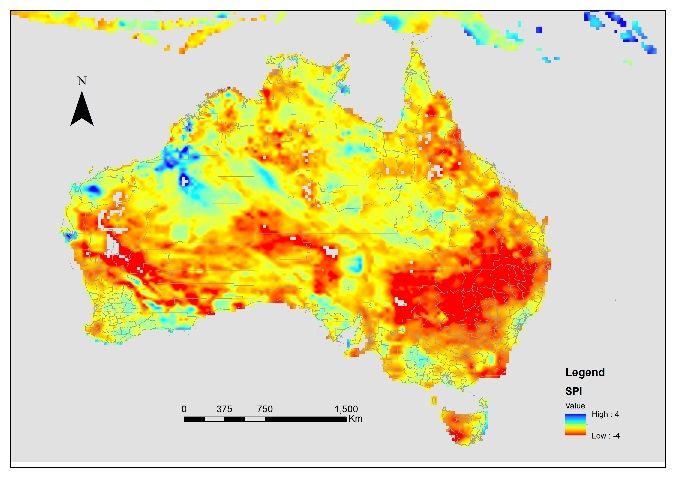
The International Archives of the Photogrammetry, Remote Sensing and Spatial Information Sciences, Volume XLIV-3/W1-2020, 2020
Gi4DM 2020 – 13th GeoInformation for Disaster Management conference, 30 November–4 December 2020, Sydney, Australia (online)

Kuleshov, Y., Kurino, T., Kubota, T., Tashima, T., Xie, P.,                                           Appendix 3: Map of the top 10 DRI LGAs.
2019: WMO Space-Based Weather and Climate Extremes
Monitoring Demonstration Project: First Outcomes of Regional
Cooperation on Drought and Heavy Precipitation Monitoring
for Australia and Southeast Asia. In Rainfall - Extremes,
Distribution and Properties, doi:10.5772/intechopen.85824

Livada, I., Assimakopoulos, V. 2007. Spatial and temporal
analysis of drought in Greece using the Standardized
Precipitation Index (SPI). Theoretical and Applied Climatology,
89(3-4), 143-153.

Svoboda, M., LeComte, D., Hayes, M., Heim, R., Gleason, K.,
Angel, J., Rippey, B., Tinker, R., Palecki, M., Stooksbury, D.,
Miskus, D. and Stephens, S., 2002. The Drought Monitor.
Bulletin of the American Meteorological Society, 83(8):1181-
1190.

Vogt, J.V., Naumann, G., Masante, D., Spinoni, J., Cammalleri,
C., Erian, W., Pischke, F., Pulwarty, R., Barbosa, P., 2018.                                          Appendix 4: Map of Drought Vulnerability Index for LGAs.
Drought Risk Assessment. A conceptual Framework. EUR
29464 EN, Publications Office of the European Union,
Luxembourg. ISBN 978-92-79-97469-4, doi:10.2760/057223,
JRC113937.

                                        APPENDIX

Appendix 1: Three levels of products for drought risk
assessment.
             Level 3
 Standardized Precipitation Index
              (SPI)                              Level 2

   Vegetation Health Index (VHI)          Drought Hazard Index (DHI)

        Soil Moisture (SM)

 Social dependency (% population
      >15 and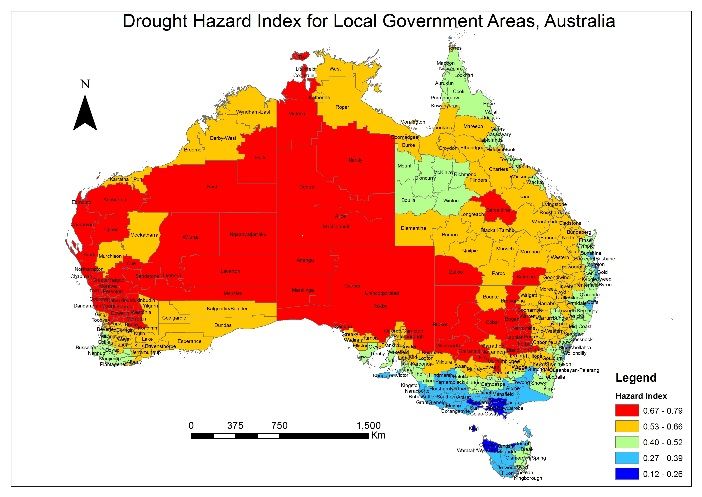
You can also read