Radioactive substances: Cesium-137 in fish and surface seawater Key Message - helcom

 
CONTINUE READING
Radioactive substances: Cesium-137 in fish and surface seawater Key Message - helcom
HELCOM indicator report
                                                                                                                            July 2018

                             Radioactive substances:
                      Cesium-137 in fish and surface seawater
                                                    Key Message
This core indicator evaluates the state of the environment using the concentration of the radioactive isotope
cesium-137 (137Cs) in herring, flatfish (flounder) and surface waters. Good status is achieved when
concentrations reach levels representative of those measured before the Chernobyl accident in 1986, the
point at which the biota of the Baltic Sea received the most significant contribution to their level of artificial
radionuclides, predominantly in the form of 137Cs.

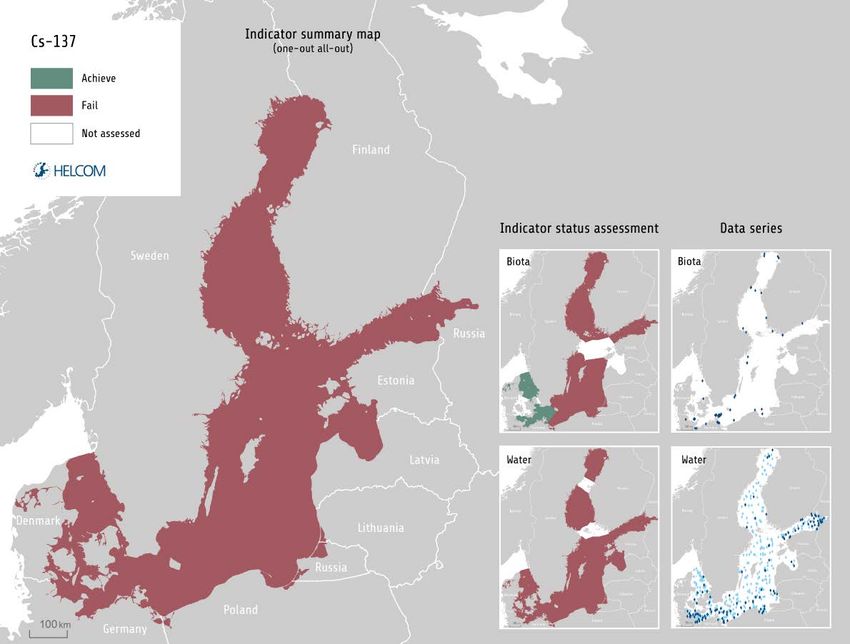
Key message figure 1. Status assessment results based on the evaluation of concentrations of cesium-137 in biota (herring and flatfish
-flounder) and in seawater. The One-Out-All-Out approach is used to summarise status (main figure) and the assessments are shown
for biota (upper insert) and water (lower insert). The assessment is carried out using Scale 2 HELCOM assessment units (defined in
the HELCOM Monitoring and Assessment Strategy Annex 4). Click here to access interactive maps at the HELCOM Map and Data
Service: Radioactive substances in herring and flatfish and radioactive substances in Seawater.

 www.helcom.fi > Baltic Sea trends > Indicators                                                   © HELCOM                     1
Radioactive substances: Cesium-137 in fish and surface seawater Key Message - helcom
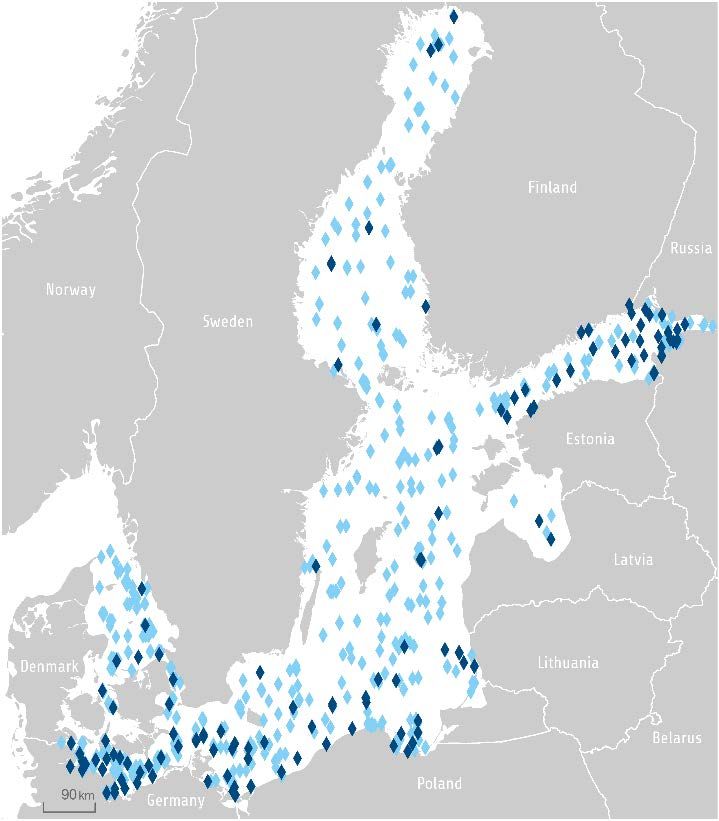
The indicator presents a status evaluation using data from 2011-2016.

In general, the activity concentrations of the radioactive isotope cesium-137 (137Cs) in herring, flatfish and
surface waters were still above the pre-Chernobyl levels that constitute the boundary for good status –
threshold values.
For herring, good status is only achieved in the Arkona Basin, the Bay of Mecklenburg, the Kiel Bay and the
Kattegat (Key message figure 1). For flatfish, good status is also achieved in the Arkona Basin, the Kiel Bay
and the Kattegat (Key message figure 1). All other assessed sub-basins are characterized by not-good status.
For surface waters, good status is not achieved in any of the sub-basins, where data is available (Key message
figure 2).
Time series analyses show that the 137Cs activity concentrations in herring, flatfish and surface waters in the
Baltic Sea basins are decreasing and approaching pre-Chernobyl levels. It is expected that good status may
be reached in the Baltic Sea by circa 2020 - 2025.
The confidence of the indicator status evaluation is considered to be high.
The indicator is applicable in the waters of all countries bordering the Baltic Sea.

                                   Relevance of the core indicator
The radionuclide cesium-137 (137Cs) is the greatest contributor to the level of artificial radionuclides in the
Baltic Sea, where the level of 137Cs contamination is still higher than in any other ocean of the world. The
main source of 137Cs deposited to the Baltic Sea stems from the accident at the Chernobyl nuclear power
plant in 1986. 137Cs was introduced into the Baltic Sea water by atmospheric deposition and, to a lesser
extent, through riverine input. 137Cs introduced to the Baltic Sea is bioaccumulated in marine flora and fauna
and is eventually deposited in the marine sediments. Therefore 137Cs activity concentrations are the key
factor in an assessment of the radiological hazard to marine organisms and humans (Nielsen et al. 1999).
Both are highly interconnected as the dominating exposure pathway of humans from man-made radioactivity
in the Baltic Sea is related to the ingestion of 137Cs in fish.

 www.helcom.fi > Baltic Sea trends > Indicators                                   © HELCOM               2
Policy relevance of the core indicator
                                 BSAP segment and objectives            MSFD Descriptor and criteria
 Primary link                    Hazardous substances                   D8 Concentrations of contaminants
                                     • Radioactivity at pre-Chernobyl     D8C1 Within coastal, territorial and
                                         level.                           areas beyond territorial waters the
                                                                          concentration of contaminants do not
                                                                          exceed the threshold values.

 Secondary link                                                         D9 Contaminants in fish and seafood
                                                                          D9C1 The level of contaminants in
                                                                          edible tissues of seafood caught or
                                                                          harvested in the wild does not exceed
                                                                          maximum levels which are the
                                                                          threshold values.

                                          Cite this indicator
HELCOM (2018) Radioactive substances: Cesium-137 in fish and surface seawater. HELCOM core indicator
report. Online. [Date Viewed], [Web link].
ISSN 2343-2543

                                  Download full indicator report
Radioactive substances HELCOM core indicator 2018 (pdf)

 www.helcom.fi > Baltic Sea trends > Indicators                            © HELCOM                 3
Results and Confidence
The current evaluation of whether good status is achieved, using concentrations of              Cs in biota and
                                                                                              137

seawater, is based on data from the period 2011-2016.
The results indicate that the activity concentrations of 137Cs in biota and seawater still reflect not-good status
in many HELCOM assessment units. Currently the activity concentrations of 137Cs are approaching the pre-
Chernobyl levels, representing good status boundary in all matrices. 137Cs in fish and seawater reached their
maximum values in the late 1980s and early 1990s (Results figures 1-3). Since then concentrations of 137Cs in
fish and seawater have continued to decrease in all regions of the Baltic Sea, it is expected that good status
may be reached in all the HELCOM assessment units of the Baltic Sea by about 2020-2025.

                                                   Herring
Based on data from 2011 to 2016, good status for 137Cs in herring, is not achieved in most of the HELCOM
sub-basins, except for the Arkona Basin, where the average concentration of 137Cs (calculated for whole
assessed period) is equal to 1.4 Bq kg-1 wet weight and sub-basins west of the Arkona Sea (Kiel Bay - 0.8 Bq
kg-1 wet weight, Bay of Mecklenburg – 0.7 Bq kg-1 wet weight and Kattegat – 0.7 Bq kg-1 wet weight). In the
Gulf of Finland, the Gdańsk Basin, the Eastern and Western Gotland Basins, the Bornholm Basin and the Åland
Sea the average concentrations calculated for the period 2011-2016 were in the range from 3.5 to 4.4 Bq kg-
1
  wet weight, while the highest mean value was found in the Bothnian Sea – 5.8 Bq kg-1 wet weight.
The annual mean values of concentrations of 137Cs in herring muscle in each sub-basin since 1984 are
compared to the threshold value, showing a steady downward trend after the Chernobyl accident in 1986
(Results figure 1). In 2016, in the western parts of the Baltic Sea (i.e. the Kattegat and the Arkona Basin), the
mean values were well below the target value of 2.5 Bq kg-1 wet weight, which was calculated as the average
of pre-Chernobyl (1984-1985) concentrations. In the remaining Baltic Sea sub-basins, the target value is still
not reached as the concentrations are higher than the pre-Chernobyl levels. In 2016, the highest mean
concentrations of 137Cs in herring (whole fish without head and entrails or flesh without bones) were in the
range of 4.0 to 4.6 Bq kg-1 wet weight in the Bothnian Bay, the Bothnian Sea and the Quark. In the Åland Sea
the concentration remained at the level of 3.6 Bq kg-1 wet weight, in the Gulf of Finland mean concentration
was equal to 2.9 Bq kg-1 wet weight, while in the Bornholm Basin concentration decreased in 2016 (as
compared to 2015) to the 2.5 Bq kg-1 wet weight reaching the threshold level.

 www.helcom.fi > Baltic Sea trends > Indicators                                    © HELCOM                 4
10
                                                                 15
                                                                      20
                                                                           25
                                                                                30
                                                                                                                   10
                                                                                                                        15
                                                                                                                             20
                                                                                                                                  25
                                                                                                                                       30
                                                                                                                                                                 10
                                                                                                                                                                           20
                                                                                                                                                                                     30

                                                    0
                                                        5
                                                                                                           0
                                                                                                               5
                                                                                                                                                         0
                                                 1984                                                   1984                                          1984
                                                 1986                                                   1986                                          1986
                                                 1988                                                   1988                                          1988
                                                 1990                                                   1990                                          1990
                                                 1992                                                   1992                                          1992
                                                 1994                                                   1994                                          1994
                                                 1996                                                   1996                                          1996
                                                 1998                                                   1998                                          1998
                                                 2000                                                   2000                                          2000
                                                 2002                                                   2002                                          2002

                                                                                                                                       Bothnian Sea
                                                                                                                                                                                     Bothnian Bay

                                                                                Gulf of Finland
                                                 2004                                                   2004                                          2004
                                                 2006                                                   2006                                          2006
                                                 2008                                                   2008                                          2008
                                                 2010                                                   2010                                          2010
                                                 2012                                                   2012                                          2012

www.helcom.fi > Baltic Sea trends > Indicators
                                                 2014                                                   2014                                          2014
                                                 2016                                                   2016                                          2016

                                                            10
                                                                 15
                                                                      20
                                                                           25
                                                                                30
                                                                                                                   10
                                                                                                                             20
                                                                                                                                       30
                                                                                                                                                                 10
                                                                                                                                                                      15
                                                                                                                                                                           20
                                                                                                                                                                                25
                                                                                                                                                                                     30

                                                    0
                                                        5
                                                                                                           0
                                                                                                                                                         0
                                                                                                                                                             5

                                                 1984                                                   1984                                          1984
                                                 1986                                                   1986                                          1986
                                                 1988                                                   1988                                          1988
                                                 1990                                                   1990                                          1990
                                                 1992                                                   1992                                          1992
                                                 1994                                                   1994                                          1994
                                                 1996                                                   1996                                          1996
                                                 1998                                                   1998                                          1998
                                                 2000                                                   2000                                          2000
                                                                                                                                       Aland Sea

                                                 2002                                                   2002                                          2002
                                                                                                                                                                                     The Quark

                                                 2004                                                   2004                                          2004

© HELCOM
                                                 2006                                                   2006                                          2006
                                                                                Western Gotland Basin
                                                 2008                                                   2008                                          2008
                                                 2010                                                   2010                                          2010
                                                 2012                                                   2012                                          2012
                                                 2014                                                   2014                                          2014

5
                                                 2016                                                   2016                                          2016
10
                                                                                                               15
                                                                                                                    20
                                                                                                                         25
                                                                                                                              30
                                                                                                                                   35
                                                                                                                                                               10
                                                                                                                                                                    15
                                                                                                                                                                         20
                                                                                                                                                                              25
                                                                                                                                                                                   30

                                                                                                  0
                                                                                                      5
                                                                                                                                                       0
                                                                                                                                                           5

                                                                          10

                                                    0
                                                              5

                                                        2.5
                                                                    7.5
                                                 1984                                          1984                                                 1984
                                                 1986                                          1986                                                 1986
                                                 1988                                          1988                                                 1988
                                                 1990                                          1990                                                 1990
                                                 1992                                          1992                                                 1992
                                                 1994                                          1994                                                 1994
                                                 1996                                          1996                                                 1996
                                                 1998                                          1998                                                 1998
                                                 2000                                          2000                                                 2000
                                                 2002                                          2002                                                 2002

                                                                                                                                   Bornholm Basin
                                                 2004                                          2004                                                 2004

                                                                          Bay of Mecklenburg
                                                                                                                                                                                   Eastern Gotland Basin

                                                 2006                                          2006                                                 2006
                                                 2008                                          2008                                                 2008
                                                 2010                                          2010                                                 2010
                                                 2012                                          2012                                                 2012

www.helcom.fi > Baltic Sea trends > Indicators
                                                 2014                                          2014                                                 2014
                                                 2016                                          2016                                                 2016
                                                                                                                                                               10
                                                                                                                                                                    15
                                                                                                                                                                         20
                                                                                                                                                                              25
                                                                                                                                                                                   30

                                                                                                                                                       0
                                                                                                                                                           5

                                                                                                                                   10

                                                    0
                                                                          5
                                                                                                  0
                                                                                                                5

                                                              2.5
                                                                                                      2.5
                                                                                                                         7.5
                                                 1984                                          1984                                                 1984
                                                 1986                                          1986                                                 1986
                                                 1988                                          1988                                                 1988
                                                 1990                                          1990                                                 1990
                                                 1992                                          1992                                                 1992
                                                 1994                                          1994                                                 1994
                                                 1996                                          1996                                                 1996
                                                 1998                                          1998                                                 1998
                                                 2000                                          2000                                                 2000

                                                                          Kiel Bay
                                                 2002                                          2002                                                 2002
                                                                                                                                   Arkona Basin
                                                                                                                                                                                   Gdansk Basin

                                                 2004                                          2004                                                 2004

© HELCOM
                                                 2006                                          2006                                                 2006
                                                 2008                                          2008                                                 2008
                                                 2010                                          2010                                                 2010
                                                 2012                                          2012                                                 2012
                                                 2014                                          2014                                                 2014

6
                                                 2016                                          2016                                                 2016
Kattegat
 10

7.5

   5

2.5

   0
       1984
       1986
       1988
       1990
       1992
       1994
       1996
       1998
       2000
       2002
       2004
       2006
       2008
       2010
       2012
       2014
       2016
Results figure 1. 137Cs mean concentrations (in Bq kg-1 wet weight) in herring (whole fish without head and entrails or flesh without
bones) in 1984–2016, as annual mean by sub-basin. Red line indicates the good status boundary (threshold value 2.5 Bq kg-1)
calculated as average of pre-Chernobyl (1984–1985) concentrations. Notice variable scale in graphs.

                                                            Flatfish
Based on data from the period 2011-2016 for flatfish (flounder), good status is achieved in the Arkona Basin,
where the average concentrations is equal to 2.6 Bq kg-1 wet weight, in the Kiel Bay (0.8 Bq kg-1 wet weight)
and in the Kattegat (0.3 Bq kg-1 wet weight), while 137Cs concentrations above the threshold value were found
in the Eastern Gotland Basin (with average value equal to 3.7 Bq kg-1 wet weight), in the Gdańsk Basin (3.5
Bq kg-1 wet weight) and in the Bornholm Basin (3.7 Bq kg-1 wet weight).

Results figure 2 shows time series of 137Cs concentrations in flatfish samples (whole fish without head and
entrails, or flesh without bones), which include flounder (Platichthys flesus) and plaice (Pleuronectes
platessa). In 2016, the mean values of 137Cs concentrations were below target value 2.9 Bq kg-1 wet weight
in two basins. They were at the levels of 0.1 Bq kg-1 wet weight in the Kattegat and 0.7 Bq kg-1 wet weight in
the Kiel Bay. In the Bornhom Basin (4.1 Bq kg-1 wet weight) and in the Eastern Gotland Basin (3.4 Bq kg-1 wet
weight) the concentration exceeded the threshold value, while in the Arkona Basinin it was equal to 2.9 Bq
kg-1 wet weight.

                     Eastern Gotland Basin                                                   Gdansk Basin
 20                                                                 20

 15                                                                 15

 10                                                                 10

   5                                                                  5

   0                                                                  0
       1984
       1986
       1988
       1990
       1992
       1994
       1996
       1998
       2000
       2002
       2004
       2006
       2008
       2010
       2012
       2014
       2016

                                                                          1984
                                                                          1986
                                                                          1988
                                                                          1990
                                                                          1992
                                                                          1994
                                                                          1996
                                                                          1998
                                                                          2000
                                                                          2002
                                                                          2004
                                                                          2006
                                                                          2008
                                                                          2010
                                                                          2012
                                                                          2014
                                                                          2016

 www.helcom.fi > Baltic Sea trends > Indicators                                                  © HELCOM                     7
Bornholm Basin                                                           Arkona Basin
  20                                                                    20

  15                                                                    15

  10                                                                    10

   5                                                                      5

   0                                                                      0
       1984
       1986
       1988
       1990
       1992
       1994
       1996
       1998
       2000
       2002
       2004
       2006
       2008
       2010
       2012
       2014
       2016

                                                                              1984
                                                                              1986
                                                                              1988
                                                                              1990
                                                                              1992
                                                                              1994
                                                                              1996
                                                                              1998
                                                                              2000
                                                                              2002
                                                                              2004
                                                                              2006
                                                                              2008
                                                                              2010
                                                                              2012
                                                                              2014
                                                                              2016
                        Bay of Mecklenburg                                                            Kiel Bay
  20                                                                    20

  15                                                                    15

  10                                                                    10

   5                                                                      5

   0                                                                      0
       1984
       1986
       1988
       1990
       1992
       1994
       1996
       1998
       2000
       2002
       2004
       2006
       2008
       2010
       2012
       2014
       2016

                                                                              1984
                                                                              1986
                                                                              1988
                                                                              1990
                                                                              1992
                                                                              1994
                                                                              1996
                                                                              1998
                                                                              2000
                                                                              2002
                                                                              2004
                                                                              2006
                                                                              2008
                                                                              2010
                                                                              2012
                                                                              2014
                                                                              2016
                               Kattegat
  20

  15

  10

   5

   0
       1984
       1986
       1988
       1990
       1992
       1994
       1996
       1998
       2000
       2002
       2004
       2006
       2008
       2010
       2012
       2014
       2016

Results figure 2. 137Cs concentrations (in Bq kg-1) in flatfish - plaice and flounder (whole fish without head and entrails, or flesh without
bones) in 1984–2016, as annual means by sub-basin. Red line indicates the threshold value-2.9 Bq kg-1 calculated as average of pre-
Chernobyl (1984–1985) concentrations.

                                                        Surface seawater
Based on the averages concentrations of 137Cs calculated for period 2011-2016 for surface seawaters, none
of the HELCOM sub-basins achieve good status. The highest average concentration of 137Cs equal to 29.3 Bq
m-3 was found in the Bothnian Sea. Slightly lower values were calculated for the Eastern Gotland Basin (28.2

 www.helcom.fi > Baltic Sea trends > Indicators                                                        © HELCOM                       8
Bq m-3), Western Gotland Basin (27.2 Bq Bq m-3), Northern Baltic Proper (26.4 Bq m-3) and Arkona Basin (26.5
Bq m-3). The lowest average concentration of 137Cs, equal to 17.4 Bq m-3, was specific for the Kattegat.
In 2016, the concentrations of 137Cs in seawater were significantly more uniform in their range (Results figure
3) as compared to the distribution of 137Cs in surface waters after the Chernobyl accident, when in the most
contaminated areas (the Bothnian Sea and the Gulf of Finland) activities exceeding 500 Bq m-3 were observed
while in the western parts of the Baltic Sea they were close to 100 Bq m-3. In 2016, the highest concentrations
were found in the Eastern Gotland Basin (26 Bq m-3) and in the Bothnian Sea (24 Bq m-3). Slightly lower values
were found in the Northern Baltic Proper and Arkona Basin (23 Bq m-3) and in the Western Gotland Basin and
Bornholm Basin (22 Bq m-3). Concentrations at the level of 20 Bq m-3 were specific to four sub-basins: The
Sound, Kiel Bay, Gdańsk Basin and Bay of Mecklenburg. Lower mean concentrations of 137Cs, but still above
the target level, were specific for the Gulf of Finland (16 Bq m-3) and Great Belt (18 Bq m-3). In 2016, the mean
concentrations of 137Cs reached the pre-Chernobyl level in two basins: the Kattegat (14 Bq m-3) and The
Bothnian Bay (14 Bq m-3).

                      Bothnian Bay                                               The Quark

 150                                                       150
 135                                                       135
 120                                                       120
 105                                                       105
  90                                                        90
  75                                                        75
  60                                                        60
  45                                                        45
  30                                                        30
  15                                                        15
   0                                                         0
       1984
       1986
       1988
       1990
       1992
       1994
       1996
       1998
       2000
       2002
       2004
       2006
       2008
       2010
       2012
       2014
       2016

                                                                 1984
                                                                 1986
                                                                 1988
                                                                 1990
                                                                 1992
                                                                 1994
                                                                 1996
                                                                 1998
                                                                 2000
                                                                 2002
                                                                 2004
                                                                 2006
                                                                 2008
                                                                 2010
                                                                 2012
                                                                 2014
                                                                 2016
                      Bothnian Sea                                             Gulf of Finland

 150                                                       150
 135                                                       135
 120                                                       120
 105                                                       105
  90                                                        90
  75                                                        75
  60                                                        60
  45                                                        45
  30                                                        30
  15                                                        15
   0                                                         0
       1984
       1986
       1988
       1990
       1992
       1994
       1996
       1998
       2000
       2002
       2004
       2006
       2008
       2010
       2012
       2014
       2016

                                                                 1984
                                                                 1986
                                                                 1988
                                                                 1990
                                                                 1992
                                                                 1994
                                                                 1996
                                                                 1998
                                                                 2000
                                                                 2002
                                                                 2004
                                                                 2006
                                                                 2008
                                                                 2010
                                                                 2012
                                                                 2014
                                                                 2016

 www.helcom.fi > Baltic Sea trends > Indicators                                   © HELCOM                 9
0
                                                         15
                                                         30
                                                         45
                                                         60
                                                         75
                                                         90
                                                        105
                                                        120
                                                        135
                                                        150
                                                                                        0
                                                                                       15
                                                                                       30
                                                                                       45
                                                                                       60
                                                                                       75
                                                                                       90
                                                                                      105
                                                                                      120
                                                                                      135
                                                                                      150
                                                                                                                             0
                                                                                                                            15
                                                                                                                            30
                                                                                                                            45
                                                                                                                            60
                                                                                                                            75
                                                                                                                            90
                                                                                                                           105
                                                                                                                           120
                                                                                                                           135
                                                                                                                           150
                                                 1984                          1984                                 1984
                                                 1986                          1986                                 1986
                                                 1988                          1988                                 1988
                                                 1990                          1990                                 1990
                                                 1992                          1992                                 1992
                                                 1994                          1994                                 1994
                                                 1996                          1996                                 1996
                                                 1998                          1998                                 1998
                                                 2000                          2000                                 2000
                                                 2002                          2002                                 2002

                                                              Gdansk Basin
                                                 2004                          2004                                 2004
                                                                                                                                 Northern Baltic Proper

                                                                                            Western Gotland Basin
                                                 2006                          2006                                 2006
                                                 2008                          2008                                 2008
                                                 2010                          2010                                 2010
                                                 2012                          2012                                 2012
                                                 2014                          2014                                 2014

www.helcom.fi > Baltic Sea trends > Indicators
                                                 2016                          2016                                 2016

                                                          0
                                                         15
                                                         30
                                                         45
                                                         60
                                                         75
                                                         90
                                                        105
                                                        120
                                                        135
                                                        150
                                                                                        0
                                                                                       15
                                                                                       30
                                                                                       45
                                                                                       60
                                                                                       75
                                                                                       90
                                                                                      105
                                                                                      120
                                                                                      135
                                                                                      150
                                                                                                                             0
                                                                                                                            15
                                                                                                                            30
                                                                                                                            45
                                                                                                                            60
                                                                                                                            75
                                                                                                                            90
                                                                                                                           105
                                                                                                                           120
                                                                                                                           135
                                                                                                                           150

                                                 1984                          1984                                 1984
                                                 1986                          1986                                 1986
                                                 1988                          1988                                 1988
                                                 1990                          1990                                 1990
                                                 1992                          1992                                 1992
                                                 1994                          1994                                 1994
                                                 1996                          1996                                 1996
                                                 1998                          1998                                 1998
                                                 2000                          2000                                 2000
                                                 2002                          2002                                 2002
                                                                                                                                 Gulf of Riga

                                                              Bornholm Basin
                                                 2004                          2004                                 2004

© HELCOM
                                                                                            Eastern Gotland Basin

                                                 2006                          2006                                 2006
                                                 2008                          2008                                 2008
                                                 2010                          2010                                 2010
                                                 2012                          2012                                 2012
                                                 2014                          2014                                 2014
                                                 2016                          2016                                 2016

10
Arkona Basin                                                   Bay of Mecklenburg

  150                                                                150
  135                                                                135
  120                                                                120
  105                                                                105
   90                                                                 90
   75                                                                 75
   60                                                                 60
   45                                                                 45
   30                                                                 30
   15                                                                 15
    0                                                                  0
        1984
        1986
        1988
        1990
        1992
        1994
        1996
        1998
        2000
        2002
        2004
        2006
        2008
        2010
        2012
        2014
        2016

                                                                           1984
                                                                           1986
                                                                           1988
                                                                           1990
                                                                           1992
                                                                           1994
                                                                           1996
                                                                           1998
                                                                           2000
                                                                           2002
                                                                           2004
                                                                           2006
                                                                           2008
                                                                           2010
                                                                           2012
                                                                           2014
                                                                           2016
                            Kiel Bay                                                          Great Belt

  150                                                                150
  135                                                                135
  120                                                                120
  105                                                                105
   90                                                                 90
   75                                                                 75
   60                                                                 60
   45                                                                 45
   30                                                                 30
   15                                                                 15
    0                                                                  0
        1984
        1986
        1988
        1990
        1992
        1994
        1996
        1998
        2000
        2002
        2004
        2006
        2008
        2010
        2012
        2014
        2016

                                                                           1984
                                                                           1986
                                                                           1988
                                                                           1990
                                                                           1992
                                                                           1994
                                                                           1996
                                                                           1998
                                                                           2000
                                                                           2002
                                                                           2004
                                                                           2006
                                                                           2008
                                                                           2010
                                                                           2012
                                                                           2014
                                                                           2016
                           The Sound                                                           Kattegat

  150                                                                150
  135                                                                135
  120                                                                120
  105                                                                105
   90                                                                 90
   75                                                                 75
   60                                                                 60
   45                                                                 45
   30                                                                 30
   15                                                                 15
    0                                                                  0
        1984
        1986
        1988
        1990
        1992
        1994
        1996
        1998
        2000
        2002
        2004
        2006
        2008
        2010
        2012
        2014
        2016

                                                                           1984
                                                                           1986
                                                                           1988
                                                                           1990
                                                                           1992
                                                                           1994
                                                                           1996
                                                                           1998
                                                                           2000
                                                                           2002
                                                                           2004
                                                                           2006
                                                                           2008
                                                                           2010
                                                                           2012
                                                                           2014
                                                                           2016

Results figure 3. 137Cs concentrations (in Bq m-3) in seawater (sampling depth less than 10 m) in 1984-2016, as annual mean values
by sub-basin. Red line indicates the threshold value (15 Bq m-3) calculated as average of pre-Chernobyl (1984-1985) concentrations.

                               Prediction on achieving pre-Chernobyl status
Based on the inventory estimates, the effective half-life of 137Cs in Baltic seawater has been 10.2 years during
the period 1986 - 2016. The effective half-life of a radioactive contaminant is the time required for its
concentration to decrease by 50% as a result of physical, chemical and biological processes which are specific

 www.helcom.fi > Baltic Sea trends > Indicators                                                © HELCOM                     11
of each radionuclide and each environment where they may occur. With this decay rate, the 137Cs inventory
in the Baltic Sea would reach the pre-Chernobyl levels (250 TBq) by the year 2020, presuming that the
effective half-life would remain constant, and no substantial remobilization of 137Cs from sediments should
occur.
It should be pointed out that the 137Cs input from Fukushima fallout (the Fukushima Dai-chii disaster took
place in 2011) did not result in an increase in 137Cs concentration in seawater and biota of the Baltic Sea
(Kanisch & Aust 2013).

                          Confidence of the indicator status evaluation
The confidence of the indicator results is high.
Quality assurance is a fundamental part of radioanalytical procedures, needed to confirm the precision and
the long-term repeatability of analyses. The radiochemical procedures and counting techniques used by
laboratories are well tested, up-to-date, and similar to those used by laboratories worldwide. The
laboratories from eight countries bordering the Baltic Sea and IAEA MEL have contributed to the
intercomparison programme during the years 2011 – 2014 (results have been presented in the thematic
assessment of radioactivity. The intercomparison exercises confirmed that the data provided by the MORS
group are of very good quality and can be considered comparable. The inter-comparison exercise of analyses
of Baltic Sea water has continued in 2015 and 2016 as organized by STUK, Finland (sample were sampled and
delivered by Germany on 23rd June 2015). Several laboratories have also participated in the other inter-
comparison exercises organized by the IAEA or other bodies.

 www.helcom.fi > Baltic Sea trends > Indicators                               © HELCOM               12
Thresholds and Status evaluation
The good status is achieved when the activity concentration of radionuclide cesium-137 (137Cs) is below 2.5
Bq kg-1 for herring, 2.9 Bq kg-1 for flounder and plaice and 15 Bq m-3 for seawater. The quantitative boundaries
used for defining the threshold values corresponds to pre-Chernobyl activity concentration levels, in other
words the levels before 1984.

Thresholds figure 1. Good status is achieved when the activity concentration levels of the radionuclide cesium-137 (137Cs) are below
the threshold value, i.e. at pre-Chernobyl level. The threshold values are 2.5 Bq kg-1 for herring, 2.9 Bq kg-1 for flounder and plaice
and 15 Bq m-3 for seawater.

The activity concentration of the radionuclide cesium-137 (137Cs) is evaluated in herring, flatfish and seawater
and compared against the threshold values. Currently, no internationally accepted criteria for the assessment
of good status in fish exist. There are only upper levels available in the literature, where fish will suffer from
doses of radioactive substances (e. g. ICRP 2008). Therefore, threshold values for 137Cs concentrations in
seawater and biota have been set at pre-Chernobyl levels. The good status boundaries are averages based
on monitoring measurements from 1984-1985 calculated from data in the HELCOM MORS database.
Threshold values are uniform across all assessment units due to uniform distribution of pre-Chernobyl
radiation levels caused by atmospheric fallout from nuclear weapons testing.
The confidence of the threshold values is considered to be high, as there are numerous observations from
the pre-Chernobyl time, even if the length of the time series is short (1984-1985).

 www.helcom.fi > Baltic Sea trends > Indicators                                                   © HELCOM                      13
Assessment Protocol
The pre-Chernobyl values used to derive the threshold value have been calculated based on data in the
HELCOM MORS database. The data used for defining the threshold value for 137Cs concentrations in herring,
flatfish (plaice and flounder) and surface waters were collected between 1984 and 1985. The mean pre-
Chernobyl 137Cs concentrations have been used as threshold values.
The evaluation of whether the threshold is achieved or not is carried out by calculating the mean value for
all samples during the assessment period 2011 - 2016 in each assessment unit and comparing this against
the threshold values.

                                          Assessment units
This core indicator evaluates the activity concentrations of 137Cs using HELCOM assessment unit scale 2
(division of the Baltic Sea into 17 sub-basins). The assessment units are defined in the HELCOM Monitoring
and Assessment Strategy Annex 4.

 www.helcom.fi > Baltic Sea trends > Indicators                               © HELCOM               14
Relevance of the Indicator
                                Hazardous substances assessment
The status of the Baltic Sea marine environment in terms of contamination by hazardous substances is
assessed using several core indicators. Each indicator focuses on one important aspect of the complex issue.
In addition to providing an indicator-based evaluation of the status of radioactivity in the Baltic Sea, this
indicator also contributes to the overall integrated hazardous substances assessment.

                                            Policy relevance
The core indicator on cesium-137 in fish and surface waters addresses the Baltic Sea Action Plan's (BSAP)
hazardous substances segment's ecological objective 'Radioactivity at pre-Chernobyl level'.
The HELCOM Monitoring of Radioactive Substances (MORS) Expert Group has been working to implement
the Helsinki Convention on matters related to the monitoring and assessment of radioactive substances in
the Baltic Sea based on HELCOM Recommendation 26/3 Monitoring of Radioactive Substances.
The core indicator also addresses the following qualitative descriptors of the MSFD for determining good
environmental status (European Commission 2008):

    •   Descriptor 8: 'Concentrations of contaminants are at levels not giving rise to pollution effects' and
    •   Descriptor 9: 'Contaminants in fish and other seafood for human consumption do not exceed levels
        established by Community legislation or other relevant standards'
and the following criteria of the Commission Decision (European Commission 2010a):
    •   Criterion D8C1 Within coastal, territorial and areas beyond territorial waters the concentration of
        contaminants do not exceed the threshold values
    •   Criterion D9C1 The level of contaminants in edible tissues of seafood caught or harvested in the wild
        does not exceed maximum levels which are the threshold values.
The core indicator also supports the implementation of the Euratom Treaty, of which all EU Member States
are signatories. The Euratom Treaty requires actions in relation to monitoring and effects of discharges on
neighbouring states.

                        Role of radioactive substances in the ecosystem
A worldwide study on marine radioactivity has shown that the Baltic Sea has the highest average 137Cs levels
in surface water compared to other marine areas of the world (IAEA 2005). Levels of radionuclides in marine
biota are linked to the corresponding levels in seawater and sediments, via accumulation through food
chains. Anthropogenic radionuclides, including 137Cs, entering seawater can be bioaccumulated and/or
adsorbed on suspended particulate matter (composed mainly of plankton and mineral particles), which
accumulates in bottom sediments. Radionuclides can also be accumulated by higher flora and fauna
organisms.

 www.helcom.fi > Baltic Sea trends > Indicators                                © HELCOM                15
The complexity of food chains increases with the trophic level of the species considered. Fish are mainly
exposed to radionuclides and accumulate them through their food sources, not from water. Predators such
as cod and pike, have shown the highest 137Cs levels, but there was some delay in reaching their maximum
values after 1986, when compared to the trends in seawater. In the long-term, 137Cs time trends in biota
closely follow the trends in seawater (Zalewska & Suplińska 2013).
The harmful effects of 137Cs on marine organisms are related to the emission of ionizing radiation, which can
lead to internal damage, i.e. the effects are observed at the cellular level. It is difficult to establish
unequivocally which 137Cs concentrations can be considered as harmless because of the complexity of
reactions of individual organisms to its effects. Especially in the presence of other hazardous substances the
effects of radionuclides could be intensified (synergetic effects). Taking into account the present
concentration levels in Baltic Sea biota, no effects on animal health by 137Cs are expected as the lowest effect
levels observed in fish are more than three orders of magnitude higher compared to the measured doses to
these animals (according to ICRP 2008).
Ingestion of 137Cs with fish is the dominating exposure pathway of humans to man-made radioactivity in the
Baltic Sea. Therefore, 137Cs concentrations in herring, plaice and flounder can be suitable as indicators for
man-made radioactivity in the Baltic Sea. Internationally recommended maximal permitted concentrations
of 137Cs in foodstuff are in the range 100–1250 Bq/kg (European Commission 2012, 2010b).

                             Human pressures linked to the indicator
                   General                           MSFD Annex III, Table 2a

 Strong link                                         Substances, litter and energy
                                                     - Input of other substances (e.g. synthetic substances, non-
                                                     synthetic substances, radionuclides) – diffuse sources, point
                                                     sources, atmospheric deposition, acute events.
 Weak link

The development and use of nuclear power for military and peaceful purposes has resulted in the production
of a number of man-made radioactive substances and their release into the environment. For example, even
the routine operations of nuclear power plants cause small controlled discharges of radioactive substances,
but accidents at nuclear power plants can release considerable amounts of radioactivity into the
environment. Artificial radionuclides of particular concern to man and the environment, including 137Cs, are
formed by nuclear fission.
  Cs reaches the Baltic Sea waters from different sources (such as atmospheric fallout, river discharges, and
137

controlled liquid and gaseous discharges from working nuclear facilities) and becomes distributed within
other compartments of the marine environment. Radioactive fallout from the Chernobyl accident in 1986 is
the dominating source for 137Cs in the Baltic Sea.
The total collective dose of radiation from 137Cs in the Baltic Sea is estimated at 2,600 manSv, of which about
two thirds (1,700 manSv) originated from the Chernobyl fallout, about one quarter (650 manSv) from the
fallout from nuclear weapons testing, about 8% (200 manSv) from European reprocessing facilities, and about
0.04% (1 manSv) from nuclear installations bordering the Baltic Sea area.
 www.helcom.fi > Baltic Sea trends > Indicators                                    © HELCOM                  16
Dose rates and doses from natural radioactivity have been dominant except for the year 1986 where the
individual dose rates from the Chernobyl fallout in some regions of the Baltic Sea approached those from
natural radioactivity.
Since 1950, the maximum annual equivalent dose to individuals from any critical group in the Baltic Sea area
due to 137Cs is estimated at 0.2 mSv y-1. This value is lower than the doses that humans receive from natural
radionuclides in foodstuffs, which are e.g. 0.215- 0.521 mSv in Germany (BfS 2014), and much lower than the
dose limit of 1 mSv y-1 set for the exposure of members of the public in the IAEA - International Basic Safety
Standards (IAEA 1996). Considering the uncertainties involved in the assessment, it is unlikely that any
individual has been exposed from marine pathways at a level above this dose limit. Doses to man due to
liquid discharges from nuclear power plants in the Baltic Sea area are estimated at or below the levels
mentioned in the Basic Safety Standards to be of no regulatory concern (individual dose rate of 10 µSv y-1
and collective dose of 1 manSv). It should be noted that the assumptions made throughout the assessment
were chosen to be realistic and not conservative. Consequently, this also applies to the estimated radiation
doses to man.

 www.helcom.fi > Baltic Sea trends > Indicators                                 © HELCOM                17
Monitoring Requirements
                                      Monitoring methodology
HELCOM common monitoring relevant to radioactivity in the marine environment is documented on a
general level in the HELCOM Monitoring Manual under the sub-programme: Contaminants in biota and sub-
programme: Contaminants in water.
Monitoring methodology including methods, frequency and stations is described in detail in MORS Guidelines
(HELCOM Recommendation 26/3).
Over ten laboratories from the nine countries bordering Baltic Sea have contributed to the monitoring
programmes of the Baltic Sea by analyzing radionuclides in marine samples. The various analytical methods
used in the different laboratories are summarized in the HELCOM thematic assessment: Radioactivity in the
Baltic Sea, 1999–2006 (HELCOM 2009).

                                          Current monitoring
The monitoring activities relevant to the indicator that are currently carried out by HELCOM Contracting
Parties are described in the HELCOM Monitoring Manual in the relevant Monitoring Concept Tables.
Sub-programme: Contaminants in biota
Monitoring Concept Table
Sub-programme: Contaminants in water
Monitoring Concept Table
Stations are described in detail in the MORS Guidelines (HELCOM Recommendation 26/3) and in the HELCOM
MORE map service.

                                 Description of optimal monitoring
The current annual sampling of biota and seawater is considered to be of adequate frequency for the core
indicator. The monitoring of biota in each sub-basin depends on the availability of certain species during the
time of monitoring cruises and cannot be secured at all times.

 www.helcom.fi > Baltic Sea trends > Indicators                                 © HELCOM                18
Optimal monitoring figure 1. Monitoring stations for biota (left) and seawater (right) used to assess trends in radioactive Cs-137.
Dark blue symbols indicate data series incorporated into the specific assessment period 2011-2016 and pale blue symbols indicate
those stations also within the overall assessment period presented. HELCOM scale 2 assessment units are used for this indicator.

Gaps in monitoring in relation to the HELCOM assessment units are defined in HELCOM Monitoring and
Assessment Strategy Annex 4: 137Cs in seawater is sampled in all HELCOM sub-basins except for the Quark
and the Åland Sea.
Currently, the coverage of 137Cs in herring extends to most of the HELCOM sub-basins. There are, however,
no samples from the Northern Baltic Proper, Gulf of Riga, The Sound, or the Great Belt. Also, the northern
part of Eastern Gotland Basin is not covered by annual samplings.
  Cs in flatfish is sampled only in the most relevant southern Baltic Sea sub-basins.
137

 www.helcom.fi > Baltic Sea trends > Indicators                                                © HELCOM                     19
Data and updating
                                             Access and use
The data and resulting data products (tables, figures and maps) available on the indicator web pages can be
used freely given that the source is cited. The indicator should be cited as following:
HELCOM (2018) Radioactive substances: Cesium-137 in fish and surface water. HELCOM core indicator
report. Online. [Date Viewed], [Web link].
ISSN 2343-2543

                                                  Metadata
Result: Radioactive substances: Cesium-137 in seawater

Data: Radioactive substances: Cesium-137 seawater data

Result: Radioactive substances: Cesium-137 in herring

Result: Radioactive substances: Cesium-137 in flatfish

Data: Radioactive substances: Cesium-137 in fish data

Data source: HELCOM MORS Database.

Description of data: Herring and seawater data cover most of the Baltic Sea, but flatfish covers only southern
parts of the Baltic Sea. For time series maps, data from the year 2012 were used. The data are based on 137Cs
concentrations in a) herring (Clupea harengus L.), b) flounder (Platichthys flesus L.) and plaice (Pleuronectes
platessa L.) and c) surface seawater (samples 0–10 m). Analyses have been done either in round fish (without
head and entrails) or filets (herring), and for plaice and flounder from filets only. Concentrations (Bq kg-1)
have been calculated per wet weight of the samples. Seawater concentrations (Bq m-3) have been analyzed
in surface (0–10 m) water samples. Data of each matrix (herring, plaice and flounder and sea water) have
been averaged by sub-basin and by year.
The data is collected by national authorities and reported annually to the HELCOM MORS Database. In
addition to national quality assurance procedures, manual quality assurance is applied to the reported data
and data entries are verified annually by the HELCOM MORS Expert Group.

 www.helcom.fi > Baltic Sea trends > Indicators                                  © HELCOM                20
Contributors and references
                                              Contributors
HELCOM Monitoring of Radioactive Substances (MORS) Expert Group
Corresponding authors:
Tamara Zalewska, Institute of Meteorology and Water Management – National Research Institute, Maritime
Branch, Poland
Marc-Oliver Aust, Thünen Institute of Fisheries Ecology, Germany

                                                  Archive
This version of the HELCOM core indicator report was published in July 2018:
Radioactive substances HELCOM core indicator 2018 (pdf)
Earlier versions of the core indicator:
HOLAS II component - Core indicator report – web-based version July 2017 (pdf)
2013 Indicator report (pdf)

                                               References
European Commission (2008) Directive 2008/56/EC of the European Parliament and of the Council of 17 June
2008 establishing a framework for community action in the field of marine environmental policy (Marine
Strategy Directive). Official Journal of the European Union L 164/19.
European Commission (2010a) Commission Decision of 1 September 2010 on criteria and methodological
standards on good environmental status of marine waters (2010/477/EU). Off. J. Eur. Union L232: 12-24.
European Commission (2010b) Marine Strategy Framework Directive, Task Group 9: Contaminants in fish and
other seafood. EC JRC Scientific and Technical report.
European Commission (2012) Commission implementing regulation (EU) No 996/2012 of 26 October 2012
imposing special conditions governing the import of feed and food originating in or consigned from Japan
following the accident at the Fukushima nuclear power station and repealing Implementing Regulation (EU)
No 284/2012.
Federal Office for Radiation Protection (BfS) (2014) Contribution of food to radiation dose. (In German).
Available at: http://www.bfs.de/de/ion/anthropg/lebensmittel/dosisbeitrag.html.
HELCOM (2009) Radioactivity in the Baltic Sea, 1999–2006. HELCOM thematic assessment. Balt. Sea Environ.
Proc. No. 117. 60 pp.
IAEA (1996) International Basic Safety Standards for Protection Against Ionizing Radiation and for the Safety
of Radiation Sources. Safety Series No. 115. IAEA, Vienna.

 www.helcom.fi > Baltic Sea trends > Indicators                                © HELCOM                21
IAEA (2005) Worldwide Marine Radioactivity Studies -WOMARS, Radionuclides Levels in Oceans and Sea,
IAEA-TECDOC-1429. ISBN 92-0-114904-2. 125 pp.
International Commission on Radiological Protection ICRP (2008) Environmental protection – The concept
and use of reference animals and plants. Annals of the ICRP 108: 4-6.
Kanisch, G., Aust, M.-O. (2013) Does the Fukushima NPP disaster affect the caesium activity of North Atlantic
Ocean fish? Biogeosciences 10: 5399–5410.
Nielsen, S.P., Bengston, P., Bojanowski, R., Hagel, P., Herrmann, J., Ilus, E., Jakobson, E., Motiejunas, S.,
Panteleev, Y., Skujina, A., Suplinska, M. (1999) The radiological exposure of man from radioactivity in the
Baltic Sea. Sci. Tot. Environ. 237/238: 133-141.
Zalewska, T., Suplińska, M. (2013) Fish pollution with anthropogenic          Cs in the southern Baltic Sea.
                                                                            137

Chemosphere 90: 1760-1766.

                                   Additional relevant publications
HELCOM (2003) Radioactivity in the Baltic Sea 1992–1998. Balt. Sea Environ. Proc. No. 85. 102 pp.
HELCOM (1995) Radioactivity in the Baltic Sea 1984–1991. Balt. Sea Environ. Proc. No. 61. 182 pp.
HELCOM (1989) Three years observations of the levels of some radionuclides in the Baltic Sea after the
Chernobyl Accident. Balt. Sea Environ. Proc. No. 31. 155 pp.
Herrmann, J., Kanisch, G. (2010) Concentrations of the artificial radionuclide cesium-137 in Baltic Sea fish and
surface waters. HELCOM Indicator Fact Sheets 2010.
Ilus, E., Sjöblom, K.L., Ikäheimonen, T.K., Saxén, R., Klemola, S. (1993) Monitoring of radionuclides in the
Barltic Sea in 1989–1990. STUK-A103, Helsinki. 35 pp.
Outola, I. (2010) Total amounts of the artificial radionuclide cesium-137 in Baltic Sea sediments. HELCOM
Indicator Fact Sheets 2010.
Vartti, V.-P. (2010) Liquid discharges of Cs-137, Sr-90 and Co-60 into the Baltic Sea from local nuclear
installations. HELCOM Indicator Fact Sheets 2010.

                                                                                  HELCOM core indicator report
                                                                                              ISSN 2343-2543

 www.helcom.fi > Baltic Sea trends > Indicators                                    © HELCOM               22
You can also read