Bitcoin Price Forecasting using Web Search and Social Media Data - SAS
←
→
Page content transcription
If your browser does not render page correctly, please read the page content below
Paper 3601-2018
Bitcoin Price Forecasting using Web Search and Social Media Data
Rishanki Jain, Rosie Nguyen, Linyi Tang, Travis Miller, Advisor: Dr. Venu Gopal Lolla
Oklahoma State University
ABSTRACT
As the world’s first decentralized electronic currency system, Bitcoin has achieved great success and
represents a fundamental change in financial systems. The unique feature of Bitcoin is that its price
fluctuation relies mostly on people’s pertinent opinions instead of institutionalized money regulation.
Therefore, understanding the interplay between social media and the value of Bitcoin is crucial for Bitcoin
price prediction. In this study, related comments posted on the Bitcoin forum were analyzed. Conceptual
link of extracted key-words of interests were developed. Five major clusters to help gain insight into
Bitcoin’s user opinion were obtained from text mining analysis. Furthermore, cross-correlation between
Bitcoin price fluctuation and web search—Google Trends, social media—Twitter were examined
respectively. To better facilitate Bitcoin investor’s future investment, forecasting models were built, and
the effectiveness of proposed models were validated based on AIC and MAPE value comparison.
Forecasting model using both Bitcoin daily transaction data and Google Trends data was selected based
on better performance.
INTRODUCTION
Bitcoin, a decentralized electronic currency system, represents a radical change in financial systems after
its creation in 2008 by Satoshi Nakamoto. “It was released as an open-source software in 2009 on a
peer-to-peer system where transactions take place between users without an intermediary (7)”. In
contrast to the traditional banking system, Bitcoin allows user to move away from operational fees and an
authority filled with fraud and corruption. At the beginning of the year 2017, Bitcoin price was under
$1,000, it has rocketed up to nearly $14,000 lately, a gain of 14 times. The unprecedented jump in Bitcoin
price has triggered the explosion of worldwide attention in digital currencies. Questions towards the
nature of digital currencies and the driven force behind the dramatic rise of Bitcoin price within a short
time are raised.
Previous studies have shown that one of the unique features of Bitcoin is that its price fluctuation relies
mostly on people’s pertinent opinions instead of institutionalized money regulation. Twitter as one of the
major social media platforms gathers multidimensional perspectives from people worldwide. As an
example, at the end of November 2017, Warren Buffet, an influential figure in finance, tweeted his
optimistic opinion towards the cryptocurrency world and offered to send 1 $BTC to everyone who
retweeted his post if Bitcoin hits $12,500 by the next day. The positive tweet from Warren Buffet’s social
media together with other optimistic perspectives from various platforms had greatly boosted Bitcoin’s
attraction. Based on these previous findings, understanding the interplay between social media and the
value of Bitcoin becomes crucial in understanding the key factors behind its price fluctuation.
The present study examines correlation between social media such as the volume of Tweets and Bitcoin
price fluctuation. Additionally, the impact of web search data such as Google Trends on Bitcoin price was
also explored. To gain insights into user’s opinion formed around the Bitcoin topic, user’s comments from
an online forum were extracted and analyzed. To better facilitate Bitcoin investor’s future investment,
forecasting models with different properties were proposed and compared.
DATA UNDERSTANDING
Four different data sources were used during the study (Appendix A):
Historical BTC/USD
Twitter
Bitcoin forum
1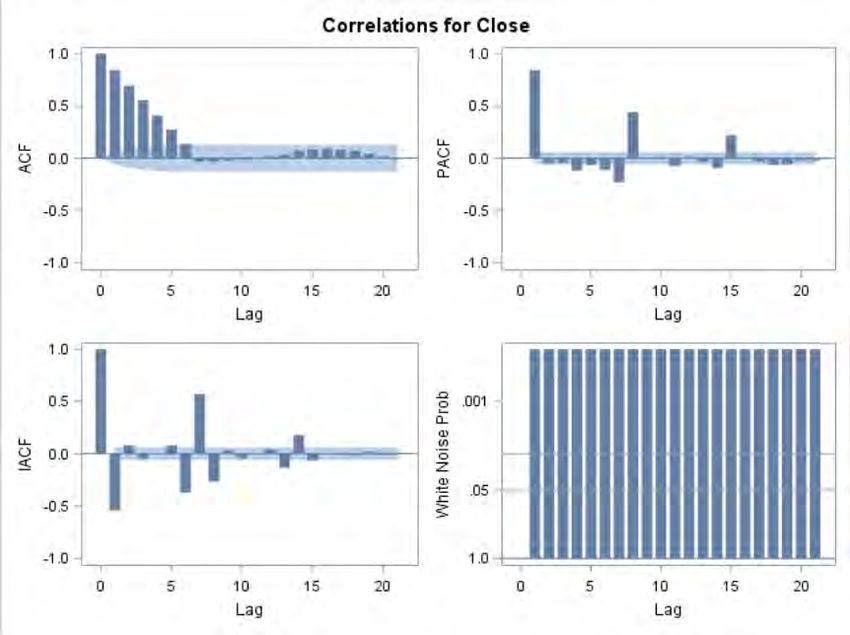
Google Trend
METHODOLOGIES
Figure 1. Project Flow
ANALYSIS RESULT
With the increasing popularity of Bitcoin, a growing number of Bitcoin users share information on online
forums. Bitcoin Forum (https://Bitcointalk.org/) as one of the popular online communities for Bitcoin users.
It provides a good platform for users to discuss topics like Bitcoin mining, development, technical issues
and the general Bitcoin ecosystem. The user gathered all the comments under the general section of
Bitcoin Discussion, terms associate with key concept was explored. To better understand what are the
major concerns among users when they talk about Bitcoin, a large amount of user comments toward
Bitcoin were clustered into several major clusters through text mining analysis using SAS Enterprise
Miner text mining node.
CONCEPT LINKS OF KEY WORDS OF INTERESTS
In this part of the study, a characteristic is considered as a concept describing a certain phenomenon or a
subject. A set of key words whose meanings were relevant are used to construct a concept. The thicker
the line is the stronger the connection is between terms. From the text interactive filter, it is shown that the
concept 'Bitcoin' is strongly associated with terms like profit, future, increase, popular, country, ban, value,
China (Appendix B Figure. 11.B.2). Words constituting the concept 'China' are Asia, Russia, contributor,
big, fail, ban, effect, and country as shown in (Appendix B Figure. 11.B.3).
TEXT CLUSTERS
There are 5 major clusters identified from Bitcoin forum's user comments through text mining. The content
and frequency of the relevant clusters are summarized as follows:
Figure 2. Bitcoin Forum User Opinion Clusters Summarization
From the text cluster results, perception about Bitcoin is the most discussed topic among users. Following
up, the investment value of Bitcoin and the legality of cryptocurrency in general also caught a lot of
attention among forum users. China as a big economic entity, its impact on the price fluctuation of Bitcoin
forms a big topic in the forum discussion. Security issue relates to Bitcoin and other cryptocurrencies also
raise concerns among users.
2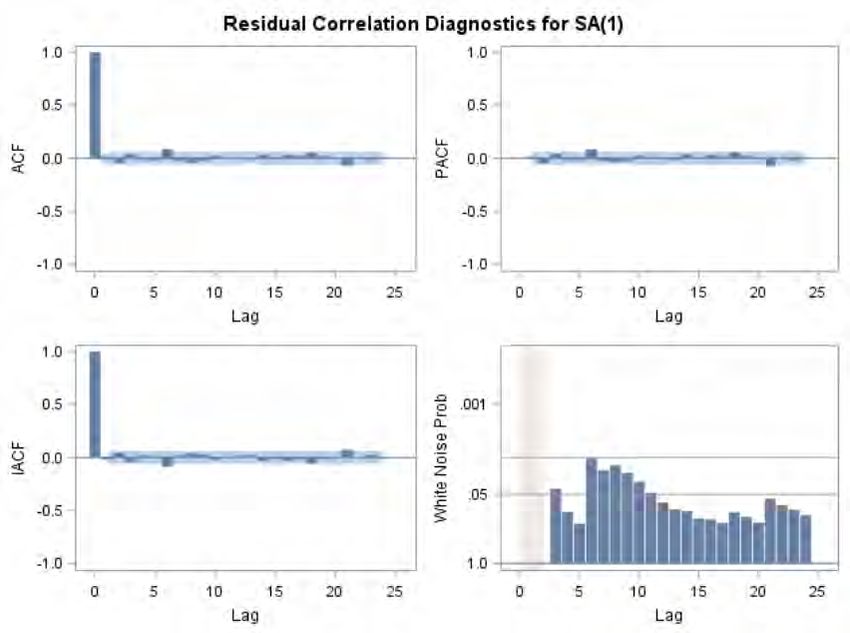
TWITTER VS. BITCOIN PRICE
With the development of technology, interested topics are usually discussed in social media such as
Twitter. The emerging of Bitcoin, a digital currency, which does not need middle men in transactions
draws tremendous attention from the public because of the huge jump in the price recently. At the
beginning of 2017, Bitcoin price was only under $1,000, the price now has rocketed up to nearly $14,000,
a gain of 14 times. Many people wanted to know what Bitcoin is and why it experienced a dramatic rise
within a short time, and above all, how can they buy it and shortly make a profit. The graph below shows
the trend of Bitcoin price and number of Tweets over the last month.

Figure 3. Trend Pattern Comparison between Bitcoin Price and Tweets Volume
As shown in Figure 3, there was seemingly a similar trend between these two lines. The higher the price
is, the larger the number of Tweets occurs. A correlation test was performed to make sure the
interpretation unbiased. The Pearson test in Figure 13.C.1 (with p-value less than 0.05) shows that there
is a strong correlation of 0.86 between Bitcoin price and the volume of Tweets. The test again proved that
the higher Bitcoin price is the more people talk about it in social media.

GOOGLE TRENDS VS. BITCOIN PRICE
In this part of the study, correlation between web search data and Bitcoin price was examined. It is shown
as in the Figure 4 that there is a causality relationship between the Bitcoin price and web search
component: Google Trends. The max correlation is at lag 0 and the next best is for lag -1 followed by lag
-2 as displayed in Figure 5. The correlation is positive implying that when the present-day Google search
increases, the Bitcoin price increases for the next day. To justify the above observation statistically, the
Granger causality test was employed. The output of the test (Appendix D Figure 35.D.22) confirms that
Google Trends influenced the Bitcoin price over the time.

                                                     3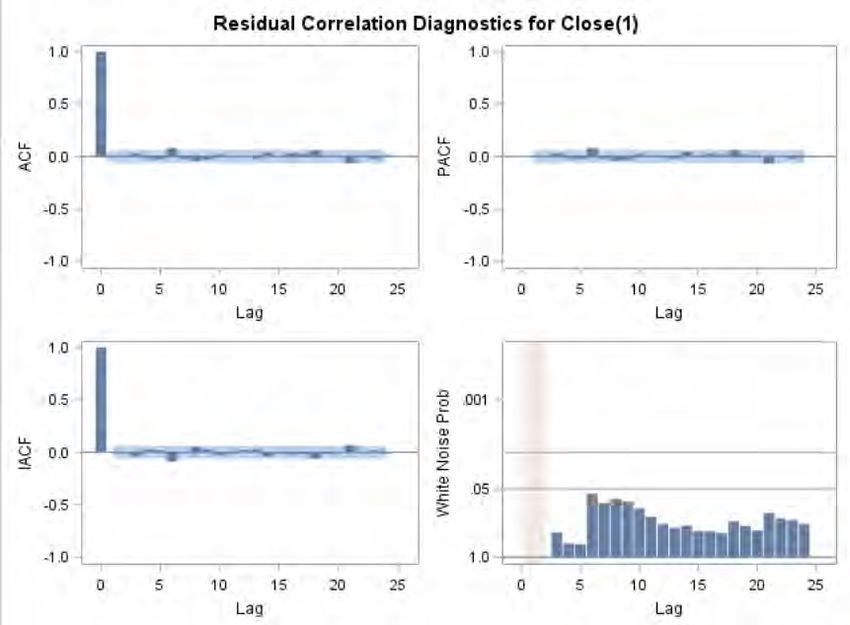
Figure 4. Cross-Correlation Function between Google Trends and Bitcoin Price

Figure 5. Correlation values between the lags

TIME SERIES MODELING
A series of auto regressive models were employed on the stationary data for model comparison.
ARMA(p,q) model could have been used to model returns data. However, In this project modelling of
original data is done using ARIMA(p,d,q) models.

Figure 6. Bitcoin Time Series Model Comparison—Fits Statistics
From the summarized table (Figure 6), it is shown that the ARIMAX (2,1,0) model with the google trend as
an independent variable (X) has the lowest AIC and MAPE value. General assumptions of time series
model such as stationarity, normality and significant parameters were examined and satisfied. The
detailed description regarding to the output of each model can be referred as in Appendix D.

                                                   4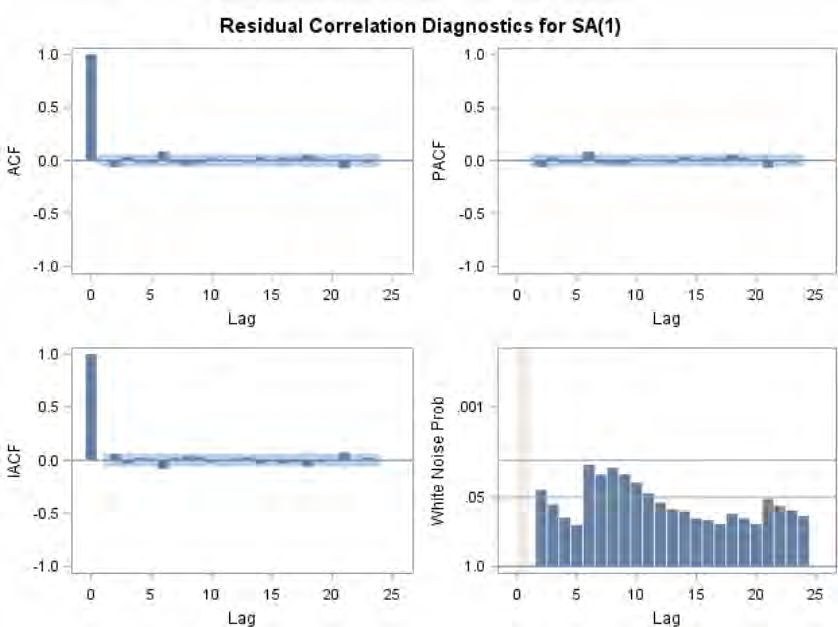
FORECASTING
The ARIMAX (2,1,0) model was selected for Bitcoin price forecasting, based on lowest AIC and MAPE.
Employing SAS Studio, we selected 2 weeks ranging from Oct 4th, 2017 to Oct 18th, 2017 with 14-day
holdout sample for validation.

Figure 7. Comparison of Bitcoin Actual and Predictive
To evaluate the prediction result, the forecasted price was cross verified with actual price. The model
doesn’t forecast more days as in ARIMA the forecast values start approaching the mean value. The
detailed description of forecasting procedure can be referred as from the Appendix D.

CONCLUSION
With Bitcoin’s recent breakthrough of the $10,000 barrier, its acceptability and popularity has drawn much
attention in multiple ways. The present study is noteworthy in that three major perspectives were taken
into consideration in understanding key driven factors behind Bitcoin’s price fluctuation, especially the
impact of both web search trends and social media. User opinions were identified from text analysis of
Bitcoin forum’s user comments. It shows that Bitcoin perception, investment value, cryptocurrency
legality, China and Security are five major concerns among users. Both Google Trends and Twitter
volume present correlation with Bitcoin’s price fluctuation. Specifically, Twitter volume and Bitcoin price
shows a strong positive correlation. In addition, the proposed forecasting model using web search
component--Google Trends as an extra predictor yields better Bitcoin price prediction performance with
the MAPE of 1.07%.
For future studies, we would like to explore more on the Twitter data with a longer extension of the time
frame. Additionally, we plan to examine the coefficient between keywords of interest and Bitcoin price.
Along these lines, the contribution of these keywords to Bitcoin price prediction would be worth
investigation. Furthermore, we expect to combine different time series models with special events added
to have better accuracy in prediction. We will also consider examining other financial assets on the bitcoin
price so that we can control the impact of economic trends.

                                                     5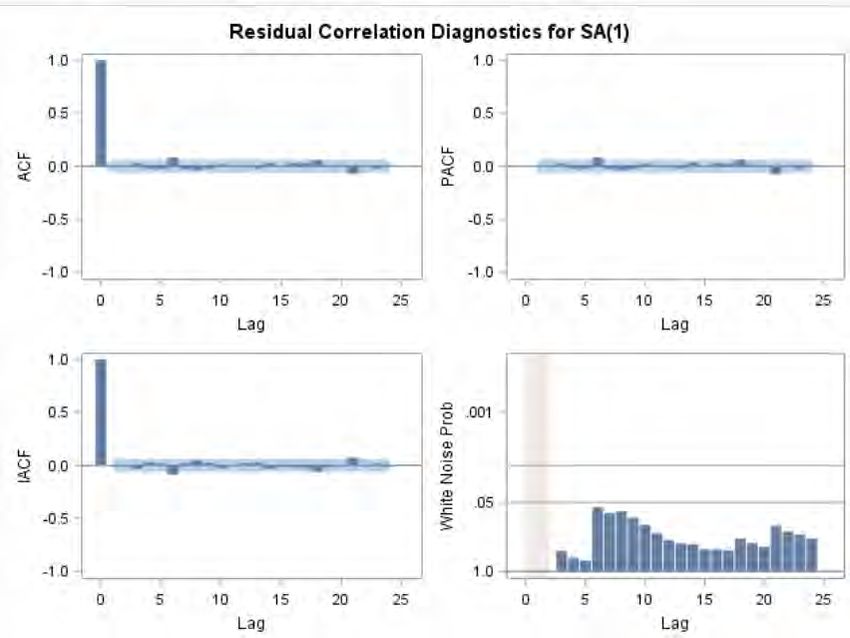
REFERENCES
1.   Nakamoto S. Bitcoin: A peer-to-peer electronic cash system. 2008.
2.   Li N, Wu DD. Using text mining and sentiment analysis for online forums hotspot detection and
     forecast. Decision support systems. 2010;48(2):354–68.
3.   Juea W, Jian-pinga Z, Bao-huab Z, Cheng-ronga W. Online Forum Opinion Leaders Discovering
     Method Based on Clustering Analysis [J]. Computer Engineering. 2011;5:017.
4.   Kim YB, Lee SH, Kang SJ, Choi MJ, Lee J, Kim CH. Virtual world currency value fluctuation
     prediction system based on user sentiment analysis. PloS one. 2015;10(8):e0132944. pmid:26241496
5.   Kim YB, Lee SH, Kang SJ, Choi MJ, Lee J, Kim CH. When Bitcoin encounters information in an
     online forum: Using text mining to analyses user opinions and predict value fluctuation. PloS one.
     2017;12(5):e0177630. pmid:26241496
6.   Matta M, Lunesu I, Marchesi M, editors. Bitcoin Spread Prediction Using Social and Web Search
     Media. UMAP Workshops; 2015.
7.   Bitcoin Wiki, Available from https://en.Bitcoin.it/wiki/Main_Page
8.   Kevin    Lu.    What      is  Bitcoin’s      correlation    with     other    financial     assets?
     https://www.signalplot.com/what-is-bitcoins-correlation-with-other-financial-assets/

CONTACT INFORMATION
Your comments and questions are valued and encouraged. Contact the author at:
     Authors: Rishanki Jain, Rosie Nguyen, Linyi Tang, and Travis Miller
     Location: Oklahoma State University
     Email: rishanki.jain@gmail.com
            linyit@ostatemail.okstate.edu
            rosie.nguyen@okstate.edu
            travis.miller12@okstate.edu

SAS and all other SAS Institute Inc. product or service names are registered trademarks or trademarks of
SAS Institute Inc. in the USA and other countries. ® indicates USA registration.
Other brand and product names are trademarks of their respective companies.

                                                    6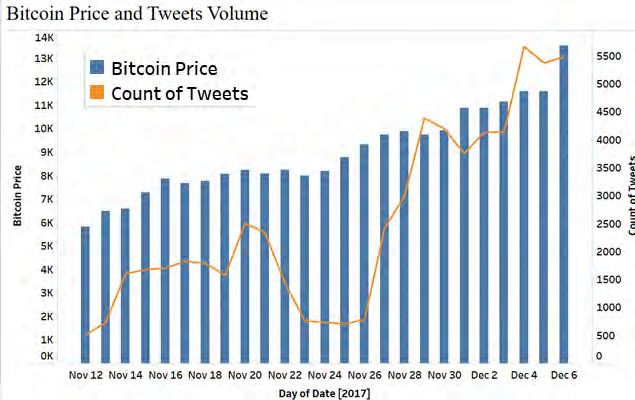
APPENDIX A: DATA EXTRACTION
Historical BTC/USD price data was pulled from:
https://www.kaggle.com/sudalairajkumar/cryptocurrencypricehistory/ data
The dataset consists of the following:
Date – Date of observation
Open Price
High
Low
Close Price
Volume – Number of Transactions
Market Cap – Amount of Bitcoin in circulation
Twitter data was pulled using Twitter Archive add on with google.
Rules were created to run every 15 minutes and search for new tweets.
Below is an example of a rule created. Min_Retweets:5 was used to omit spam tweets from
results.
Data was then combined, and duplicates removed in excel.
Figure 8.A.1: Setting for scraping Tweets in Google Sheet
Bitcoin forum data was scraped the website https://Bitcointalk.org/. We have scraped the posts under
the “Bitcoin Discussions” tab. The data ranges from October 2014 to October 2017. The data
consists of the time stamp of the comment and the user comments on posts. The data was then
cleaned to ready it for Enterprise Miner. Quoted comments from the comment column (where a user
responded to another user and the original comment was brought into the new comment) and
irrelevant posts (Rules of the page) were removed to eliminate duplicate records.
7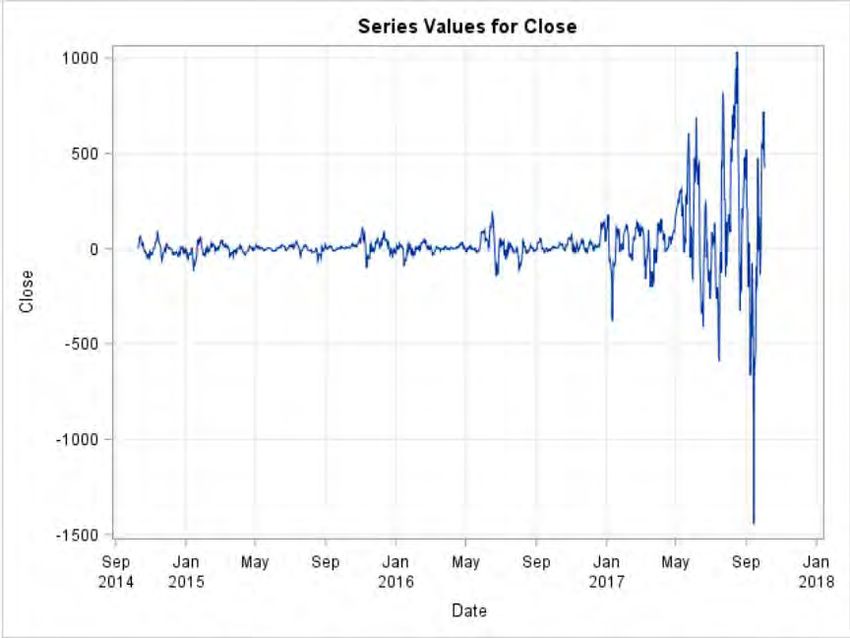
Google Trends – Google Trend data was pulled using Google Trends filtering on Bitcoin and Date
range of October 2014 to October 2017
Figure 9.A.2: Number of searches on Bitcoin in Google Trend
Twitter data was pulled using Twitter Archive add on with google.
APPENDIX B: TEXT MINING
Data was imported into the Enterprise Miner 14.2 and operated as shown in the following flow chart:
Figure 10.B.1: Enterprise Miner 14.2 flow chart
8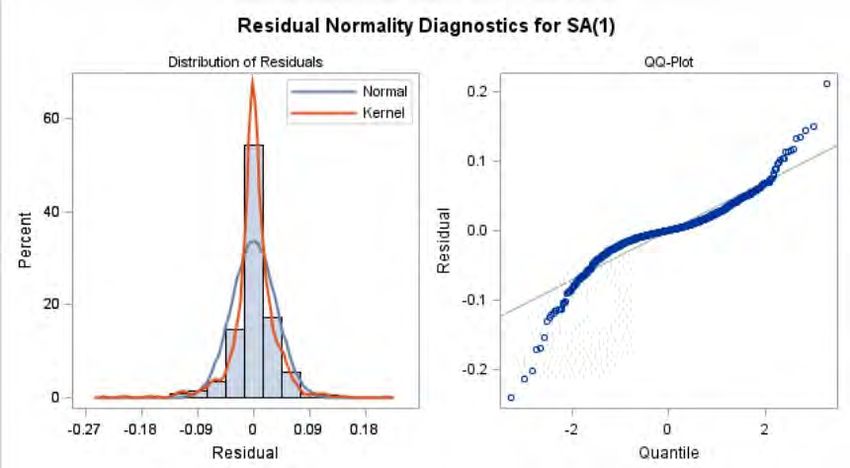
Figure 11.B.2: Concept Link of Bitcoin

Figure 12.B.3: Concept link of China

APPENDIX C: TWITTER ANALYSIS

Figure 13.C.1: Pearson test for correlation between Bitcoin Price and Count of Tweets

                                                9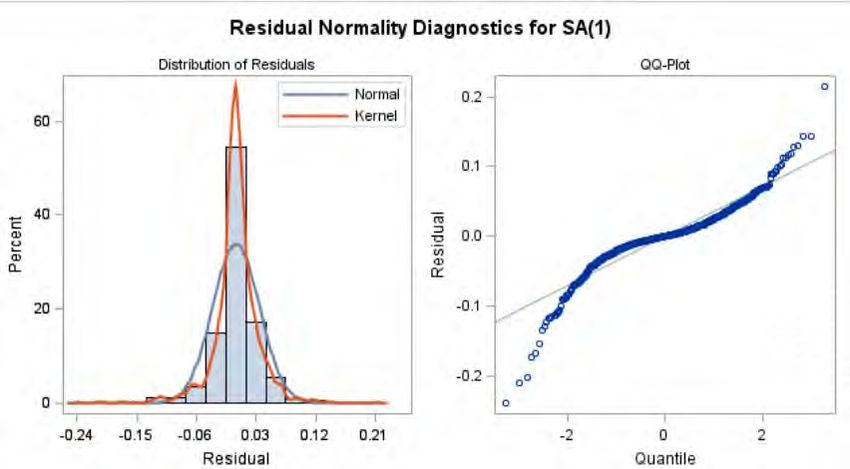
APPENDIX D: TIME SERIES FORECATING
1. Studying the Time Series Data for Bitcoin Price
Our original Bitcoin data looks like this. The graph shows an explosive increasing behavior after Jan 2017
till present. To check the stationarity of the time series we can do a decomposition analysis to see if there
are any seasonal or trends visible.

Figure 14.D.1: Bitcoin data Trend
2. A Decomposition Analysis

Figure 15.D.2: Decomposition Analysis-Trend           Figure 16.D.3: Decomposition Analysis-Seasonal
Here we can see that the time series has both a trend and seasonal component in its decomposition.

3. Identification of the Differenced Series
Looking at the Dicker fuller test for stationarity below we have p-values of tau that are greater than the
0.05. Hence, we retain our hypothesis that the series shows non-stationarity.

                                                     10
Figure 17.D.4: Dicker-Fuller test of Stationarity
To control the seasonal component of the series and the large p-values that we get in the augmented -
dicker-fuller test we can understand that none of the p-values are small enough to cause you to reject the
null hypothesis that the series has a unit root. It tells us the series should be differenced.
Figure 18.D.5: First Differenced Dataset
Here our series is seasonally adjusted. Next, we will try to control for the exponentially rising time series
plot. We can do a log transformation to remove the trend component.
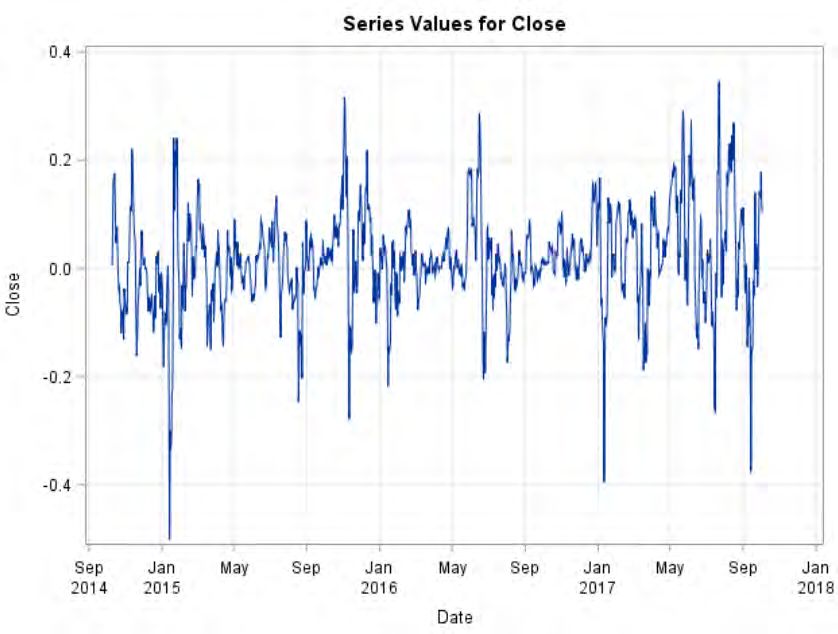
Figure 19.D.6: Stationary Series
There seems to be a stationary series now with no trends, constant mean and variance.
114. Estimation and Diagnostic Checking Stage
Figure 20.D.7: Diagnostics of stationary series
Looking at our ACF, PACF plot we can try to identify the estimates for the new stationary time series. The
white noise probability graph also verifies our claim that the series is stationary and there is no white
noise present.
The ACF plot tells us that this is an auto-regressive model which is slowly decaying. We can do
diagnostic statistics to see if the AR (1) model is adequate. Other candidate models include an MA (1)
model and low-order mixed ARMA models. In this example, the AR (1) model is tried first.
5. Estimating an AR (1,1) Model:
Figure 21.D.8: Fit statistics of AR (1,1)
12Figure 22.D.9: Diagnostics of AR (1,1)
Figure 23.D.10: Normality for AR (1,1)
From the outputs obtained in the above model. The AIC is around -4202.35 (the reason we might be
getting negative AIC values are that we have used log values for our modelling). When we check the
residuals graph the white noise probability assumption is being rejected. Most of the p-values are greater
than 0.5 i.e. there is no white noise available in the residuals. Here the model is inadequate, and we
might consider adding an MA (1) part to it.
136. Estimating an ARIMA (1,1,1) Model:
Figure 24.D.11: Fit statistics of ARIMA (1,1,1)
Figure 25.D.12: Diagnostics of ARIMA (1,1,1)
Figure 26.D.13: Normality for ARIMA (1,1,1)
14In this model the AIC seems to have dropped to -4201.51. And looking at the residual panel, we see there
isn’t white noise present in the residuals. Again, we cannot use this model. The MA part isn’t really
improving our model.
7. Estimating an ARIMA (2,1,0) Model:
Figure 27.D.14: Fit statistics of ARIMA (2,1,0)
Figure 28.D.15: Diagnostics of ARIMA (2,1,0)
15Figure 29.D.16: Normality for ARIMA (2,1,0)
Figure 30.D.17: Model Equation of ARIMA (2,1,0)
Here we have dropped our MA component and instead increased the auto-regressive part. We have
considered the MA (2) component. Here the AIC seems to have dropped again to (-4197.56) But looking
at the residuals panel. We can see the in this case, the test statistics will not reject the no-autocorrelation
hypothesis as all the p-values >0.05. The normality residual doesn’t show a very satisfactory qq-plot, but
we will ignore that for now and continue with this model.
8. Input Social Media regressor-Google Trends
Figure 31.D.18: Original Data plot for GT and Bitcoin Price
16Figure 32.D.19: Stationary Plots
After we have decided on our ARIMA model, now we need to include an input series in this case as we
are trying to establish relationships between social media and Bitcoin price. We have included the Google
trends as our Social Media component. Looking at the above graphs. The first one is the plot of google
trends for the same time frame Oct2014-Oct2017. It follows a similar explosive pattern like our Bitcoin
price. It could be a reverse causality relationship. We will consider that by studying the Cross-correlation
Plot of the price and Google trend. However, first we make it a stationary process by taking a log and a
difference just like the way we had taken for Bitcoin Price.
Figure 33.D.20: CCF plot for Bitcoin price vs Google Trends
Figure 34.D.21: Correlation values between the lags
On studying the CCF lag plots we can see that the max correlation is for lag 0 and the next best is for lag
-1. Although these correlations are significant if we are taking a confidence interval of 98% else it can be
ignored too. Here we understand the cross correlations for lags is higher than for leads. That means
Bitcoin price is leading the google trends probably not by a very large margin but surely there is some
amount of correlation at lags -1, -2.
17To substantiate the claim Granger causality test is also carried out using Proc VARMAX.
Figure 35.D.22: VARMAX Procedure
The null hypothesis of the Granger causality test is that GROUP1(Closing Price) is influenced only by
itself, and not by GROUP2(Google Trends). The output shows that we reject that price is influenced by
itself and not by Google Trends at the 0.05 significance level for Test 1 as p value is 0.03 and we can
also reject that Google trends is influenced by itself and not by price for Test 2. Indeed, we can witness a
reverse causal relationship between the social media component and Bitcoin Price.
9. ARIMAX model:
To see whether there is any significance of the google trend in the ARIMA model, we will consider adding
Google trends as a regressor variable in our ARIMA (2,1) model. Here are the following results:
18Figure 36.D.23: Residual Correlation Diagnosis for SA (1)
Looking at the estimates table we have the estimates of google trend very low (0.0045). Which means
that with every one-unit increase of google trend the price gets effected by 0.4% which is very less
significant.
Figure 37.D.24: Residual Plot
19Figure 38.D.25: Model ARIMAX with Google Trend as regressor
Checking out the residuals for normality and white noise we can see the model fulfills all assumptions and
is fairly a stable model. Its AIC is also greater than the above models. (-4205.06). We have also
calculated MAPE (Mean Absolute Percentage Error) for all the above models to check if we are getting
any other result.
Figure 39.D.26: Model comparison
It seems the ARIMAX (2,1) model inclusive of the google trends variable is our best fitted model with
lowest MAPE% value.
10. Forecasting Stage:
Once we have satisfactorily decided on our time series model now comes the stage to predict our future
Bitcoin price values. The SAS studio gives us this easy choice of running our models and directly
forecasting them. The plot below shows prediction on the holdout sample. We have taken 12 daily
samples as our holdout and 5 daily samples as forecast values.
20Figure 40.D.27: Forecast for Bitcoin
Figure 41.D.28: Actual and Forecast price of Bitcoin
The Red line in the above graph is the original Bitcoin price, the blue is the forecasted value. As you can
see the forecasted values after Oct 3rd, 2017 are well in between the 95% Confidence interval depicted by
the green lines in the above plot.
Out of general curiosity we checked for the forecasted dates. As the analysis was done earlier we easily
obtained the actual values for the respective 12 dates. We haven’t used the model to forecast more days
21as usually in ARIMA models the forecast starts approaching the mean value which would be ideally
incorrect. Hence as the prediction is daily we used only 12 days as our forecast sample.
Figure 42.D.29: Table of Bitcoin actual and predicted price
We can say Indeed by using the Social component (google Trend) as a regressor in our ARIMA model we
were able to get slightly better predictions and a mean absolute error of 1.07% which is lowest among all
other test models we ran.
CONTACT INFORMATION
Your comments and questions are valued and encouraged. Contact the author at:
Authors: Travis Miller, Rosie Nguyen, Rishanki Jain, and Linyi Tang
University: Oklahoma State University
SAS and all other SAS Institute Inc. product or service names are registered trademarks or trademarks
of SAS Institute Inc. in the USA and other countries. ® indicates USA registration.
Other brand and product names are trademarks of their respective companies.
22You can also read