Employment and Support Allowance: Work Capability Assessments, Mandatory Reconsiderations and Appeals
←
→
Page content transcription
If your browser does not render page correctly, please read the page content below
Employment and Support Allowance: Work Capability
Assessments, Mandatory Reconsiderations and Appeals
Quarterly ESA-WCA outcomes to December 2017 (MRs to April 2018) Published: 14th June 2018 Great Britain National Statistics
Employment and Support Allowance (ESA) replaced incapacity benefits in October 2008 and offers support for ill or disabled people. Claimants must participate in a Work
Capability Assessment (WCA) to check eligibility. Those found eligible for ESA are either placed in the Work Related Activity Group (WRAG), which offers support in preparing for
work, or the Support Group (SG) if unable to work or complete work-related activity. Those not eligible are found Fit for Work (FFW). Since October 2013, if claimants disagree
with assessment outcomes they can request a Mandatory Reconsideration (MR). If they disagree with the MR outcome they can appeal to Her Majesty’s Courts & Tribunal
Service (HMCTS).
Main stories
Completed initial assessments have stayed stable in the quarter to December 2017 at 100,000. Completed repeat assessments have fallen from 140,000 to 130,000.
Outcomes for initial claims completed in the quarter to December 2017 were 41% SG, 20% WRAG and 38% FFW.
ESA-WCA MRs registered in April 2018 stood at 12,000 after peaking at 22,000 in March 2017. 76% of cleared MRs were not revised. MR median clearance times decreased
from 11 days in January 2018 to 9 days in the months to April 2018.
For initial WCAs completed in December 2017, the median end-to-end clearance time fell by two weeks to 17 weeks.
Work Capability Assessment Mandatory Reconsiderations Appeals
Completed initial and repeat assessment volumes Appeals completed on initial FFW outcomes have
MR registrations have fallen in recent months
have decreased slightly since last quarter fallen slightly. 39% decisions were upheld
All Completed Assessments, by quarter MRs registered, by month Appeals completed (for initial FFW assessments)
Thousands
1At a glance Page What you need to know
These statistics are released quarterly and cover information on ESA-WCA outcomes, MRs, appeals and
WCA Process Flow 3 clearance times for initial claims sourced from:
DWP’s benefit administration datasets including MR data
Healthcare provider assessment data
Sankey Diagram 4 HMCTS appeals data for completed appeals
Additional experimental ESA-WCA cohort statistics are available which allow us to view claimants through the
stages of their ESA-WCA journey – see page 3.
WCA clearances and outcomes 5
What’s new in this release?
For the first time, selected ESA WCA breakdowns have been made available on Stat-Xplore, DWP’s online
MR registrations, clearances and outcomes 7 tabulation tool. Stat-Xplore contains information on WCA outcomes by claim start date and completed
assessment date. We will look to extend the information available on Stat-Xplore for future releases.
We are also publishing for the first time lower-level geographical breakdowns (Region, Local Authority and
Appeals clearances and outcomes 9 Westminster Parliamentary Constituency) for WCA outcomes via Stat-Xplore. Regional breakdowns for initial
clearance times have been included in the accompanying excel tables. Geographies have been derived using
an improved methodology. For further details, see methodology note.
Health Conditions and ESA group allocation 10 We have provided the data in excel tables as usual for this release, but next quarter if information is available in
Stat-Xplore it won’t be duplicated hence will not be made available via excel.
What time periods are covered in this release?
Customer journey clearance times 11
Robust data for both the regular and experimental cohort information is available for claims that began at least 6
months following assessment date or, for initial assessments, nine months following the date of claim. This is
due to time required to complete assessments, record and process data accurately and align with other
About these statistics 12 publications. Hence, only claims made before the end of September 2017, assessments completed up to
end of December 2017, completed appeal outcomes for initial FFW decisions for claims started up to
March 2017 and clearance times for initial ESA WCAs completed up to the end of December 2017 are
included in these statistics. Throughout the release, figures are presented by assessment date, unless
Lead Statistician: Lottie Devaney otherwise stated.
lottie.devaney1@dwp.gsi.gov.uk
ESA Work Capability Assessment, Mandatory Reconsiderations and Appeals process
DWP Press Office: 0203 267 5144 The following flow chart, containing experimental data, shows the claim process to assess ESA entitlement. If
claimants disagree with their assessment outcome they can ask DWP to review it by registering an MR.
Comments? We welcome feedback Following the MR outcome if the claimant still disagrees with the decision, they can appeal to HMCTS.
There are 3 types of Work Capability Assessments:
Published: 14th June 2018 Initial assessment – for new ESA claims
Next edition: September 2018 Repeat assessment – existing claimants must undergo regular reviews; timescales depend on medical
condition
ISBN 978-1-78659-073-2 Incapacity Benefit reassessment (IBR); all IB claimants will eventually be reassessed for ESA or Universal
© Crown copyright Credit
2Overview of the Work Capability Assessment, Mandatory Reconsideration (MR) and Appeals process for initial and
repeat ESA WCAs starting October 2013 – September 2017 - (Experimental)
ESA WCAs and MRs prior to Assessment Assessment Mandatory Reconsiderations Appeals4
being completed outcome2,$ raised following Assessment2,3
40% FFW 1% FFW 0% FFW
9% WRAG 69% WRAG 95% WRAG
35% 51% SG 30% SG 5% SG
Appeal of WCA
decision outcome,
WCAs closed by the claimant follow ing a
(1,200,000) com pleted MR
13% 62%
ESA 15% Revised 21% Overturned
WCAs 59% (39,000) have a
decisions
go on to (39,000)
started1 Complete + completed
(3,500,000) 6% the
register an MR appeal after
(310,000) an MR
38%
WCAs still in progress Assessment 86% (63,000)
(220,000) (2,100,000) Upheld
Not
decisions
0.5% Revised
(24,000)
(270,000)
MRs
24% * withdrawn
Revised (1,400)
MRs registered
0.4% 88% FFW 99.7% FFW
prior to WCA
outcome Withdrawn
(34,000) 10% WRAG 0.3% WRAG
*Non-return of
74%
Not Revised
Questionnaire
* Fail to attend
1% SG5 0% SG
Medical
Assessment
Footnotes:
1) All ESA initial and repeat WCAs between October 2013 and September 2017* (the latest period that allows sufficient time for final outcomes to have been recorded). FFW=Fit for Work, WRAG=Work
Related Activity Group, SG=Support Group.
2) Statistics show the outcome based on healthcare provider recommendation - in some cases this may not always be the final outcome as outcomes are sometimes changed due to reconsideration. Due
to data source recording limitations, this is the best proxy available. A proxy is also used to determine a small proportion of revised MR outcome results - where the final result is not captured.
3) A number of FFW cases have their case outcomes revised but still fall within FFW group as they still aren't awarded enough points to move to a different group.
4) Appeals include all ESA WCA completed appeals by the claim start date.
5) A small number of cases are 'Not Revised' and appear in SG. We are currently unaware of the exact reasoning for this. Therefore please treat these cases with caution.
6) Numbers of claimants are rounded therefore totals may not sum and percentages may not be fully representative of figures shown.
* A small number (around 10%) of pre-assessment MR registrations may go onto appeal their MR decision. Percentages may not sum to 100% due to a small proportion of MRs still in progress.
+ Some claimants may still not agree with the group they have been placed in and go on to appeal the MR decision. Less than 1% of all post ESA WCA appeals come from the revised grouping.
$ Some cases may not yet have an outcome, or may have been withdrawn, cancelled, clerical cases - so WCA outcome percentages are derived using those with an actual FFW, WRAG or SG outcome.
We only get information for completed appeals - so we don't know how many appeals are in progress. 3Overview of the Work Capability Assessment, Mandatory Reconsideration (MR) and Appeals process for initial and
repeat ESA WCAs starting October 2013 – September 2017 - (Experimental)
The following diagram gives a visual representation of proportions at each stage of the ESA Work Capability Assessment (WCA) process. The relative thickness of each segment
represents the volume of cases flowing through each stage. For initial and repeat ESA WCAs which started between October 2013 and September 2017:
59% have had a completed assessment. WCAs relating to the remaining claims are either still in progress or have been closed by the claimant.
310,000 MRs have been registered in relation to the 2,100,000 completed WCAs.
99% of these MRs have been cleared, with the decision maker's original decision revised 13% of the time.
21% of assessments with a completed MR also complete an appeal. Of this group (63,000 cases), the latest case decision was upheld 38% of the time.
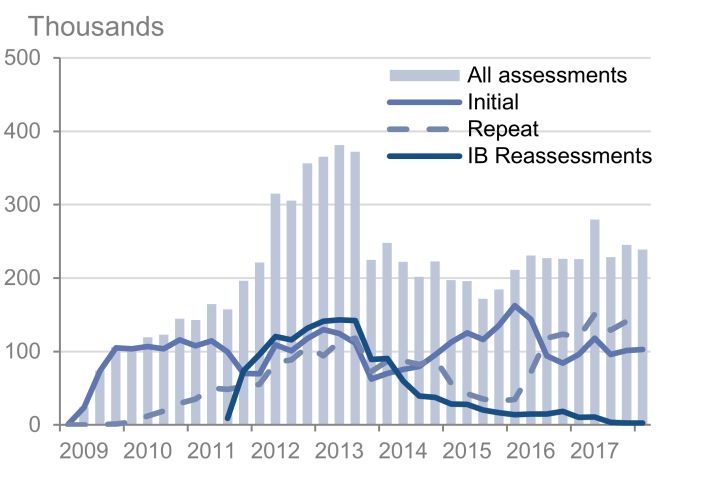
4ESA initial and repeat assessment outcomes, IB reassessments
56% of all assessments cleared in the latest quarter were for ESA repeat assessments
Thousands
500
Main Findings
All assessments
All Assessments
Initial
Cleared Repeat In the latest quarter to December 2017 the majority (56%) of cleared ESA-WCA
400
IB Reassessments assessments were for repeat assessments.
300
At the end of 2013, IB reassessment and repeat assessment volumes dropped
significantly. The majority of IB reassessments were completed by that point and
the focus was moved from assessing existing claims (including repeat
200 assessments) to clearing new claims. IB reassessments are now 99.8%1 complete.
ESA repeat assessment volumes have increased in recent quarters as processing
100 was re-introduced in December 2015, after almost two years of focussing on initial
assessments. During this period, claimants could still request a repeat assessment,
for example if they developed a new condition or their condition deteriorated. Since
0
2009 2010 2011 2012 2013 2014 2015 2016 2017 processing of repeat assessments was re-introduced, the number of repeat
assessments has increased from 35,000 in the quarter to December 2015 to
130,000 in the latest quarter.
IB Reassessments IB Reassessments Repeat assessments
introduced April 2011 over 90% complete supressed January 2014 See accompanying tables and Stat-Xplore for further breakdowns.
IB Reassessments over
Repeat and initial assessment volumes have decreased this
90% complete
quarter
There has been a slight decrease in completed initial and repeat volumes this
Thousands Thousands quarter compared to the previous quarter due to there being reduced working days
100 100 in December.
Repeat Initial
assessments SG Since the re-introduction of repeat assessments, their numbers have increased
80 assessments 80
significantly meaning there has been a general increasing trend across all
SG FFW outcomes (SG, WRAG and FFW), however both FFW and SG outcomes have
60 60
dropped slightly this quarter.
40 40 Repeat assessments accounted for 56% of all assessments in the latest quarter.
WRAG
In the quarter to December 2017, SG and WRAG numbers increased for initial
20 20
assessments and FFW numbers decreased owing to higher initial assessments
FFW WRAG completed than in the previous quarter.
0 0
2009 2011 2013 2015 2017 2009 2011 2013 2015 2017 See accompanying tables and Stat-Xplore for further breakdowns.
Note: Assessments cleared and outcomes are shown in quarters by
completed assessment date. 1 The percentage shown excludes all IB cases closed before assessment
5Assessment outcomes for ESA initial assessments
The proportion of outcomes for ESA initial assessments has started to stabilise in recent quarters
Percentage
Main Findings
100 FFW
For the 100,000 ESA initial assessments cleared in the latest quarter to December
90 SG 2017:
WRAG
80
Support Group 41% Up 2 percentage points since previous quarter
70
Work Related 20% Up 1 percentage point since previous quarter
60 Activity Group
50 Fit for Work 38% Down 4 percentage points since previous quarter
40 Outcomes of initial assessments entitled to ESA (assigned to SG or WRAG)
increased by 4,300 in the latest quarter to December 2017 to stand at 63,000.
30
Historically, there have been significant changes in the volumes of initial assessment
20
assigned to each outcome. In recent quarters, the proportion of initial outcomes has
10 increased slightly, as shown in the chart, with an increase of 2 percentage points for
SG, 1 percentage point for WRAG and a drop in 4 percentage points for FFW
0 outcomes in the latest quarter.
2009 2010 2011 2012 2013 2014 2015 2016 2017
See accompanying tables and Stat-Xplore for further breakdowns.
Note: Assessment outcomes are shown in quarters by completed
assessment date. Percentages may not sum to 100 due to rounding.
ESA and IBR assessments: Cleared outcomes for the latest quarter show big differences across claim types
ESA initial WCA ESA Repeat WCA IB Reassessments For assessments cleared in the latest quarter to December 2017, 43% were initial
ESA claims, 56% were ESA repeat assessments and 1% were IB reassessments.
20% 17% 19% 16% 13% SG In the latest quarter, to December 2017, most WCA clearances (56%) were repeat
assessments. This is an increase from 16% in the quarter to December 2015. This is
WRAG
38% due to the re-introduction of repeat assessments in December 2015 after almost two
43% of total 56% of total 1% of total FFW years of focussing on initial assessments.
WCAs cleared WCAs WCAs cleared
cleared The majority of IB reassessments and ESA repeat assessments have Support Group
outcomes at 64% and 71% respectively in contrast to 41% for ESA initial
41% assessments.
64% 71% Initial ESA assessments have the highest FFW rate at 38%. This is expected as,
unlike IB reassessments and repeat ESA assessments, these claimants don’t have a
previously known functionally limiting condition.
6ESA-WCA Mandatory Reconsideration registrations, clearances and clearance times
If a customer disagrees with their assessment decision they have the opportunity to raise a Mandatory Reconsideration and ask DWP to formally review the
decision. The aim of a MR is to resolve disputes as early as possible without the need for an appeal hearing. MR figures require less retrospection than the cohort
data and are therefore reported monthly to allow the most recent figures to be included.
See methodology note for a more detailed explanation.
Mandatory Reconsideration registrations have fallen since March
2017
Thousands
25
Registration
Main Findings
Clearance
20 The MR process was introduced in October 2013. From its introduction up to
March 2017, numbers of registrations generally increased over time. Since a
15 peak of 22,000 in March 2017, registrations have fluctuated but gradually
fallen to 12,000 in April 2018.
10 When the MR process was first introduced, clearance numbers were low in
comparison to registrations. However, since May 2014, clearance volumes
have improved, as the MR process became established and clearance
5 volumes have been similar to registrations.
0
Oct-13 Apr-14 Oct-14 Apr-15 Oct-15 Apr-16 Oct-16 Apr-17 Oct-17 Apr-18
Mandatory Reconsideration median clearance times have
started to decline
Days
40 In April 2018, the median monthly clearance time was 9 calendar days.
Consistently less than 9 Small peak at 15
9 days at April
30
calendar days, February days in September
2018
Since January 2015, after the MR process was established, the median MR
2015 – July 2016 2016 clearance time has not exceeded 15 days.
20 Over the last year, the median monthly clearance time has shown a decline
from 14 days in January 2017 to 9 days in April 2018.
10
See methodology note for how median clearance times have been derived.
0 See accompanying tables for full data.
Oct Apr Oct Apr Oct Apr Oct Apr Oct Apr
2013 2014 2014 2015 2015 2016 2016 2017 2017 2018
Note: MR Registrations and Clearances are shown by month. MR median
clearance times are shown by month of decision.
7ESA-WCA Mandatory Reconsiderations outcomes
76% of assessment outcomes were not revised at Mandatory Reconsideration in the latest month, April 2018
Not Revised % Revised %
Main Findings
100%
During the MR process, the DWP Decision Maker will review the
evidence for the decision under dispute to either revise or not revise the
80% decision.
60%
When MRs were first introduced, much higher proportions of decisions
were revised than in later years. The proportion of revised decisions fell
gradually to May 2015, since then it has fluctuated below 17%. In the
40% latest month, April 2018, 23% of decisions were revised at the MR
stage.
20% Since May 2015 to January 2018, monthly proportions of MRs not
revised have varied between 84% and 90%. This trend did not continue
0%
in April 2018 where 76% of MRs were not revised; 9,400 decisions were
Oct-13 Apr-14 Oct-14 Apr-15 Oct-15 Apr-16 Oct-16 Apr-17 Oct-17 Apr-18 not revised compared with 2,900 decisions revised.
See accompanying tables for further detail.
Note: MR outcomes are shown by month of decision. Revised % includes allowed
and disallowed revisions. Percentages may not sum to 100 due to rounding.
Fit for Work disputes are the main cause of ESA-WCA Mandatory Reconsideration decisions in April 2018
0 10,000 0% 50% 100%
The vast majority of MRs raised during the ESA-WCA process in April 2018
were due to FFW decisions. These types of MRs are less likely to be
Customer disputes
22% 48% 48% revised than the other categories.
ESA group
In April 2018, 7,500 MR decisions (60%) were made on disputes about Fit
for Work assessment outcomes. Only 11% of FFW disputes resulted in a
Customer disputes revision in April.
60% 88% 11%
FFW decision
In April 2018, 18% of MR decisions were made on disputes where the
Customer failed to claimant had not followed the claim procedures correctly. These reasons
attend WCA, provide 68% 32% include failing to return the initial questionnaire, failing to provide medical
18%
medical evidence or evidence or not attending their assessment. 32% of these disputes were
return questionnaire revised in the latest month.
The breakdown of revised/not revised decisions per MR category for April
Other/Unknown
2018 is shown in the chart.
Decisions Not Revised
Made Revised
8Appeals clearances and outcomes
Following an MR decision, the claimant can dispute the decision further by appealing to Her Majesty’s Courts & Tribunal Service where an official appeal hearing will
take place to consider the decision evidence. At appeal, the decision under dispute will either be upheld or overturned.
The number of appeals heard on initial FFW decisions has fallen
Thousands Main Findings
35 All Appeals Heard Being found FFW at assessment is the primary reason for claimants disputing a
30 decision and also the main reason for appeal hearings. These figures focus on
Upheld
FFW appeals for initial assessments.
25 Overturned The total number of appeals heard on FFW decisions for initial assessments is
very low over the last 4 reporting years after a steep drop of 9,000 in the quarter to
20
June 2013.
15 The chart shows that in the latest quarter, to March 2017, the number of appeals
heard on FFW decisions for initial assessments has remained low, with a
10 decrease from 2,800 to 1,800. Please note that as these figures are grouped by
claim start date, numbers could increase as more appeals are completed for
5
claims started between January and March 2017.
0 The low numbers of appeals over recent quarters may be partly due to the
2009 2010 2011 2012 2013 2014 2015 2016 2017 introduction of the MR process, although there could be other factors which have
also contributed. The purpose of MRs is to give the customer an opportunity to
Note: Appeals outcomes are shown in quarters by claim start date. present evidence against a decision for review without the need for formal appeal
processes, therefore when the new system was introduced fewer appeals were
expected.
Approximately two in five initial FFW decisions were upheld at
appeal this quarter
This quarter, the proportion of decisions under dispute that were upheld at appeal
has increased slightly to 39%, after staying stable at 38% over the previous 3
quarters. The proportion of decisions under dispute that were upheld at appeal
must take into context that these resulted from 1,800 initial FFW decisions with a
claim start date in the quarter to March 2017.
See accompanying tables for further details.
9Health Conditions and ESA group allocation for initial assessments
‘Physical or mental health risk’ and ‘severe functional disability’ remain the
main reasons for SG allocation this quarter
Thousands Main Findings
30 Most claimants assigned to the SG, who started their initial ESA assessment in the
Physical or quarter to September 2017, were placed there due to health conditions linked to
20 Chemotherapy/ Mental
Radiotherapy Health Risk ‘physical or mental health risk’ or ‘severe functional disability’. These two leading
24% categories make up 82% of all SG allocations this quarter.
10 10%
There has been a significant decrease in allocations to the ‘physical or mental
0 26% health’ risk group for claims started from October 2015 onwards. Volumes in this
2009 2011 2013 2015 2017 group fell from 28,000 in the quarter to September 2015 to 17,000 in the quarter to
2009 2011 2013 2015 2017
December 2015. This could partly be due to updated guidance on the application
Thousands of risk introduced at the start of 2016 to restate the policy intent and place the
question of risk in the context of work-related activity. Volumes in this group have
30 Severe
Terminally ill
increased this quarter from 8,000 to 8,300.
functional
disability
20 ‘Chemotherapy/radiotherapy’ and ‘terminally ill’ numbers have fluctuated very
slightly but have remained relatively low, accounting for 10% and 3% of all SG
10 56%
assignment reasons respectively for claims started this quarter.
3%
0
2009 2011 2013 2015 2017 2009 2011 2013 2015 2017
‘Adapting to change’ and ‘Social interaction’ remain the main reasons for
WRAG allocation (with 15 points or more) this quarter The charts show the four main functional impairment categories in which claimants
Percent
have scored points when assigned to the WRAG, scoring 15 points or more at
100
Understanding initial assessment. Receiving 15 points or more is the main reason for assignment
80 and Focus to the WRAG at initial assessment however; claimants can also be assigned to the
Consciousness WRAG at reconsideration or after appeal.
60
40 11% 12% For claims resulting in a WRAG allocation (with 15 points or more) the most
20 common categories where claimants scored points this quarter were ‘adapting to
change’ and ‘social interaction’. 87% of claimants having an ‘adapting to change’
0
2009 2011 2013 2015 2017 2009 2011 2013 2015 2017
condition and 85% scored points in the ‘social interaction’ group. Note that
claimants can have multiple functional impairments therefore appear in more than
Percent one category.
100
80 Adapting to Social 12% of WRAG claimants (with 15 points or more) scored points for ‘Understanding
change Interaction and focus’ this quarter. Other reasons for being assigned to the WRAG (with 15
60 85%
87%
points or more) which aren’t shown (Upper Limb, Sensory, Continence, and Lower
40
Limb) are less common.
20
0 See accompanying tables and Stat-Xplore for statistics on all reasons and health
2009 2011 2013 2015 2017 2009 2011 2013 2015 2017 conditions assigned to the WRAG.
Note: All charts are shown in quarters by claim start date. 10ESA-WCA customer journey clearance times for initial claims (experimental)
The following process flow shows the main stages of a typical customer journey when completing a Work Capability Assessment for ESA:
This is a typical journey; a small proportion of claimants will go on to raise an MR or appeal.
Clearance times for individual stages of the ESA WCA process
Monthly median clearance time (weeks) for completed initial claims by month of completion
Start End Main Findings
Clearance Type Oct-17 Nov-17 Dec-17
Stage Stage For initial WCAs completed in December 2017, the median end-to-end clearance time
stood at 17 weeks, dropping by a median of 2 weeks since the previous quarter.
1 2 Claim Registration to WCA Referral 1 1 1
WCA Referral to Assessment Provider Within this, the median time spent with the Assessment Provider (WCA Referral to AP
2 3 (AP) Recommendation
13 13 12 recommendation) was 12 weeks in December 2017. This stage will usually involve an
assessment and includes the waiting time for the customer to complete and return the
3 4 AP recommendation to DWP decision - - - questionnaire. Multiple referrals are sometimes required before an assessment is
completed and a recommendation received as customers may not attend
End-to-end ESA claim
1 4 19 18 17 appointments or return questionnaires.
(Claimant registration to final decision)
Note: The end-to-end clearance times recorded refer to time taken from claim
1. Individual stage medians may not summed to end to end median. Medians at each registration to date of DWP decision. This decision will include MRs where there is a
stage are calculated independently. completed decision.
2. Mandatory Reconsideration clearance times will be included in the end-to-end
clearance time if they have been completed by the statistics extract date.
See accompanying tables for further breakdowns by region.
3. Weeks are for weekdays and rounded to the nearest week.
11ESA-WCA clearance times for initial assessments (experimental)
Clearance times have fluctuated since ESA was introduced in October 2008 and are now showing a decreasing trend.
Median clearance times (weeks) for completed initial claims up to December 2017
Weeks
40
End to End Process
35 Repeat assessment
processing reintroduced
in December 2015.
30 Assessment Provider (WCA
Referral to AP
25 Recommendation)
20
17 Weeks
15
12 Weeks
10 Repeat assessment referrals
Previous assessment supressed from January 2014, to
New assessment provider
5 provider re-trained focus on initial assessments.
took over delivery of
staff during 2013. WCAs in March 2015.
0
Oct Apr Oct Apr Oct Apr Oct Apr Oct Apr Oct Apr Oct Apr Oct Apr Oct Apr Oct
08 09 09 10 10 11 11 12 12 13 13 14 14 15 15 16 16 17 17
Note: Clearance times are shown by month of clearance. Median weeks are calculated in weekdays and rounded to the nearest week.
Main Findings
The chart shows end-to-end median clearance times from claim registration to final DWP award decision for initial claims from October 2008 to December 2017. Included
in the end-to-end process is the time taken from when the customer is referred to the health assessment provider to the provider’s recommendation. The median clearance
time for the assessment provider is also shown in the chart.
In December 2017, the median end-to-end clearance time was 17 weeks. The median clearance time for the assessment provider (referral to recommendation) took 12
weeks.
The median end-to-end clearance time has reduced by more than half in the latest month, December 2017, (17 weeks) since reaching a peak of 38 weeks in August 2014.
The chart shows the assessment provider clearance times median follow a similar pattern, reaching their peak in July 2014 at 32 weeks and then falling to stand at 12
weeks in December 2017.
See accompanying tables for further breakdowns by region.
12About these statistics
This product has been assessed by the UK Statistics Authority for National Statistics status and has been awarded National Statistics. National Statistics
designation is awarded to the subset of official statistics that are judged to be of good quality, value and trustworthiness. This badge does not currently apply
to the experimental cohort figures or ESA clearance times.
Key uses of the statistics include:
Providing the evidence base for assessing the potential effect of changes, monitoring and evaluation of DWP policy
Answering Parliamentary Questions and Freedom of Information requests and Forecasting benefit expenditure (in conjunction with expenditure statistics)
Policy development and evaluation by local authorities and other welfare to work and pensions stakeholders and providers.
Terminology:
Registration - Claimant registers an application for a WCA, MR or appeal.
Clearance - DWP decision maker has determined whether the claimant should or should not be entitled to claim ESA.
Mandatory reconsideration - Claimant wishes to dispute a decision made on their claim and requests DWP to reconsider the decision.
MR clearance time - The clearance time begins from the point the MR is raised on the DWP administrative system by the Benefit Centre as a valid MR, having
considered whether they can initially change the decision in the light of any new information. The total clearance time therefore includes the time taken to transfer the
case to the Dispute Resolution Team and the time taken for the decision maker to make a decision.
Repeat assessment - An existing claim that has been reassessed for ESA, as opposed to a new claim. A repeat assessment is the second or subsequent WCA
undertaken on an existing, continuous ESA claim, usually between 3 and 24 months after the previous assessment. These claimants will have already been assessed
as having a limited capability for work at their initial WCA and the repeat assessment will assess if their capability for work has changed.
Experimental cohort statistics:
MR statistics have been added to the regular cohort data to build on the story of the end to end customer journey. The cohort MR statistics are less timely than the
stand alone MR statistics due to time lags in the benefits data and assessment data they are linked to in the cohort process. Time lags are present to allow stages
within the process sufficient time to complete. These statistics give a feel for the volumes flowing through each stage of the ESA WCA process. For robust figures on
individual stages, please use the stand-alone figures within the published tables (not table 17).
ESA Clearance Times (experimental):
This release includes recently developed ESA clearance times. The statistics are labelled as experimental as there is scope to develop them further.
Clearance times for initial claims only are included in these statistics.
Clearance times are calculated as median weeks where a week is derived from the number of working days then rounded to the nearest week. The median is
presented here instead of the mean as the mean measure can be unduly affected by outlying cases.
These figures are derived for cases where a final award decision has been recorded.
MR decision dates are included in the final DWP decision date where available.
Where to find out more:
See Stat-Xplore for more detailed breakdowns of the data covering Region, Local Authority and Westminster Parliamentary Constituency breakdowns available for
WCA outcomes by claim start date and completed assessment date.
See methodology note for more detailed information on these statistics.
13You can also read