Phoenix Center for Advanced ...
←
→
Page content transcription
If your browser does not render page correctly, please read the page content below
P E R S P E C T I V E S
PHOENIX CENTER FOR ADVANCED LEGAL & ECONOMIC PUBLIC POLICY STUDIES
Form 477, Speed-Tests, and the American Broadband User’s
Experience
George S. Ford, PhD
March 31, 2021
Twice each year the Federal Communications Further, like the Form 477 data, the quality of
Commission (“FCC”) releases data on the speed-test data is subject to severe criticism.
availability of broadband Internet services across Speed-tests typically are not drawn from a
the United States, eponymously referred to as random sample of consumers and are dependent
“Form 477 data.” Looking at the fastest available on a variety of factors unrelated to the underlying
service tiers of Internet providers at the census connection speed including the quality of inside
block level—the smallest geographic area wiring, Wi-Fi equipment and connected devices,
defined by the Census Bureau—the FCC uses and other factors. As such, the test results are
these data to measure the share of persons with biased downward. Still, quality speed-test data
access to “broadband” service, which is now may offer some insight, albeit a cloudy one, on
defined to be a service with a minimum of consumer experience with broadband services.
25 Mbps download and 3 Mbps upload speeds.1
In its latest Broadband Deployment Report, the
Commission concluded that 95.6% of Americans … my analysis of the Ookla data
had access to “broadband” service as of indicates that Americans experience
December-2019.2 “broadband” speeds close to the
Analysts and advocates criticize the Form 477 share indicated by the FCC’s Form
data by pointing out that consumers are not 477 data.
always receiving the maximum reported service
speeds or even speeds meeting the 25/3 Mbps
standard, a discrepancy resulting, in part, from Respecting the limitations of the speed-test data,
the FCC’s assumption that if one customer has in this PERSPECTIVE I analyze a sample of over 100
access to broadband within a census block, then million speed-tests conducted in the U.S. in 2020.
all customers in that block do so.3 Data from the Through its Open Data Initiative, the data are
results of speed-tests are often used to support made available by Ookla (speedtest.net),
such claims.4 But data on speed-tests from online arguably the world’s preeminent speed-test firm.
services are measures of central tendency (means I also link the Ookla Speedtest data to the FCC’s
and medians) to a variety of unknown Form 477 data for comparison purposes. This
subscription levels (typically chosen by linkage allows me to explore how consumers
consumers), so there is no reason to expect that experience broadband speeds and how such
the Form 477’s maximum reported speeds should speeds compare to the maximum speeds
be equal to summary statistics from user-based recorded in the Form 477 data.
speed-tests.
PHOENIX CENTER PERSPECTIVES 21-03P E R S P E C T I V E S
Results are as follows. First, the population- Feamster and Livingood (2020) describe a host of
weighted average download and uploads speeds factors that may influence a speed-test results
experienced by U.S. consumers using the Ookla including, but not limited to: (1) the capabilities,
service in 2020 is about 130 Mbps and 39 Mbps, software and settings of the device tested; (2) the
respectively. Second, I find that the average modality of connectivity of the device such as
tested speeds satisfy the 25/3 Mbps standard for Wi-Fi or wire; (3) the number of devices sharing
census block groups where 95% of Americans a Wi-Fi connection; and (4) the adequacy of inside
live, a share comporting with the FCC’s reported wiring and capacities of wire and wireless
availability rate of 96.5% by year-end 2019. routers and switches.5 Additionally, the service
Third, I find that mean tested broadband speeds used to conduct the speed-test may affect the
are correlated with maximum available speeds at result. Several recent studies comparing Ookla’s
the block-group level and a 100 Mbps increase in to M-Lab’s speed-tests reveal significant
maximum download speed increases the average shortcomings in the M-Lab approach and,
tested download speeds only by about 12 Mbps. consequently, its collection of speed-test data.6
These factors, among others, will bias the test
Note, however, that like the Form 477 data, it is result downward since none of these factors can
not possible to see below the chosen level of increase the base connectivity level that is
geographic aggregation at individual customers’ governed at the modem.
experience. Subject to that caveat and
considering the inherent bias in speed-test There are also reasons outside the consumer’s
results, my analysis of the Ookla data indicates location that affect speed-test results, such as
that Americans experience “broadband” speeds network congestion in the provider’s network,
close to the share indicated by the FCC’s the capacity and congestion on the testing site’s
Form 477 data. network, or even transport networks.
Acknowledging these influences, during the
The Limits of Speed-test Data Obama-era the FCC initiated the use of
“whitebox” speed-testing that relies on a
In using speed-test data to characterize the
hardware solution to avoid many of the biases
average experience of broadband consumers,
that may arise from software-based tests.7 These
several important limitations of the test data
tests show that consumers typically receive their
must be acknowledged and understood. First,
subscribed speeds. Tested speeds vary
the speed-test results from online testing
considerably by the time of day they are run. A
platforms do not represent a random sample of
speed-test result, therefore, equals the connection
consumers, connections, or situations.
speed plus some non-positive bias.8
Consumers choose when to conduct a speed-test,
so the sample is a convenience sample. Speed- To illustrate the sort of data speed-testing
tests are often used, for instance, when an produces, I conducted several experiments using
account is being setup or when a customer is my home broadband connection. Note that for
experiencing technical problems. It also seems
none of these experiments was there an effort on
likely that more technically-savvy customers will
my part to maximize the speeds for the test
use speed-testing more frequently.
results and family members may have been
Second, customers differ in the speed levels of online at the time. A wireline ethernet
their broadband service and the subscription connection was used and tests were conducted
level is often not known in collections of speed- using the Google Chrome browser or the
test results. The subscribed level of services Speedtest application (for Windows).9 My
establishes (to an approximate degree) the
maximum speed obtained from a speed-test.
PHOENIX CENTER PERSPECTIVES 21-03 PAGE 2P E R S P E C T I V E S
broadband plan is nominally a 100/10 Mbps Figure 1 illustrates the Kernel Density Functions
service. for the download data. The lower test scores
provided by the M-Lab test are shown clearly in
First, I generated two samples of 50 speed-tests the figure, which most of the test results falling
each using the Ookla and M-Lab services. These below the Ookla mean. Darr (2020) reports much
tests were run sequentially between services on a larger variations in the Ookla and M-Lab results
Monday morning. Results are summarized in using larger samples than my simple
Table 1. experiment.10
Table 1. Average Download Speeds (Mbps)
Average St. Dev. Min Max
A speed-test result … equals the
Download
connection speed plus some non-
Ookla 93.3 3.66 79.4 96.2 positive bias.
M-Lab 89.6 6.61 73.5 94.2
Average 91.5 5.63 73.5 96.2
Upload
An interesting observation from the test results is
the indicated location of the tested site (my
Ookla 8.69 1.36 4.82 10.2
home). For the Ookla results, the geographic
M-Lab 8.29 1.28 4.37 9.67
coordinates are about 0.4 miles from the tested
Average 8.49 1.33 4.37 10.2
site. For the M-Lab results, the coordinates are
about 30 miles from my home. Consequently,
Both sets of test results are very close to the
merging the M-lab results with census data based
nominal level of service (100/10 Mbps),
on the geo-spatial data provided by M-Lab may
averaging across all tests a download speed of result is mis-matched geographies.
91.5 Mbps and an upload speed of 8.5 Mbps. As
might be expected, the average speeds are below In a separate experiment conducted at a different
the base-level speeds of the service plan. The time, I conducted thirty tests using Ookla’s
range of results between services are likewise service on wired and Wi-Fi connections. Here,
similar, with minimum download speeds in mid- the average download speed for the wired
70’s and maximums near 100 Mbps. M-Lab’s connection was 87.8 Mbps and for the Wi-Fi
results have a higher variance: Coefficient-of- connection was 65.9 Mbps. This is a large
difference (statistically different at the 1% level),
Variation (the standard deviation divided by the
and the Wi-Fi tests were much more variable; the
mean) for the Ookla data is 0.039 for downloads
Coefficient-of-Variation for the wired connection
but for M-Lab is 0.074.
was 0.06 but 0.25 for the Wi-Fi connection.
Figure 1. Download Speeds (Mbps)
Presumably, better speeds for the Wi-Fi
connected computer may have been obtained by
moving the computer closer to the Wi-Fi device,
but there is no reason to suspect consumers try to
maximize their speed results in everyday
practice. A severe downward bias in speed-test
results for Wi-Fi connected devices seems
plausible.
This analysis is not, obviously, an exhaustive
analysis of speed-test results or of different
testing services. My experiments simply
PHOENIX CENTER PERSPECTIVES 21-03 PAGE 3P E R S P E C T I V E S
demonstrate that speed-test results do not match population data (and then to the Form 477 data),
exactly the subscription level of service, that there the Ookla tiles are linked to census block-groups
is variation in user-based speed-tests and that for the 48 contiguous states and the District of
results will generally fall below the nominal Columbia.12 On average, a census block group
subscription speed. Results may differ by testing includes 14 tiles (minimum 1, maximum 453).
The final sample includes 195,030 census block
service, may differ materially between wired and
groups (91% of the U.S. population) with 105.6
Wi-Fi connections, and may differ for a host of
million speed-tests on 29.1 million devices.13
other reasons (not demonstrated here). Care,
then, must be taken when interpreting speed-test The Ookla data is richer for more populous block
results and when comparing them to what groups: tests ( = 0.67), and devices tested
broadband services are available. ( = 0.69). Tests and devices are highly correlated
( = 0.96). Average download speed is mildly
Data
and positively corrected with block-group
Quarterly data on speed-tests conducted across population ( = 0.16).
the globe are obtained from Ookla’s Open Data
Broadband availability is measured using the
Initiative for the four quarters of 2020.11 Ookla’s
Form 477 data for December-2019 (the latest
data are presented as averages for “geographic
available).14 The broadband availability data are
tiles,” which are rectangular areas of varying
native to the census block but is aggregated to the
sizes based on latitude-longitude but not linked
census block group using 2010 population data.
to census cartographic boundaries. For the Open
The Form 477 data are then merged with the
Data Initiative, the fixed speed-test data is
Ookla data for the 48 contiguous states and the
obtained from Android and iOS mobile devices
District of Columbia.
(permitting better location accuracy) using the
Speedtest application, so all tested devices Descriptive Statistics
connect via a Wi-Fi connection (which, if
anything, will bias the measured speed of affixed At the block-group level, the population-
connection downward). weighted mean download and upload speeds
from the Ookla tests are 130.3 Mbps and
For each tile, the Ookla data include the averages 38.7 Mbps, respectively.15 With such large
of download speed, upload speed, and latency, samples, the confidence intervals are tight
as well as the number of tests and devices used to (standard errors are 0.112 and 0.081,
construct these averages. (Medians are not respectively), but note that the distributions are
provided.) These tiles are geographically small not normally distributed (see Figure 2). Median
and, as a result, often have samples of very few download speeds are 137.5 Mbps and 21.1 Mbps.
test results. One-quarter of the observations are
based on a single test and about one-third on two Table 2. Average Speeds (Mbps)
or fewer tests. Also, many tiles have very few
devices tested, with one-third having only one Average St. Dev. Median
device and 45% having two or fewer devices. Down 130.3 49.5 137.5
Up 38.7 35.7 21.1
Ookla’s tiles are not based on census cartographic
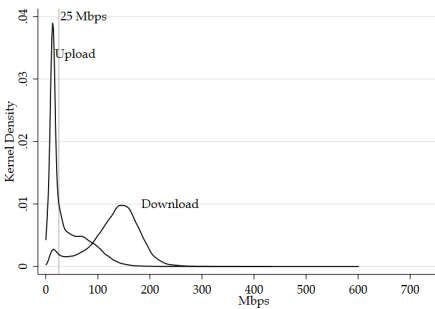
boundaries and thus the required population The population-weighted Kernel Density
data are not available to measure the experiences Functions for download and upload are
of Americans (i.e., a population-weighted mean). illustrated in Figure 2. The upload speed
To address both the small samples of tests in distribution is high peaked and is skewed right.
many tiles and to link the test results to Despite this high peak, the Coefficient-of-
PHOENIX CENTER PERSPECTIVES 21-03 PAGE 4P E R S P E C T I V E S
Variation is larger for upload than download broadband definition in this sample is 96.4% as of
speeds. December-2019 (96.5% nationally). We can then
use speed-test data to determine whether the
Figure 2. Speed (Mbps) Density Functions FCC’s estimate of broadband deployment is
wildly over-estimated as some claim or whether
the fraction of the population experiencing at least
broadband speeds aligns with the fraction said to
have access to broadband speeds.
Based on the Ookla data, the share
of American consumers living in
census block groups where the
average speeds equal or exceed the
FCC’s definition of broadband
Download speeds have, unsurprisingly, a larger (25/3 Mbps) is 95.0%.
mean, though the distribution is bimodal with a
peak at about 150 Mbps and a second peak at
about 15 Mbps. The mean download speed In describing the results, it is important to keep
rarely exceeds 200 Mbps. Certainly, many in mind that the Ookla data provide average
consumers have download speeds higher than speeds—often for multiple tests, devices, and
200 Mbps, but these data represent average consumers—within a geographic area. My
speeds for multiple tests and devices and not the description of the results, therefore, is worded
results for individual consumers. Upload speeds carefully:
are likewise highly peaked around 15 Mbps.
Based on the Ookla data, the share of
Meeting the “Broadband” Threshold American consumers living in census block
groups where the average speeds equal or
For each census block group, I construct an exceed the FCC’s definition of broadband
indicator variable for census block groups that (25/3 Mbps) is 95.0%.
meet the FCC’s definition of broadband of
25/3 Mbps. Dichotomizing a continuous This share of population is very close to the
variable suffers from a threshold problem. That estimates from the Form 477 data. Like the
is, a hard threshold at 25/3 Mbps would declare Form 477 data, however, it is not possible to peek
an average speed of 24.9/2.9 Mbps non- inside a pre-formulated geographic area at
compliant with the standard. Considering that individual consumers. Interpreting these results
speed-tests typically embed a downward bias are as representing the experience of each and every
subject to some variability, some care should be consumer is an ecological fallacy. Like the
taken in constructing such an index. Thus, three Form 477 data, this 95% share is an overstatement
indicators are created at different thresholds: (1) of actual experience.
25/3 Mbps; (2) 23/2 Mbps; and (3) 20/2 Mbps.
The different thresholds do alter the results; the
Admittedly, the two additional thresholds are
share of persons living in census block groups
arbitrarily chosen.
where the average speeds satisfy 20/2 Mbps
As a reference, the percent of population with threshold is 96.2% and 95.5% at the 23/3 Mbps
access to a network meeting the FCC’s threshold. There is a small yet noticeable
PHOENIX CENTER PERSPECTIVES 21-03 PAGE 5P E R S P E C T I V E S
difference between the shares. The similarity in average tested download speed by 12 Mbps. The
the outcomes suggests that that average speeds at R2 of the regression, however, is 0.37, which is
the block group level do not cluster at the reasonably large for cross-sectional data. Still,
25/3 Mbps threshold. the maximum speed is not a super accurate
predictor of average speeds, at least as measured
From this analysis, the FCC’s finding that by Ookla’s speed-test.
25/3 Mbps broadband is available for 96.5% of
the persons in the U.S. comports with the
observed experience of consumers in 2020, where From this analysis, the FCC’s
this “experience” is measured using results from finding that 25/3 Mbps broadband is
a large sample of Ookla’s speed-tests.
available for 96.5% of the persons in
Speeds and Maximum Available Speeds the U.S. comports with the observed
experience of consumers in 2020,
Maximum available broadband speeds reported
in the FCC’s Form 477 data need not coincide where this “experience” is measured
with consumer experience. In fact, it would be using results from a large sample of
surprising if in most cases speed-test averages Ookla’s speed-tests.
were anywhere near the maximum deployed
speeds.16 Most consumers do not purchase the
fastest plans as many consumers do not see Conclusion
enough benefit from higher speeds given the
associated higher costs of the service.17 The In this PERSPECTIVE, data on speed-tests results
relationship between actual and maximum from Ookla’s Open Data Initiative are used to
speeds may be evaluated by assessing the assess the broadband experience of consumers in
relationship between average tested download the United States in 2020. After discussing the
speeds and the maximum speeds available. limitations of using speed-test data for assessing
the typical experience, some statistics are
The correlation coefficient between the average computed from the data and reported.
tested download speed and maximum download
speed at the block group level is 0.62, so the two On average, the tested speeds of broadband
measures of speed are positively correlated.18 service are about 130 Mbps for downloads and
39 Mbps for uploads. About 95% of persons live
Alternately, consider the least-squares in census block groups with average speeds
regression, satisfying the FCC’s broadband definition of
25/3 Mbps, matching closely the 95.6%
S g 0 1 M g e g (1) availability rate of the same population from the
Form 477 data. Also, average tested broadband
where Sg is the average speed in block group g, speeds are correlated at the block-group level
Mg is the maximum advertised speed in g, and eg with maximum advertised available speeds. A
is the econometric disturbance term.19 The 100 Mbps increase in maximum speeds increases
estimate of 0 is 29.07 and 1 is 0.117. This result average speeds by about 12 Mbps.
suggests that, on average, every 100 Mbps
increase in maximum speed increases the
PHOENIX CENTER PERSPECTIVES 21-03 PAGE 6P E R S P E C T I V E S NOTES: Dr. George S. Ford is the Chief Economist of the Phoenix Center for Advanced Legal and Economic Public Policy Studies. The views expressed in this PERSPECTIVE do not represent the views of the Phoenix Center or its staff. Dr. Ford may be contacted at ford@phoenix-center.org. 1 The debate over whether 25/3 Mbps is the correct definition is beyond the scope of this paper. See generally, G.S. Ford, Is Faster Better? Quantifying the Relationship Between Broadband Speed and Economic Growth, 42 TELECOMMUNICATIONS POLICY 766- 777 (2018) (available at: https://www.sciencedirect.com/science/article/abs/pii/S0308596118300831). 2 In the Matter of Inquiry Concerning Deployment of Advanced Telecommunications Capability to All Americans in a Reasonable and Timely Fashion, FCC 21-18, FOURTEENTH BROADBAND DEPLOYMENT REPORT, __ FCC Rcd. __ (rel. January 19, 2021) at p. 20 (available at: https://docs.fcc.gov/public/attachments/FCC-21-18A1.pdf). 3 See, e.g., G.S. Ford, Quantifying the Overstatement in Broadband Availability from the Form 477 Data: An Econometric Approach, PHOENIX CENTER POLICY PERSPECTIVE No. 19-03 (July 11, 2019) (available at: https://www.phoenix- center.org/perspectives/Perspective19-03Final.pdf). 4 See, e.g., B. Miller, Microsoft Speeds Show Broadband Use is Far Lower than Access, GOVERNMENT TECHNOLOGY (March 4, 2019) (available at: https://www.govtech.com/biz/Microsoft-Speeds-Show-Broadband-Use-Is-Far-Lower-than-Access.html); Truth in Broadband: Access and Connectivity in New York City, NYC Connected (April 2018) (available at: https://tech.cityofnewyork.us/wp-content/uploads/2018/04/NYC-Connected-Broadband-Report-2018.pdf); R. Gallardo and B. Whitacre, The Real Digital Divide? Advertised vs. Actual Internet Speeds, Purdue Center for Regional Development (October 7, 2020) (available at: https://pcrd.purdue.edu/the-real-digital-divide-advertised-vs-actual-internet-speeds); E. Hardison, Pennsylvania’s Rural Broadband Problem is Bigger than Anyone Thought, PENNSYLVANIA CAPITOL STAR (June 4, 2019) (available at: https://www.penncapital-star.com/blog/pas-rural-broadband-problem-is-bigger-than-anyone-thought); R. Johnston, Form 477 Data Undermines Conclusions in the 2020 Broadband Deployment Report, Next Century Cities (May 8, 2020) (available at: https://nextcenturycities.org/form-477-data-undermines-conclusions-in-the-2020-broadband-deployment- report); K.Bode, How Bad Maps Are Ruining American Broadband, THE VERGE (September 24, 2018) (available at: https://www.theverge.com/2018/9/24/17882842/us-internet-broadband-map-isp-fcc-wireless-competition); 5 N. Feamster and J. Livingood, Measuring Internet Speed: Current Challenges and Future Recommendations, White Paper (2020) (available at: https://arxiv.org/abs/1905.02334); see also Will Different Ethernet Cable Speed Affect My Network?, FIBER OPTIC COMPONENTS BLOG (December 14, 2018) (available at: http://www.fiber-optic-components.com/will-different-ethernet-cable- speed-affect-network.html). 6 B. Darr, Make Better Funding Decisions with Accurate Broadband Network Data: A Guide for Federal, State and Local Governments, Speedtest.net (November 10, 2020) (available at: https://www.speedtest.net/insights/blog/better-funding-decisions- accurate-broadband-network-data); R. Bennett, OTI United States of Broadband Map is Fake News, HighTechForum (July 25, 2019) (available at: https://hightechforum.org/oti-united-states-of-broadband-map-is-fake-news); S. Wallsten, OTI’s Broadband Map Could Be Useful If They Understood Their Data, Technology Policy Institute (July 23, 2019) (available at: https://techpolicyinstitute.org/2019/07/23/otis-broadband-map-could-be-useful-if-they-understood-their-data). 7 See, e.g., Measuring Fixed Broadband - Tenth Report, Federal Communications Commission (January 4, 2021) (available at: https://www.fcc.gov/reports-research/reports/measuring-broadband-america/measuring-fixed-broadband-tenth-report). 8 The FCC’s report on broadband speeds (id., at p. 14) shows median speeds above subscription levels for some broadband providers, but a review of the underlying data suggests the speed levels are set above the nominal subscription level. 9 Test results may be impacted by the browser or application used, another source of bias. 10 Darr, supra n. 6. 11 Data available at: https://registry.opendata.aws/speedtest-global-performance. 12 The linkage is made in Stata 16 using the geoinpoly command by Robert Picard. 13 There are 217,740 block groups across the U.S. and its territories. The population of the included groups is 283 million, or about 92% of the U.S. population in 2010. 14 Data available at: https://www.fcc.gov/general/broadband-deployment-data-fcc-form-477. PHOENIX CENTER PERSPECTIVES 21-03 PAGE 7
P E R S P E C T I V E S

NOTES CONTINUED:
15   Ignoring population, the test-weighted mean speeds are 138.3 Mbps and 44.4 Mbps.
16   While the reasons for test results to fall below the maximum available speed are apparent, some commentators find this
concept difficult to grasp and claim there is something is amiss when speed-tests fall below the maximum speeds ISPs report
to the FCC on Form 477.                       See, e.g., The United States of Broadband Map (available at:
https://datastudio.google.com/u/0/reporting/1djtGEuqV4Qwrj26GQTN_xzp3rsMYYcmv/page/YW8NB?s=rzD5rHYkLT
4) and the discussion of that map by Bennett, supra n. 6, and Wallsten, supra n. 6.
17   Y.H. Liu, J. Prince and S. Wallsten, Distinguishing Bandwidth and Latency in Households’ Willingness-to-Pay for Broadband
Internet Speed, 45 INFORMATION ECONOMICS AND POLICY 1-15 (available at: https://doi.org/10.1016/j.infoecopol.2018.07.001);
Ford, Is Faster Better? Quantifying the Relationship Between Broadband Speed and Economic Growth, supra n. 1.
18   The relationship appears to hold at higher levels of aggregation.
19   The regression is weighted by population.

PHOENIX CENTER PERSPECTIVES 21-03                                                                                     PAGE 8
You can also read