SCIENTIFIC VISUALIZATION IN WEB-APPLICATIONS - ECCM ECFD 2018
←
→
Page content transcription
If your browser does not render page correctly, please read the page content below
6th European Conference on Computational Mechanics (ECCM 6)
                                       7th European Conference on Computational Fluid Dynamics (ECFD 7)
                                                                            1115 June 2018, Glasgow, UK

    SCIENTIFIC VISUALIZATION IN WEB-APPLICATIONS

        DMITRY V. PUZYRKOV1 , TATYANA A. KUDRYASHOVA1 ,
         VIKTORIIA O. PODRYGA1 , SERGEY V. POLYAKOV1,2 ,
                       NIKITA I. TARASOV1
                     1Keldysh Institute of Applied Mathematics of RAS
                          Miusskaya sq., 4, Moscow, 125047, Russia
                     puzyrkov@imamod.ru, web-page: http://keldysh.ru
                       2 National Research Nuclear University MEPhI
                       Kashirskoe shosse, 31, 115409, Moscow, Russia
                              web-page: http://www.mephi.ru

Key words: Visualuzation, Web-Application, VTK, Bokeh

Abstract.
   In view of the rapid development of Internet technologies, it becomes possible to create
applications for data processing that work online. Important parts of such applications
are postprocessing and visualization of scientific data. In recent years, the performance
of graphics processors has increased abruptly both on personal computers and on mo-
bile platforms. This fact makes possible to create cross-platform scientific visualization
systems that do not require any third-party applications, except for the web-browser.
Within the framework of KIAM Multilogin service, which is a web-based environment for
scientific work, technologies such as VTK.js and Bokeh were tested. The choice of these
technologies is due to the fact that VTK is a definite standard of scientific visualization,
and Bokeh is a reliable and simple tool for integrating interactive web-based visualiza-
tion with various web-applications. In present paper the application of these libraries to
real tasks of visualization of CFD calculations within the framework of KIAM Multilogin
service is considered. Calculations, in this case, represent a flow simulation in the region
of complex geometry by solving a system of Navier-Stokes equations on grids of different
dimensions. The performance of the test and the real applications using Bokeh, VTK.js
was investigated, and also the methods of its improvement were proposed.

1   INTRODUCTION
   Scientific visualization is an important stage of postprocessing of data obtained by
numerical modeling of various physical processes or experimental observation. Represen-
tation of multidimensional data in the form of graphs, diagrams and three-dimensional
models allows the researcher to better and more fully understand the essence of the pro-
cess, and in some cases without this kind of analysis it is impossible to interpret the results
of calculations.
D. Puzyrkov et al
Approaches to visualization are basically reduced to a method of averaging and reduc-
ing the dimension of data, and further mapping such structures in the form of structures
understandable to human perception: points, lines, contours and three-dimensional sur-
faces.
In most cases, packages for scientific visualization are complex and large software so-
lutions, many of which are commercial. There are also free packages, mostly based on
technologies such as VTK [1] and MatPlotLib [2], as well as ready solutions based on their
own development, such as GnuPlot [3]. All these packages have in common the presence
of algorithms for postprocessing and the rendering system. Data visualization is usually
performed on the user’s computer, or with the help of a client installed on the user’s
computer and the server part that allows to process data in parallel mode, an example of
such a solution is Paraview [4].
The problem with this method is the inability to access the visualization service from
anywhere, or from someone else’s computer that does not have the appropriate software.
An obvious solution to this problem is the development of visualization systems with a
web-interface accessible from the Internet/Intranet. The web-industry is developing very
quickly, modern browsers have already got the possibility of three-dimensional and two-
dimensional graphics acceleration based on WebGL [5] technology, which automatically
leads to the idea of moving the rendering service from desktop applications to the web-
based applications. The advantages of such a service are obvious - it works on any device,
whether it’s a tablet computer or a smartphone, and besides - web-applications can be
used locally on the user’s computer, and accessible via the Internet/Intranet.
2 APPROACHES TO WEB-VISUALIZATION AND ITS PROBLEMS
In this paper, authors consider the capabilities of modern browsers, as well as some
software libraries that allow to visualize various data in web-applications. Since web-
applications are a set of source codes written in JavaScript and HTML (markup language),
this fact imposes corresponding limitations on the architecture and functionality of such
services.
The main components of the system under consideration are: a web-browser (client);
a web-application server that, using the HTTP protocol, delivers the markup; scripts and
data for the application; the database/repository that this data provides.
Hence, a number of important features of such applications follow. Firstly, the entire
client part should be written in JavaScript (JS) language, because of the absence of
alternatives at the moment. Modern web-browsers do not support another programming
language other than JS and the WebAssembly [6] technology, which at the moment is
young enough and changes quickly to use it in serious developments.
Secondly, network data transmission becomes a bottleneck, and it is necessary to care-
fully optimize the data for transmission to reduce the network load.
There are several approaches to visualization using web-technologies. The first ap-
proach is the simplest and similar to the usual sequential visualization on a desktop
computer. The scheme of this approach is shown in Fig. 1.
The web-application server generates an image using a package or library and transfers
2D. Puzyrkov et al
Figure 1: Scheme of a first type visualization web-application: the web-server generates and transits an
image only.
its bitmap as data to the client in various formats. This method is the most sparing
and non-demanding to the performance of the client device, but has many disadvantages.
Firstly, this is a big delay for image re-drawing: the server needs to receive a command,
generate an image and send it over the network, which requires a lot of time. Secondly, it
is quite a challenge to implement a user interactivity, that in a compartment with network
transmission time can greatly reduce the quality of using such a service.
The second approach is the transfer of data for visualization to the client from the
server via the HTTP protocol, and its further visualization by means of the client device
itself. The scheme of this approach is shown in Fig. 2.
Figure 2: Scheme of a second type visualization web-application: client-side visualization.
This way of visualization is faster in terms of interactive work, but it is more demanding
for the speed of Internet connection and the performance of the client device. It is clear
that large data can not be visualized this way because the transmission over the network
can take longer than the processing itself. On the other hand, sometimes there is no need
to visualize such huge volumes of data, and in this case this method greatly benefits in
speed and convenience for the user.
The third approach is hybrid. Its essence lies in the preprocessing of data on the
server side, their reduction in size and masking depending on the scale (which in turn
complicates the implementation of the server part). The scheme of this approach is shown
in Fig. 3.
As a result, the client receives only the portion of the entire data set required for
visualization with a given resolution and scale, small enough to quickly transmit over the
network and visualize by means of the client device, but at the same time sufficiently
detailed to be considered satisfactory for analysis.
This approach will be discussed below.
3D. Puzyrkov et al
Figure 3: Scheme of a third type visualization web-application: server-side preprocessing and client-side
visualization.
3 WEB-VISUALIZATION TECHNOLOGIES
To solve the problem of visualization in web-applications, there are some open libraries.
All of them (for lack of alternatives) are written in JS, and for them a backend part should
be created manually. Many open libraries provide their implementation of the backend
of the data handler, as well as automatic generators of js-scripts.
Options for server visualization based on Matplotlib and Mayavi [7] have already been
implemented in the system [8], so it was required to add the ability of interactive graphics,
as far as the explored data set allows.
In our situation, it was important to integrate the technology into an already ready
infrastructure built on Python and Django. Such open libraries were Bokeh [9] and
VTK.js [10].
3.1 Bokeh
Web-visualization library Bokeh [9] is a set of methods and classes written in Python
programming language, as well as CSS style sets and JS scripts.
The following method of developing interactive applications is proposed: user scripts
written in Python using the API of this library are integrated into the web-application
and generate the JS code, as well as the structural HTML-markup element with which
this code works. All this is substituted into the real web-page by means of the used web-
framework. In the case of this library, there is no preprocessing capability on the server
side: all data is fully sent to the client.
The presented technique implements the second type of visualization web-application,
but it makes it easy to embed Bokeh graphics into the existing web-application infras-
tructure, and the power of the Python language is not limited either to the use of web-
frameworks or to processing data that requires visualization.
In addition, Bokeh provides the ability to generate queries to retrieve data, such as the
ajax asynchronous query technology, including periodic updates, acceleration of rendering
using WebGL technology, a custom server solution for back-end visualization, a set of
display controls with the possibility of using a custom JS script as a response. The library
also supports a wide range of structures for rendering, as elementary (circle, quadrilateral,
triangle, line), and complex (graph, line graph, bar and pie charts, contour plot).
Bokeh is currently a rapidly growing library that uses modern technologies to build
interactive graphics directly on the client computer. When used, the server sends the
4D. Puzyrkov et al
client all the data to display when the page is initially rendered, and all further user
interaction, such as zooming and moving, provided the data is unchanged, occurs without
the server being involved.
However, the direct application of the presented approach leads to the need to send a
full set of information that, when working with a large amount of data, leads to a slowing
of the rendering of the web-page as a whole, and delays in subsequent image rebuilding.
To solve this problem, you need to modify the overall structure of the application to a
third type. Several methods for this modification are discussed in detail in Section 5.
3.2 VTK.js
VTK.js [10] is an implementation of the popular VTK visualization library written in
C++, in the JavaScript environment. There is also the possibility of using the library in
embedded mode, when it integrates in the HTML, which is used by the authors of this
work. VTK.js provides the ability to render interactive 3D graphics directly in the client’s
web-browser and display calculated data on the submitted model. The ability to render
scenes consisting of several objects is realized, and full control of 3D rendering settings,
including light, color and transparency.
At the moment, VTK.js is at an early stage of development, but it already allows
you to visualize regular grids and volumetric data presented in standard formats. In the
course of further work, the developers promise to provide full support for the types and
methods available in the stock VTK library.
However, the capabilities of VTK.js already available at the moment are sufficient
for solving visualization problems. Because the backend library is used in the Python
programming language, for which there is a full-featured VTK implementation, which
allows to preprocess data on the server side and provide the client with this information
in the required format. It should be noted that such an approach lies perfectly within the
framework of the hybrid method of visualization.
4 PERFORMANCE
In this section, the use of the technologies listed above in the integration and devel-
opment of web-applications using the Django framework is consider . Web-based part of
The KIAM Multilogin system, intended for data access and calculation management is
written using this framework, so it was critically important that the specified technology
stack could interact with it. Within the work under discussion, the integration of the
described technologies into the Django framework was successful.
Next, the performance of the libraries under discussion in the required environment is
considered. The performance in this case means such parameters as the page loading time,
the speed of interaction with data (for an application using Bokeh) and the number of
frames per second (in the case of VTK.js). The server was launched locally on a computer
running OS Ubuntu 17.10 with the following characteristics:
• Intel Core i5-6600 CPU 3.30GHz
5D. Puzyrkov et al
• RAM - 16 GB
• NVidia GeForce GTX 960
The used web-browser is Google Chrome 65.0.3325.181.
4.1 Bokeh
The Fig.4 shows an example of embedding an interactive Bokeh image, with rendered
test data. The version of the library used is 0.12.14.
Figure 4: Interactive Bokeh image example applied to Django-backend.
As test data for Bokeh, it was decided to use a linear graph with a different number
of samples. This approach allows to understand how fast the specified library works with
the data and allows you to draw some conclusions for subsequent optimization.
The results of the measurements are presented in Table. 1. The page load times are
the arithmetic mean of 10 measurements. The values of the time of interaction with the
data are the arithmetic mean of 10,000 measurements for the number of points 100, 1,000
and 10,000; 1000 for 100,000 and 1,000,000.
As can be seen from Table.1, local load and page generation reach a second already
with the displaying file size of 3 MB, and at 30 MB this parameter takes the value of 11
seconds, and each act of interacting with data without the server takes 2.6 seconds. The
presented results allow to conclude that the approach of direct sending and rendering of
data becomes almost non-interactive with a small amount of data, which should be taken
into account. For applied scientific purposes, where the amount of information can reach
a billion points a qualitative preprocessor must be used.
6D. Puzyrkov et al
Table 1: Bokeh synthetic benchmark
File Point Page loading Frame
size, KB count time, ms re-draw time, ms
3,0 100 46,4 0,0985
29,6 1 000 51,4 0,8297
296,4 10 000 146,0 13,6684
2963,5 100 000 1131,4 198,782
29585,5 1 000 000 11286,7 2606,66
4.2 VTK.js
An example of embedding an interactive VTK.js image into a Django environment is
shown in Fig. 5. The version of the library used is 6.4.10.
Figure 5: Interactive VTK.js image example applied to Django-backend.
As test data, three-dimensional data, representing the fluid flow simulation obtained by
solving a system of Navier-Stokes equations on grids of various dimensions was used. In
this case, it was decided to refuse from synthetic testing in favor of real data in connection
with the specificity of 3D graphics. This feature is that the artificially constructed data
will be structured, which leads to optimization, both in interaction with the data and in
rendering, not used in rendering real complexity calculations. The generation of adequate
synthetic tests can be quite laborious.
The results of the measurements are shown in Table 2. Note that at the time of writing
the paper in VTK.js there are no methods of rendering 3D data on unstructured grids, so
for visualization it is necessary to bring the original data to poly-data format (in Table 2
7D. Puzyrkov et al
the information about the files containing the polygon data is indicated). The resolution
of the image is 800x600. To measure the FPS, the profiling tools built into VTK.js were
used. The page load time was averaged arithmetically for 10 measurements.
Table 2: VTK.js performance
File Vertex Polygon Loading FPS
size, MB count count* time, ms
0.07 1 099 7 920 214 60
5.3 40 376 365 330 1 849 35
9.7 70 445 656 480 3 120 22
55.5 378 020 3 616 140 15 710 7
97.6 649 439 6 291 520 26 622 4
* The number of polygons is a set of planes that form all elements of the prismatic grid.
As in the case of Bokeh, the interactive image processed by means of VTK.js ceases
to be interactive on the data sizes much smaller than the results of large-scale scientific
calculations demands.
5 Methods for visualizing large amounts of data
As shown in Section 4, both the one-dimensional and three-dimensional graphics li-
braries are not suitable for direct visualization of large amounts of data. However, as
real alternatives and visualization capabilities through Web-based applications to render
required amount of information are absent, including due to objective reasons such as
network constraints and performance of the client computer, the visualized data must be
preprocessed. This preprocessing can be divided qualitatively into two types, which will
be further considered and applied practically:
• generation of a raster image on the server side;
• decimation of data on the server side.
5.1 Generating a raster image
The idea of generating a raster image on the server side would seem to fully correspond
to the first approach described in Section 2. However, this technique has found wide
application for interactive visualization. Let’s describe the principle of the method to
solve the presented discrepancy:
1. the data requested for visualization is read by the server;
2. the server generates a high-resolution raster image based on the information read;
3. the resulting image is transferred to the client, where the receiver is the JS handler;
8D. Puzyrkov et al
4. all further interaction, such as an approximation/deletion and moving, is performed
on the client computer.
As can be seen from the description of the method, a certain amount of interactivity
appears, which is sufficient in most cases for practical use. In this case, the entire set of
data required for visualization is reduced to a single bitmap, the size of which depends
only on the resolution, but not on the source information. In addition, the interaction of
a JavaScript handler with a single bitmap image is much less computationally expensive
than with a full data set.
The disadvantages of this technique include the need to access the server and generate
a new image when changing the scale (for example, introducing a logarithmic step),
rotations in the three-dimensional case, and other changes associated with the design of
the schedule. Of course, when drawing three-dimensional objects, these shortcomings
negate interactivity, but this method has proved itself in application to one-dimensional,
contour and scatter graphs.
5.1.1 PRACTICE USE
The technologies discussed above were considered from the point of view of expanding
the rendering functionality of Multilogin service and were tested on real problems. As
one of them, a parallel calculation of the stationary state of the flow of an incompressible
fluid obtained using the Navier-Stokes equations in a three-dimensional formulation on a
prismatic grid was taken.
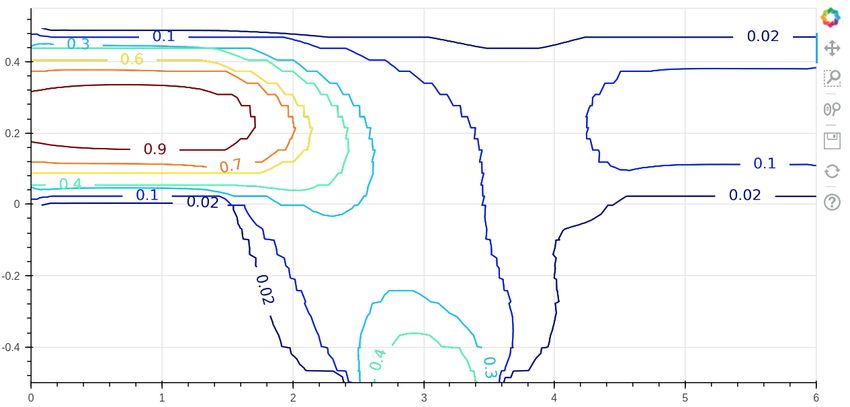
The size of the input file in VTU format is 40 MB. The size of one slice of this grid
is 2 Mb in VTP format. Using the method described in Section 4.2 (namely, slicing and
extracting outlines on the server, and drawing the outlines on the client), the size of
the web-page data (and this is html, js and contour data) was compressed to 600 Kb.
Visualization of such a slice is shown in Fig. 6.
Figure 6: Navier-Stokes solution visualization using server-side cutting, Matplotlib contours and Bokeh
visualization.
9D. Puzyrkov et al
5.2 Server-side data thinning
This technique is a set of different methods converging to a single ultimate goal that is
a reducing the dimension of the original data. For example, the following mathematical
operations on the source data can be used:
• the application of averaging techniques to combine the source elements;
• constructing an interpolation function to generate a smaller, but reflecting data set;
• use B-splines to represent information.
The presented list does not exhaust all the many ways of thinning out the data. So,
since for one-dimensional and two-dimensional data and optimizing the work of the Bokeh
library it was decided to use raster image generation, to optimize work with large three-
dimensional data it is possible to send the user only those polygons that are principally
visible. This technique is implemented within the context of the presented paper.
5.2.1 Application
Since the interactivity of the complete set of three-dimensional grid data during the
visualization is often necessary for some survey, qualitative research, it is possible to
consider as fundamentally observable the polygons that form the bounding surface and
the calculated data on it. Then for significant optimization when the server receives
a complete set of information about the solution, it is enough to generate partial data
containing information exclusively about the elements that form the boundary of the
calculation area.
To implement the described method by means of VTK.js and Django server it is enough
to use the method of grid data filtration implemented in the VTK library for Python and
in conjunction with the complete solution file to store partial information on the server.
The application of this approach to the grids discussed in Section 4 allows to form the
Table 3.
Table 3: VTK.js with server-side preprocessing performance
File Vertex Polygon Loading FPS
Size, MB count count time, ms
0.01 1 099 648 128 60
0.36 40 376 8 788 253 60
0.65 70 445 11 504 257 60
4.3 378 020 38 796 598 55
7.4 649 439 50 008 799 54
As can be seen from Table 3, the performance of the interactive image has reached user-
friendly values even when rendering the maximum detail grid. Comparison with Table 2
10D. Puzyrkov et al
gives excellent optimization values, so for a grid of maximum dimension the number of
rendered polygons has dropped more than 100 times.
Of course, the presented method of thinning out data strongly depends on the geometry
of the calculation area, however, when combined with other methods, it is possible to
achieve comfortable interactive work with an image based on high detail grids.
6 CONCLUSION
Within the framework of the presented research, the following results were achieved:
• web-visualization technologies were considered and presented;
• using the Bokeh and VTK.js libraries the interactive web-visualization under the
control of Django server was implemented;
• the performance of the named libraries was investigated, including the real calcula-
tion data;
• the actual techniques for visualizing large amounts of data were considered.
Summarizing the work done, it should be concluded that already developed technolo-
gies, as well as technology available for mass consumption, allow to draw the data directly
on the client device interactively. Of course, when visualizing the large amounts of data, it
is necessary to produce one or another preprocessing, but these algorithms do not burden
the user machine and the network connection. The load imposed by preprocessing on the
server can not become a significant barrier to the integration of interactive graphics into a
web-application. Also worth noting is the ease of embedding the interactive visualization
in an already-made environment, including the one built on the Django library.
7 ACKNOWLEDGMENTS
The work was supported by Russian Foundation for Basic Research, projects No. 15-
29-07090-ofi m, 16-07-00206-a, 17-01-00973-a. This work was partially supported by the
Academic Excellence Project of the NRNU MEPhI under contract with the Ministry of
Education and Science of the Russian Federation No. 02.A03.21.0005.
REFERENCES
[1] Schroeder, W., Martin, K., and Lorensen, B. The Visualization Toolkit. Kitware, 4th
Edition, 2006.
[2] Hunter, J.D. Matplotlib: A 2D graphics environment. Computing In Science and
Engineering (2007) 9: 90–95.
[3] Williams, T. and Kelley, C. (2011). Gnuplot 4.5: an interactive plotting program.
URL http://gnuplot.info
11D. Puzyrkov et al
[4] Ayachit, U. The ParaView Guide: A Parallel Visualization Application. Kitware,
2015.
[5] WebGL Overview - The Khronos Group Inc. URL https://www.khronos.org/webgl/
[6] WebAssembly. URL http://webassembly.org/
[7] Ramachandran, P. and Varoquaux, G. Mayavi: 3D Visualization of Scientific Data.
IEEE Computing in Science and Engineering (2011) 13(2): 40–51.
[8] Puzyrkov, D., Podryga, V., and Polyakov, S. Parallel processing and visualization
for results of molecular simulations problems. Proceedings ISP RAS (2016) 28(2):
221–242.
[9] Bokeh documentation. URL https://bokeh.pydata.org/en/latest/docs/user guide.html
[10] VTK.js documentation. URL https://kitware.github.io/vtk-js/docs/
[11] Polyakov, S., Vyrodov, A., Puzyrkov, D., Yakobovskiy, M. Cloud Service for Decision
of Multiscale Nanotechnology Problems on Supercomputer Systems. Proceedings ISP
RAS (2015) 27(6): 409-420. [in Russian]
12You can also read