Interactive Visual Big Data Analytics for Large Area Farm Biosecurity Monitoring: i-EKbase System
←
→
Page content transcription
If your browser does not render page correctly, please read the page content below
JMLR: Workshop and Conference Proceedings 41:9–18, 2015                               BIGMINE 2015

 Interactive Visual Big Data Analytics for Large Area Farm
          Biosecurity Monitoring: i-EKbase System

Ritaban Dutta                                                          Ritaban.Dutta@csiro.au
Heiko Mueller
Daniel Smith
CSIRO, Tasmania 7001
Aruneema Das
Jagannath Aryal
University of Tasmania, Tasmania 7005

Editors: Wei Fan, Albert Bifet, Qiang Yang and Philip Yu

                                                Abstract
    In this industrial application paper a novel application of salad leaf disease detection has
    been developed using a combination of big data analytics and on field multi-dimensional
    sensing. We propose a cloud computing based intelligent big data analysis and interac-
    tive visual analytics platform to predict farm hot spots with high probability of potential
    biosecurity threats and early monitoring system aiming to save the farm from significant
    economic damage.
    Keywords: Big Data Analytics, Big Data Management, Measurement, Biosecurity Risk
    Prevention, Interactive Visual Analytics, Hot Spot Prediction.

1. Introduction
The Australian agricultural market need is early warning of outbreaks of pests and disease.
Large area surveillance using machine learning analytics and big data to provide earlier
warning that is publicly available in Australia. Earlier warning allows earlier action, which
in turn enables quicker intervention and recovery. This will minimize negative impacts and
enables faster recovery. Big Data Visual Analytics for Biosecurity is all about developing
intelligent decision support frameworks to help deal with the threat of pests and diseases
on our farming and agriculture industries. Detection and early intervention of salad leaf
related disease is a challenging problem for the salad-growing farmers with severe economic
consequences. Sudden change in environmental condition, extreme weather condition, such
as hail storm, high wind, very low temperature with humid condition or severe solar radia-
tion can cause a series of scenarios, which can cause different diseases in salad leaves. The
ultimate challenge in agricultural decision support systems is to overcome the data unavail-
ability and uncertainty to improve the natural resource management efficiency and achieve
better business objectives. Uncertainty factors in the agricultural and environmental mon-
itoring processes are more evident than before due to current technological transparency
achieved by most recent advanced communication technologies. Poor data quality and un-
certainties make most agricultural decision support systems unreliable and [1] inefficient.
This inefficiency leads to failure of agricultural and environmental resource management.

c 2015 R. Dutta, H. Mueller, D. Smith, A. Das & J. Aryal.
Dutta Mueller Smith Das Aryal

    Figure 1. Big data integrated in the i-EKbase for daily hot-spot prediction and to de-
velop a visual analytics platform for further interactive validation performed by the farmers.

    In this study we focus upon developing methodologies to detect the presence of a partic-
ular disease or pest infestation damage of salad leaf through machine learning based analysis
of spectral profiles recorded by a Spectroradiometer in the in-situ field environment. The
motivation behind this study was to demonstrate a proof of concept of the effectiveness of
the hyperspectral sensing of salad leaf physiology to create ground truth data along with the
integrated heterogeneous climatic data (temperature, rainfall, humidity, wind speed etc.),
in accordance with the very high resolution remote sensing data integration for rapid plant
disease hot-spot prediction. In the next stage a web based interactive visual analytics sys-
tem has been developed to communicate analytical outcomes with the farmers for further
ground truthing, visual validation of the weekly large area observations, feedback through
the cross reference with other agricultural sources and localized farming experience gathered
over decades. Success from this study would be used to validate the current predictions of
disease or pest likelihood on the farm and improve the model through adaptive learning
accordingly.

2. Visual Analytics Platform:”i-EKbase” Service
The i-EKbase system is a data and knowledge integration framework for environmental
and agricultural decision support systems, primarily based on a big data analytics driven
architecture, autonomously working on CSIRO’s research CLOUD infrastructure. The sys-
tem could be accessed at the following web link [http://iekbaseanalytics.csiro.au/big-data-
analytics/hot-spots-monitoring], using ’public’ as user ID and password [2]. i-EKbase ser-
vice provides weekly/daily Large Area Farm Monitoring Maps (or monitoring products),
including Normalised Vegetation Index (NDVI), Soil Moisture, Relative Biomass, Relative
Dry Biomass, Water Consumption, Surface Temperature, Vegetation Landscape, Biosecu-
rity Hot-Spot monitoring map for scouting and True Colour images for a specific ’Area
of Interest’. Motivation behind this work is to apply CSIRO’s research BOWEN CLOUD
based Intelligent Environmental Knowledge Integration Framework (i-EKbase) on publicly

                                             10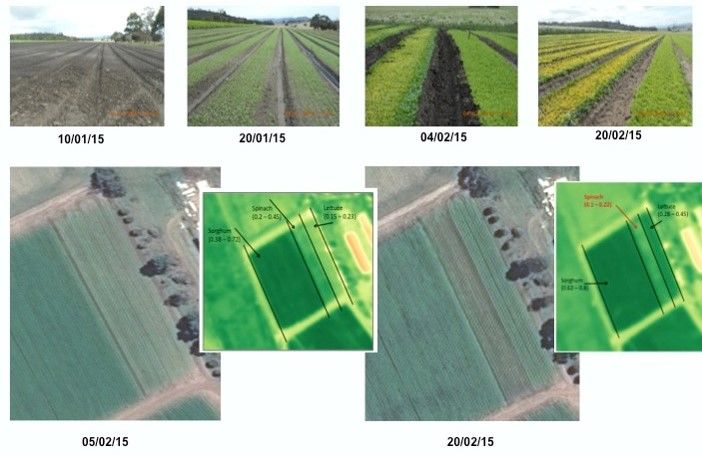
i-EKBase for Plant Biosecurity

available big data sets, to provide a near real-time weekly 15m resolution large area wise
farm monitoring and decision support system, - for better irrigation management and early
alerting of plant disease. Project would like to acknowledge the USGS EROS for providing
LANDSAT 7 and LANDSAT 8 and various MODIS satellite imagery products to develop
the farm’s healthy vegetation monitoring system [3-8].

    Figure 2. Snapshot of the i-EKbase visual interactive system based on big data integra-
tion over large farming areas.

    Initially heterogeneous data sources, namely, Bureau of Meteorology-Long Paddock
(SILO), Australian Water Availability Project (AWAP), Australian Soil Resource Informa-
tion System (ASRIS), Australian Cosmic Ray Soil Moisture Sensor Network (CosmOz), and
Australian Digital Elevation (DED) databases were integrated along with NASAs LAND-
SAT and MODIS products, to develop the legacy part to provide historical visual data
accounts of an area of interest and also the daily monitoring and visualization part of the
i-EKbase system. This system (Figure 1 and Figure 2) is to be used to complement the
real time sensor and sensor network data stream for better decision support and biosecurity
hot-spot predictions. Integration of approximately 20 GB of data is being processed every
day in this newly system to produce a farming hot-spot map for daily monitoring [1-3].

3. Demo of a Big Data Interactive Platform
In this section few steps of the big data interactive platform are presented which were de-
signed to formulate a visual analytics based common language to interact with the farmers.
Figure 3 shows the initial selection screen of a specific farm area located and projected on
the Google map. Boundaries of the farming area and associated paddocks were provided
as a single .KMZ input to the i-EKbase system, only input required to process a location
completely autonomously (Figure 3) In the Figure 4, an example of the optimum bound-
ary based visualisation of the exact farm area has been depicted, which becomes the main
area of interaction for the corresponding farmer on a visual analytics based interactive map
projected on the Google map. This on screen area could be zoomed in or out as on a
Google map browsing, where each pixel on the screen represents an area of 15m X 15m. A
farmer can click on any point on the screen, and a small display will appear to visualize 8
surrounding pixel of that point, which represent 45m X 45m area containing total 9 pixels

                                            11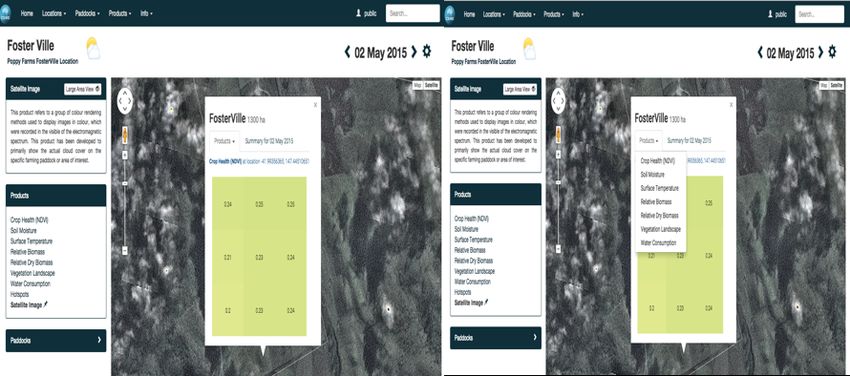
Dutta Mueller Smith Das Aryal

and corresponding product values (i.e. NDVI, Biomass, Soil moisture etc.) of those pixels.

   Figure 3. True colour imaging of the area of interest based on multi-band multi-source
data integration.

    Idea behind this interactive visualisation of results was motivated by the requirement
analysis derived from the face-to-face interviews with the farmers. By click of a button,
farmers can have access to all integrated data, knowledge and associated farming related
products for further usage and validation using in-situ on field experience from daily tra-
ditional scouting of the farm (Figure 5). This is developed to visualize and interact at a
sub-paddock level. In Figure 6, an alternative visual interaction at a medium size paddock
level and average values of that area have been used to provide an area wise average and
interpret. All these interactive map and solutions have been developed to formulate a com-
mon visual language to validate the results and predictive outcomes from the cloud based
big data analytics.

   Figure 4. KMZ based exact paddock area identification and optimum number of pixel
point visualization based on exact farming area.

                                            12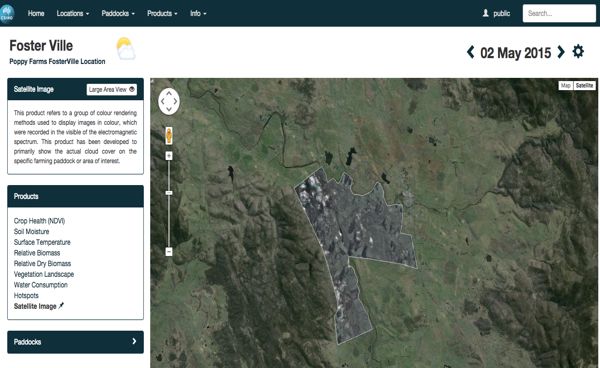
i-EKBase for Plant Biosecurity

   Figure 5. Interactive calculation and visual display of pixel based real monitoring prod-
ucts essential for farm monitoring and efficient irrigation management.

    Figure 6. Alternative visual display of paddock basis average of the monitoring products
instead of pixel based sub-paddock big data integration and analytics.

4. Field Calibration for Large Area Biosecurity
In this study at a large farm in Tasmania, we focus upon developing methodologies to detect
the presence of a particular disease or pest infestation damage of salad leaf through machine
learning based analysis of spectral profiles recorded by a Spectroradiometer in the in-situ
field environment. The motivation behind this study was to demonstrate a proof of concept
of the effectiveness of the hyperspectral sensing of salad leaf physiology to create ground
truth data (Figure 7) along with the climatic data (temperature, rainfall, humidity, etc.),
in accordance with the remote sensing data integration for rapid plant disease hot-spot pre-
diction. Success from this study would be used to validate the current predictions of disease
or pest likelihood on the farm and improve the model through adaptive learning accord-
ingly [4]. The participating farm provided a paddock of size 120m X 50m, with plantation

                                             13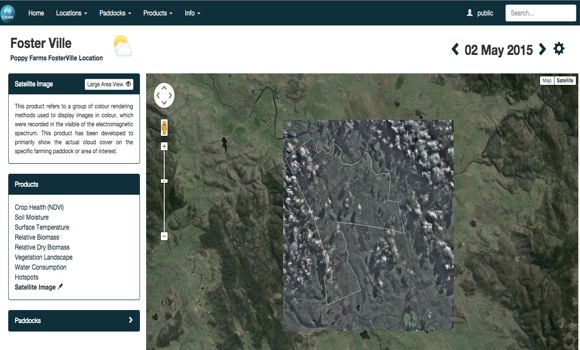
Dutta Mueller Smith Das Aryal

of 10 rows of lettuce and spinach each started on 5th January. 46 days long field trials
were conducted to collect ground truth about plant growth and plant vigor (using Spec-
troradiometer), soil moisture (using soil moisture probe), soil surface temperature (using
thermal IR camera), synchronised and cross referenced with daily weather data from BOM,
and 8-daily remote sensing data (15m resolution with pansharpning) from NASAs publicly
available satellites LANDSAT 7 and LANDSAT 8 to develop a large scale farm monitoring
and hot-spot monitoring system. Combined data set were used to analyze, develop and
calibrate the biosecurity hot-spot system.

   Figure 7. The ASD FieldSpec4 Spectroradiometer used in this study for ground truthing
and calibrating integrated big data from the large scale remote sensing.

5. Ground Truthing Field Experiment
During the experimental period, half of the total crop rows were sprayed with pesticides
and insecticides as other half was left without any sprying. This was a planned experiment
to see if any crop disease might appear. The Spinach side of the plantation did started to
appear as yellowish in colour after 3 weeks from the original plantation due to severe case
of Fusarium oxysporum, which was a unique scenario to capture in our data set. Capturing
of this disease related ground truth data was used in this study to develop simple machine
learning based models to estimate and predict large area biosecurity hot-spot monitoring
and alerting system (Figure 8).

                                            14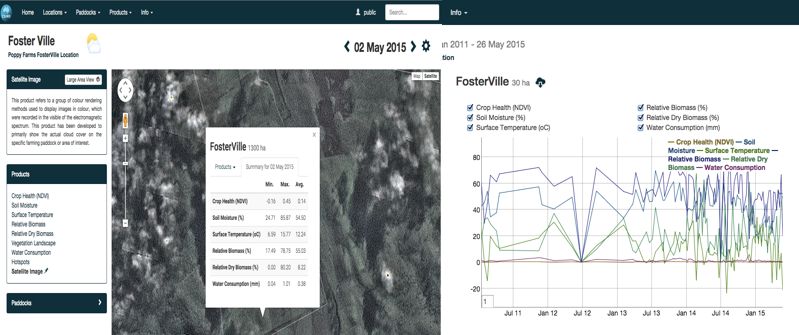
i-EKBase for Plant Biosecurity

    Figure 8. Disease effected large area crop monitoring to calibrate high-resolution remote
sensing data. In this figure, spinach beds were beds were almost dead by 20th Feb in com-
parison with the image from 5th Feb, where NDVI values were also dropped significantly.
This scenario could be captured in to the process of modelling and forecasting, where farm-
ers will be able to interact with this visual analytics system to validate and refine the model
outcome on a regular basis (weekly / daily).

   Figure 9. Biosecurity hot-spot prediction system projected on Google Earth based vi-
sual big data analytics.

                                              15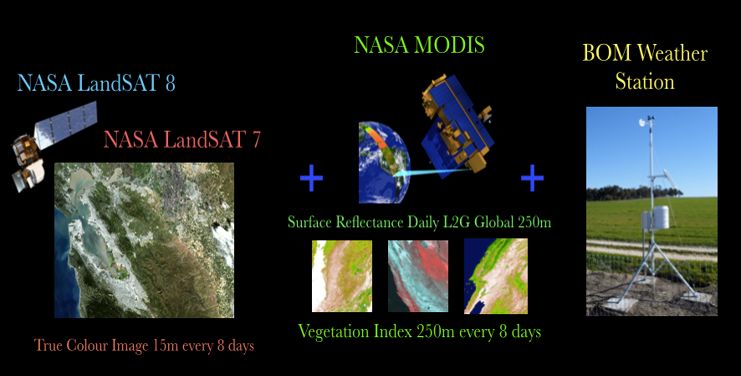
Dutta Mueller Smith Das Aryal

    These profiles were used as primary integrated observed knowledge about the farm to
create the probabilistic hot-spot map (Figure 9). Each pixel on the Google earth represents
15m-resolution analytical outcome from the big data integration. Soil moisture, soil surface
temperature, water consumption and NDVI values of each pixel were used to train a simple
data driven model to train a supervised knowledge predictor. The refined threshold of these
variables was modeled based on the ground truth collected and also by close consultation
with farm manager. This predictive system was trained based on farms historical records
and hyperspectral ground truth data as training targets.

6. Data Integration and Preprocessing
Main motivation behind this data experiment was to develop a predictive data driven model
to predict probable plant biosecurity hot-spot over a large farming area. Integration of vari-
ous data sets were done by matching and segmenting various gridded surfaces using latitude
longitude intents available in the .HDF, .NetCDF, and .GeoTIFF files. After geo-location
matching and synchronisation of the gridded data surfaces (representing same day on a
specific farm location), cubic interpolation was applied to upsize the lower spatial resolu-
tion data to match higher spatial resolution data matrix. All data points of a surface were
treated as independent feature for the training and testing paradigm. Surface data were re-
shaped into single colum matrix for the data experiment. Satellite data (from MODIS and
LANDSAT satellites) were corrected using atmospheric, cloud, and projected on Google
map using Universal Transverse Mercator coordinate system. On a typical day, an inte-
grated data file was holding around 35M data points, 20GB in size on the cloud, while data
prepossessing and predictive analytics were conducted using Python.

7. Evaluation and Predictive Data Experiment
An comparison study of various supervised machine learning methods (including Linear
Regression, Bayesian Ridge Regression, Logistic Regression, Linear Discriminant Analysis
(LDA), Adaptive neuro-Fuzzy Inference System (ANFIS), Multi-Layer Perceptron (MLP),
and Radial basis Function network (RBFN)), that exploits the class labels of the samples to
identify feature projections that potentially maximize class discrimination, was conducted
to showcase some parametric evaluation of the i-EKbase system (Figure 10). The identified
significant features were used to classify the disease affected salad leaves or area of the
farm with healthy plantation, the soil, and the healthy salad leaves or areas with potential
abnormalities which requires some attention and monitoring.

                                             16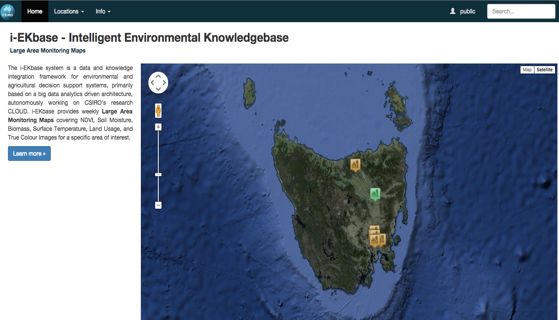
i-EKBase for Plant Biosecurity

   Figure 10. An comparison study of various supervised machine learning methods to
evaluate prediction accuracy of the i-EKbase system.

    A conventional 10-fold cross-validation was performed using the 50 percent randomized
holdout to have a better estimation of the classifier performance. Best result shows that
from this particular data set up to 88 percentage prediction accuracy is achievable with 85
percentage specificity and 89 percentage sensitivity. This was a combination of unsuper-
vised feature selection and supervised classification to test the generalisation capability of
the selected features.

8. Conclusion
Our understanding of the environment is greatly associated with the interlinked knowledge
of the phenomena surrounding to us. Such knowledge is a result of data and extracted
information. With the availability of very high and even ultra-high resolution sensor data
there is a greater need of managing data, information and essentially the knowledge. With
the advent of technological novelties and their wider applications the generated data is
surpassing our capacities to store it. There is an urgent need for improved methods and
advancement in data-intensive science to retrieve, filter, integrate, and share data. Data
and meaningful information are key for the actors in every walk of life, however, how to
conceive, perceive, recognize and interpret such data in space and time is a big question
and a big challenge. Taking this challenge into the perspective, we have presented an op-
portunity of recommending environmental big data using machine learning approaches. We
have a firm belief that our simple approach will contribute to the body of knowledge in big
data study and big knowledge management in this era of data intensive science.

                                             17
Dutta Mueller Smith Das Aryal
Acknowledgments
CSIRO Digital Productivity, Hobart is assisted by a grant from the Tasmanian Government,
which is administered by the Tasmanian Department of Economic Development, Tourism
and the Arts. This research was conducted as part of the CSIRO Digital Productivity
Research and Biosecurity Flagship. The authors would like to thank staff from the Houstons
farm, Tasmania, Australia, for their assistance with the field experiment.
References
[1] Dutta R, Smith D, Shu Y, Liu Q, Doust P, Heidrich S. Salad Leaf Disease Detection Using
Machine Learning Based Hyper Spectral Sensing. IEEE Sensors 2014, Valencia, Spain, pp.
511-515, 2014.
[2] Dutta R, Mueller H. I-EKbase Web System, http://iekbaseanalytics.csiro.au/big-data-
analytics/hot-spots-monitoring. USER ID = public, PASSWORD = public, 2015.
[3] ABS. Water Account Australia 2011-2012. Technical report. Australian Bureau of Statis-
tics, 2013.
[4] Wong D, Barbetti M. J., Sivasithamparam K. Effects of soil temperature and moisture on
the pathogenicity of fungi associated with root rot of subterranean clover. Australian Journal
of Agricultural Research, 35(5):675, 1984. ISSN 0004-9409. doi: 10.1071/AR9840675.
[5] Blancard D, Lot H, Maisonneuve B. A Color Atlas of Disease of Lettuce and Related
Salad Crops: Observation. Biology and Control, Academic Press, 2006.
[6] Hillnhuetter C, Mahlein A.-K. Early detection and localization of sugar beet diseases:
new approaches. Gesunde Pfianzen, 60(4), 143- 149, 2008.
[7] LANDSAT Data Science. http://landsat.gsfc.nasa.gov/?pagei d = 7195.AccessedJuly2015.
[8] MODIS Data Science. https://lpdaac.usgs.gov/products/modisp roductst able/mod09gq.
18You can also read