Mapping of Landuse/Landcover Changes of Chennai Coast and Issues related to Coastal Environment Using Remote Sensing and GIS
←
→
Page content transcription
If your browser does not render page correctly, please read the page content below
INTERNATIONAL JOURNAL OF GEOMATICS AND GEOSCIENCES
Volume 1, No 3, 2010
© Copyright 2010 All rights reserved Integrated Publishing services
Research article ISSN 0976 – 4380
Mapping of Landuse/Landcover Changes of Chennai Coast and Issues
related to Coastal Environment Using Remote Sensing and GIS
Santhiya.G, Lakshumanan.C, Muthukumar.S
Centre for Remote Sensing, Bharathidasan University, Tiruchirappalli, India.
drlaks@gmail.com
ABSTRACT
Coastal areas are very valuable in view of human beings and more dynamics for land use
due to urbanization and industrialization. It is essential to assess the land use/land cover
changes for coastal zone management, technologies like Remote sensing and GIS were
used to monitor the coastal land use dynamics for the Chennai coast covers stretch of
approximately 125kms from Pulicat Lake (North) to Kovalam creek (South). Survey of
India Toposheet, Land sat and IRSLISS III satellite data were used for the years 1976,
1999 and 2007. The maps were compared and changes were attributed; and show that the
drastic changes in land use profile. Vegetation cover decreased from 15.49% to 11.19%
during 19992007 & 19.49% to 15.77% (19761999) respectively. Due to the increased
population the settlement and built up areas increased considerably 16.82% (1976),
26.20% (1999) and 31.91% (2007). Field observation shows the current status and issues
of coastal environmental problems. Study suggested some remedial measures to protect
the coastal environment.
Keywords: Landuse/landcover, Chennai coast, Remote Sensing, Coastal Environment
1. Introduction
Coastal regions are the most important and thickly populated zone in the world. Coastal
resources have been under intensive pressure, changes are one of the important aspects of
global changes (Li Xiubin, 1995). In world population, 47.2% lives in urban settlements
and generate nearby coastal area under increased pollution from natural process such as
reclamation, dredging and waves, tides and the anthropogenic process like municipal
sewage, urban and industrial activities. Public pressure on coastal zones around the world
has increased dramatically in the last 50 years. Landuse change is the modification in the
purpose and usage of the land, which is not necessarily only the change in land cover but
also changes in intensity and management (Verburg, et al, 2000). Information about land
use change is necessary to update land cover maps and for effective management and
planning of the resources for sustainable development (Alphan 2003; Muttitanon and
Trpathy 2005). Early settlements were established on the coastal areas for both
commercial and naval purposes (Nurlu and Erdem 2002). Over the years, remote sensing
has been used for land use/land cover mapping in different parts of India (Gautam and
Narayanan, 1983; Sharma et al., 1984; Jain, 1992; Brahabhatt et al., 2000). Accurate and
uptodate land cover change information is necessary to understanding and assessing the
environmental consequences of such changes (Giri et.al, 2005).
563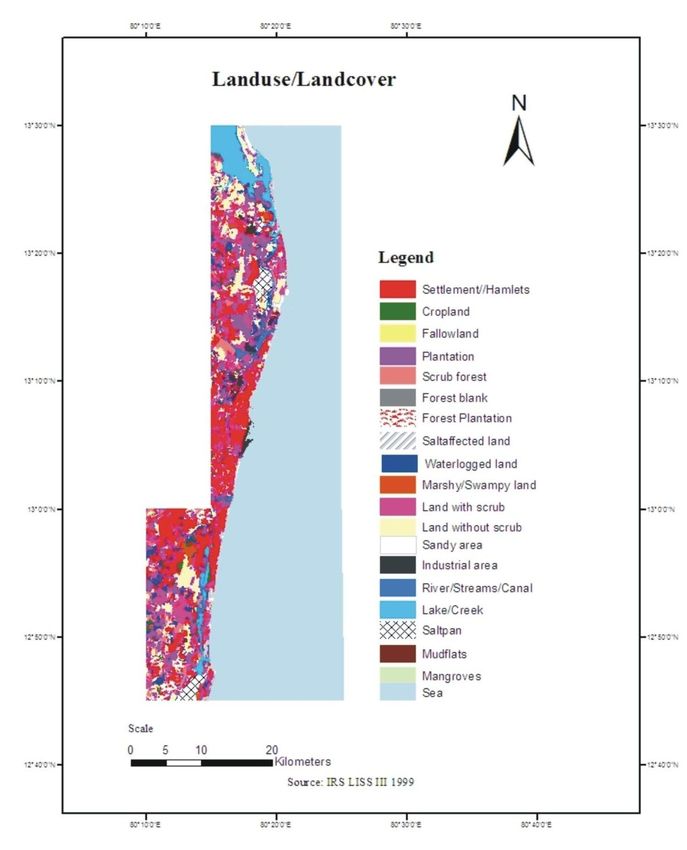
INTERNATIONAL JOURNAL OF GEOMATICS AND GEOSCIENCES
Volume 1, No 3, 2010
© Copyright 2010 All rights reserved Integrated Publishing services
Research article ISSN 0976 – 4380
The Chennai city is located in southern part of India and it is the fourth largest, fifth most
populated metropolitan city in India. Chennai coastal zone pollution is increased due to
the increasing population and industrial activities etc. It is subject to a multitude of
anthropogenic impacts attributable to accelerated population growth (7 million) and
development of smallscale and largescale industries, expansion of harbours and
tourism/recreation related activities in the coastal zone, disposal of municipal wastes,
untreated industrial wastes, numerous recreational and commercial activities that not only
destroy the quality of coastal water but also pose a serious health hazard to marine biotas
and human beings (Beiras et al., 2003; Capuzzo et al., 1985; Rama Devi et al., 1996;
Tran et al.,2002;Williams, 1996). Due to the anthropogenic activities there are rapid
changes in land use pattern and land cover. In this study the landuse/landcover changes of
Chennai coast and environmental conditions were assessed using temporal satellite data
using GIS techniques. Also the study suggests the possible remedial measures to protect
the coastal environment degradation and to create awareness about the environmental
issues and importance of coastal environment.
2. Study Area and Methodology
2.1 Study area
The Chennai city is located between 80 19’ 23” to 80 15’ 12” E and 13 25’ 27” N
to 13 O 47’ 21” N and it’s the tropical climate with temperature Min13.9and Max 45° C.
The area is divided into three parts: 1)The North Chennai coast comprises of Pulicat Lake,
it is the second largest brackish water lake in India and it’s including two very large
industries Ennore port and North thermal power stations. The north Chennai coast people
depend upon fishing, cropland and salt manufacture. 2) In Central Chennai coast receives
industrial effluent discharge from EID Parry fertilizers plant, MRF tyres, Ennore thermal
power station, Chennai petroleum corporation Manali, Tamilnadu Petro product and
SPIC petro products. On the other hand, they confluence in brackish water bodies,
mangroves situated at the fringes of Ennore creek and Buckingham canal. This
mangroves environment is attracting large number of wildlife creatures and hence,
tourists. Most of the area consists of alluvial tracts and the remaining in the eastern part,
is occupied by beach dunes, tidal flats and creek (Abhijeet Bernard Chaves and
Lakshumanan, 2008). Chennai Harbour is the busiest place handling more goods and it is
consider as eastern gateway of South India. Marina beach; it is the second largest beach
of the world. The area is bounded by Buckingham canal flows from northern to southern
direction, Coovam and Adyar river flows towards the east direction. The South Chennai
coast includes Kovalam creek, the backwaters of Muttukudu boat house and also it
consist of historical tourist spots, theme parks, hotel resorts, Aquaculture ponds, farm
houses, fishing and navigation activities are main activities in this region (Figure.1). The
geology of the Chennai area is classified into five regions, Pyroxene granulite, Marine,
Shale with limestone, Charnockites and alluvium. Major soil types are excessively
drained sandy soils, in North Chennai coast clayey soils are found nearby Pulicat Lake.
Calcareous clay soil is present in south part.
564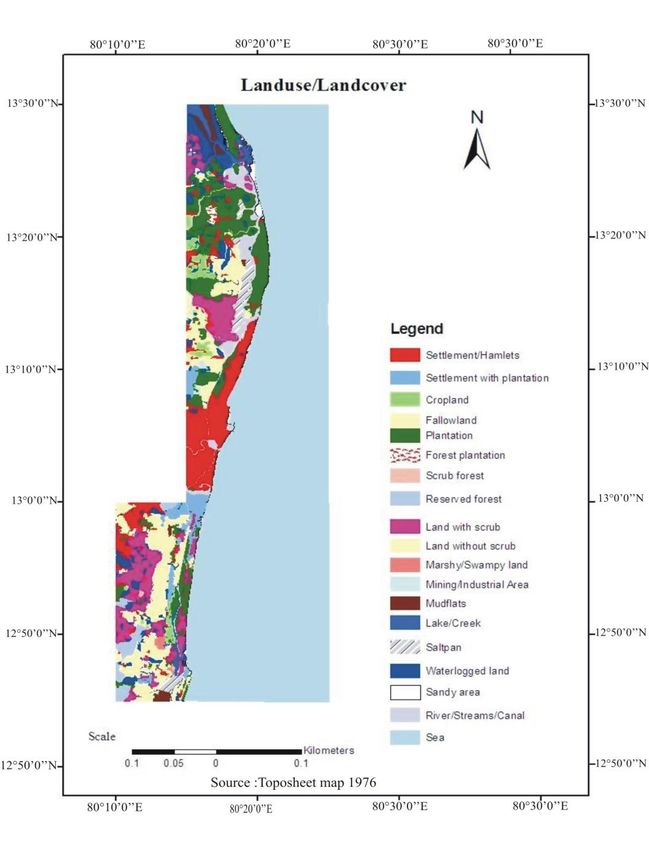
INTERNATIONAL JOURNAL OF GEOMATICS AND GEOSCIENCES
Volume 1, No 3, 2010
© Copyright 2010 All rights reserved Integrated Publishing services
Research article ISSN 0976 – 4380
Figure 1: Location of study area
2.2 Methodology
The Indian Remote Sensing Satellite data (LISS III) for the years 1999 and 2007 and
Survey of India topographical map 66D/1, 66C/8, 66C/7 (1976) on 1:50,000 scales were
used for the Landuse mapping coupled with intensive ground truth verifications. The
satellite data were geometrically corrected and georeferenced with Survey of India
(SOI) topographic maps using ground control point (UTM projection and WGS 84
datum). Visual interpretation is still one of the most widely used methods for detecting,
identifying and characterizing the spatial features on an image since human brain is a
good interpreter of images (Lillesand and Kiefer, 1994).The satellite data were
interpreted based on the visual interpretation keys and changes were identified for the
land use/land cover and finally verified with the field check using GPS for the doubtful
areas and change detection analysis was carried out using Arc GIS 9.2 software.
565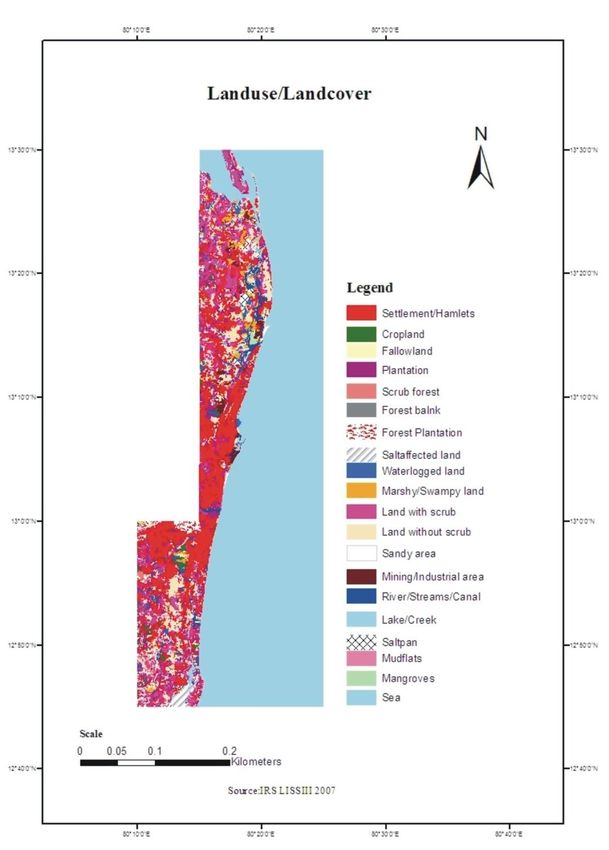
INTERNATIONAL JOURNAL OF GEOMATICS AND GEOSCIENCES
                               Volume 1, No 3, 2010
                    © Copyright 2010 All rights reserved Integrated Publishing services
Research article                                                                          ISSN 0976 – 4380

3. Results and discussion

3.1 Landuse/Landcover changes

The analysis shows that the major changes are present in the settlement areas due to the
rapid population and industrial growth in the coastal belt. It is observed that
settlement/Hamlet areas are increased from 16.72% (1976), 26.20% (1999) and 31.91%
(2007) with average changes (+41.29%). The central Chennai coastal area is densely
populated and more educational, recreational, business activities are situated in this
region. It has been observed that the industrial areas are gradually increased from 0.26%
(1976), 1.77% (1999) and 1.89% in 2007 to overall changes are observed around +3.40%.
The plantation areas have gradually decreased from 19.49% (1976), 15.77% (1999) and
11.19% (2007) due to the urban growth. It is observe that the forest plantation was
1.82% in 1976 and it became increased from the year 1999 (2.35%).and decreased the
year 2007 to 1.44% due to encroachment and construction activities and other hand
drastic reduction in areas of land without scrub (Figure. 2). Mangrove areas are decreased
from 0.38% (1976), 0.003% (1999) and 0.32% in 2007 all have been changed as
scrubland, mudflat and waterlogged area.

       Figure 2: Landuse/landcover map for the years 1976 of the Chennai coastal

                                                                                                      566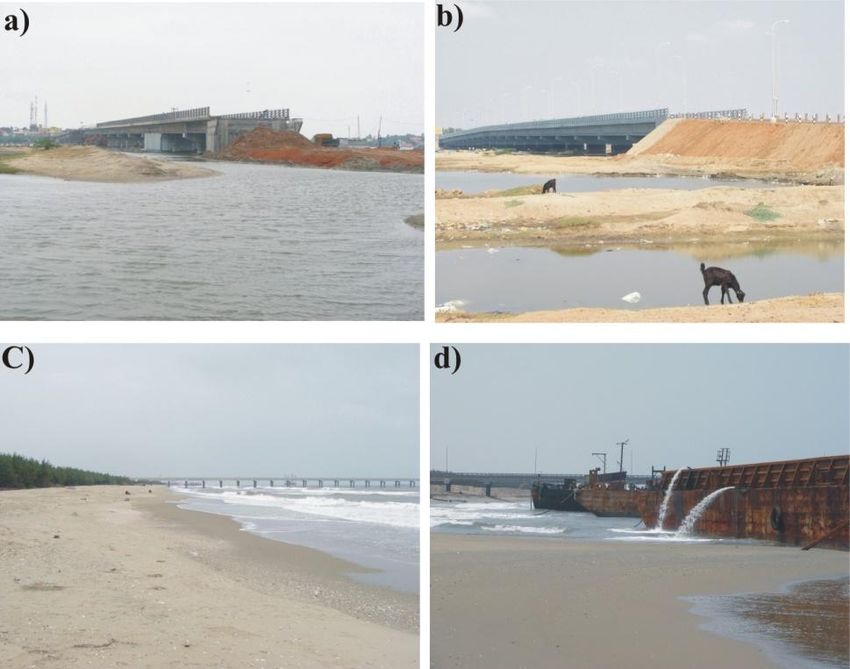
INTERNATIONAL JOURNAL OF GEOMATICS AND GEOSCIENCES
Volume 1, No 3, 2010
© Copyright 2010 All rights reserved Integrated Publishing services
Research article ISSN 0976 – 4380
The Marshy/swampy lands covering an area about 0.42% in 1976,1.14% in 1999 and has
been increased in 3.14% in 2007 with overall +3.88% average changes, this is because of
the conversion of tidal flat and waterlogged area into marshy/swampy land due to tidal
inundation. The mangroves areas increased from 0.01% in 1999 and 0.32% in 2007 due
to restoration activities (Figure.3). The mud flat areas are observed decreasing trend
1.76% in 1976, 0.17% (1999) and 0.07% in 2007 with 1.52% average changes, this
changes due to very low tides and less wave energy. In 1976 the Sandy area was 2.19%,
2.91% (1999) and 2007 it is observed as 1.16%. Near shore areas most of the sandy areas
are converted for industrial activities, builtup land and sea wall protection for natural
hazards.
Table 1: Landuse / landcover changes in Chennai coast
Land 1976 1999 2007 Total Average
cover types changes changes
Sq.km Percent Sq.km Percent Sq.km Percent
Settlement/ 96.174 16.82 145.543 26.20 182.415 31.91 74.94 +41.29
Hamlets
Cropland 39.213 6.86 8.726 1.57 13.564 2.37 10.80 2.91
Fallow land 1.358 0.23 2.899 0.52 0.788 0.13 0.89 0.42
Plantation 111.452 19.49 87.582 15.77 63.971 11.19 46.46 7.46
Scrub forest 3.467 0.60 21.724 3.91 3.741 0.65 5.17 3.95
Forest blank 0.281 0.04 0.247 0.04 0.005 0.01 0.09 0.01
Forest 10.411 1.82 13.089 2.35 8.264 1.44 5.62 1.98
plantation
Salt 0.643 0.11 1.842 0.33 10.786 1.88 2.33 +2.10
affected
land
Waterlogge 54.799 9.58 30.281 5.45 22.304 3.90 18.94 0.23
d land
Marshy/Sw 2.434 0.42 6.475 1.16 17.964 3.14 4.73 +3.88
ampy land
Land with 72.480 12.68 77.306 13.92 82.718 14.47 41.07 +15.71
scrub
Land 99.725 17.44 74.906 13.48 98.742 17.27 48.21 13.31
without
scrub
Sandy area 12.518 2.19 16.206 2.91 6.671 1.16 6.27 1.89
Industrial 1.525 0.26 9.850 1.77 10.837 1.89 3.93 +3.40
area
River/Strea 29.884 5.22 9.586 1.72 8.904 1.55 8.51 1.94
ms/Canal
Lake/Creek 14.242 2.49 43.341 7.80 32.814 5.74 16.03 11.05
Saltpan 15.312 2.67 14.583 2.55 4.738 0.85 6.08 0.72
Mud flats 10.091 1.76 0.962 0.17 0.406 0.07 2.00 1.52
Mangroves 2.212 0.38 0.018 0.003 1.833 0.32 0.71 0.06
During the period 1976 to 2007, waterlogged area, river/canal/streams, plantation are
decreased because of the anthropogenic activities. It is observed that in 5.22% (1976),
567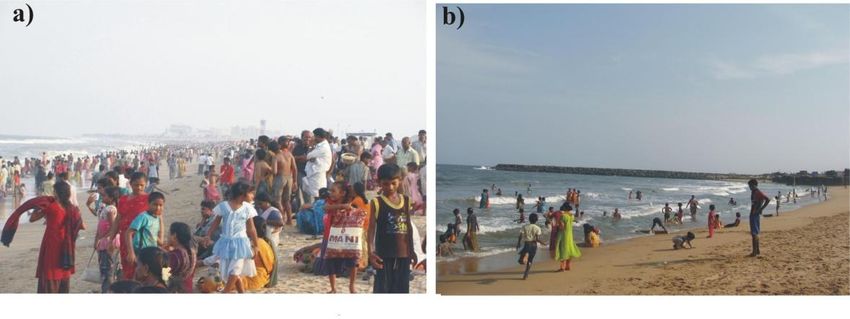
INTERNATIONAL JOURNAL OF GEOMATICS AND GEOSCIENCES
Volume 1, No 3, 2010
© Copyright 2010 All rights reserved Integrated Publishing services
Research article ISSN 0976 – 4380
1.72% (1999) of river/streams/canal areas diminished to 1.55% in 2007 with 1.94% of
average changes and waterlogged area in 1976 was 9.58%, 1997 was 5.45% and it was
3.90% in 2007, with 0.23% average changes and the waterlogged area were transformed
as cropland, land with scrub and built up land especially in north and south region. The
lake/creek is covered from the 7.66% in 1999, 5.74% in 2007 (Table.1).Because most of
the lake/creek have been converted to land without scrub /built up lands due to the form
of new residential areas and infrastructure developments. The human activities like
dumping of domestic sewage, pesticide, agricultural, chemicals and industrial effluents
are the reason for changes in the nature of Pulicat Lake and Ennore creek.
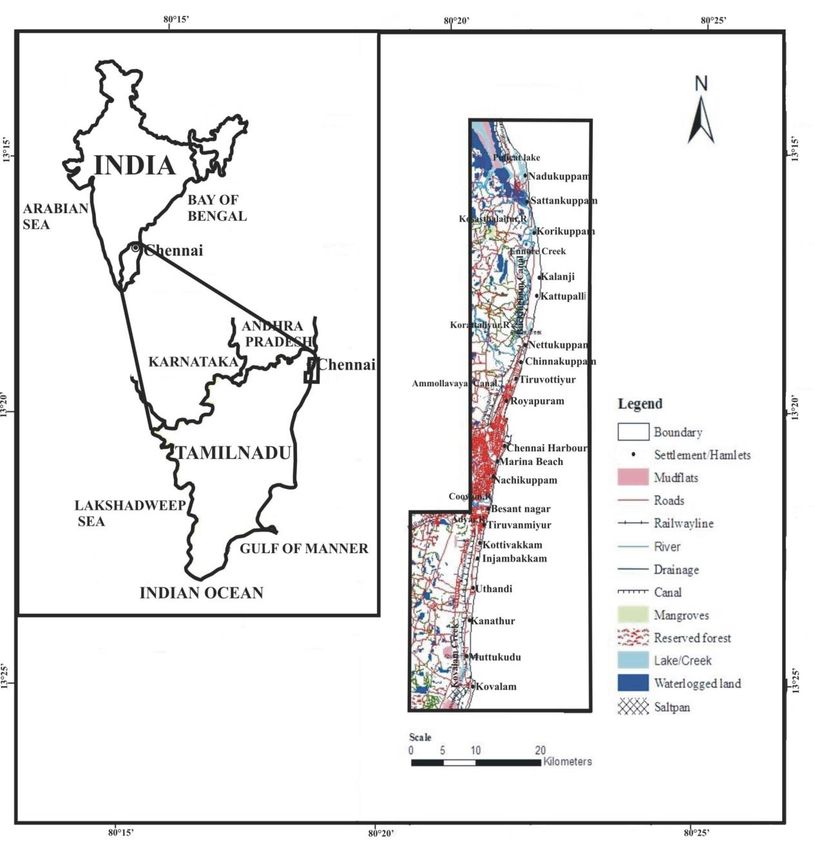
Figure 3: Landuse/landcover map for the years 1999 of the Chennai coastal
568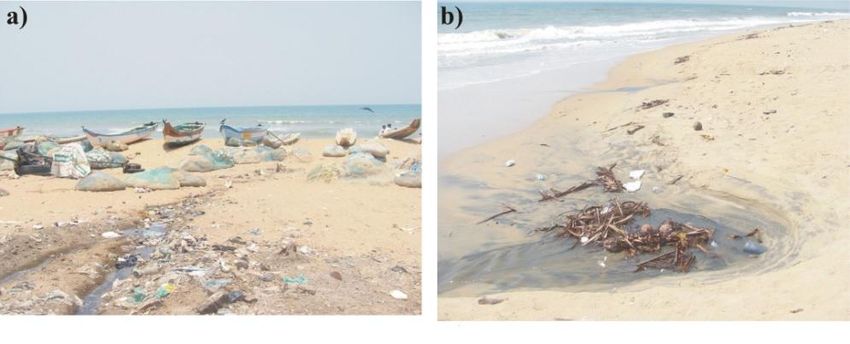
INTERNATIONAL JOURNAL OF GEOMATICS AND GEOSCIENCES
Volume 1, No 3, 2010
© Copyright 2010 All rights reserved Integrated Publishing services
Research article ISSN 0976 – 4380
Figure 4: Comparison of the landuse/landcover in Chennai (1976, 1999 and 2007)
Figure 5: Landuse/landcover map for the years 2007 of the Chennai coastal
It is observed that cropland covering 6.86% in 1976, 1.57% in 1999 and it is increased to
2.37% in 2007 with 2.91% average changes. It can be seen that increased from cropland
in 1976 and also decreased gradually from 1999 to 2007 which might be due to a
decrease in rainfall and the degradation of land (Figure.4).Comparatively results have
been observed from the land with scrub areas are increased from 12.68% in 1976,
13.68% in 1999 to 14.47% in 2007 with +15.71% of average changes. It may be due to
569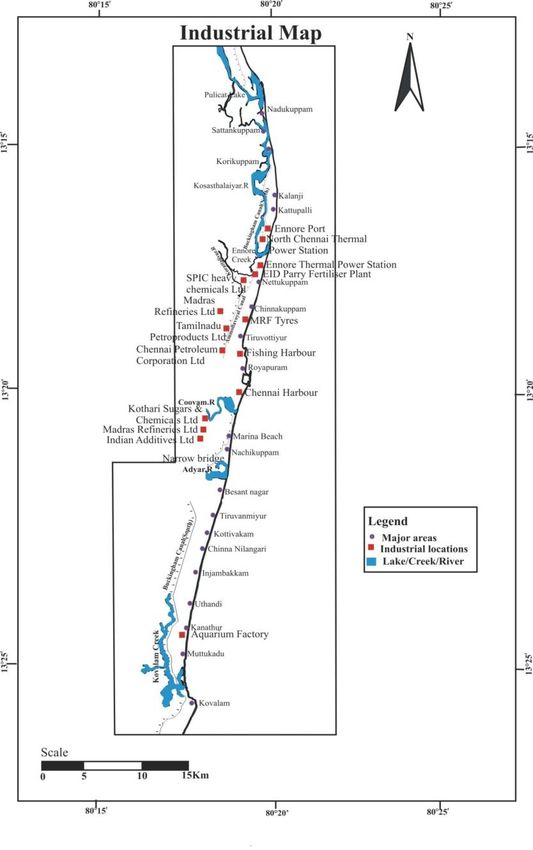
INTERNATIONAL JOURNAL OF GEOMATICS AND GEOSCIENCES
Volume 1, No 3, 2010
© Copyright 2010 All rights reserved Integrated Publishing services
Research article ISSN 0976 – 4380
conversion of forest plantation, plantation and scrub forest. In 2007, land without scrub
was 17.27% and 13.25% in 1999 this is due to degradation of forest plantation and the
scrub land but 1976 was 17.44% (Figure.5).Mainly marshy/swampy lands are changed to
the land with/without scrub. From that figure, it can be seen easily that salt affected land
was increased to 1.88% (2007) and drastically decreased from 0.11% to 0.33% (1976
1999) with changes from (+2.10%).It caused mainly from the transport by the waves is
impaired through the interaction of the others land to nearby coastal region, which was
the good land used in 1976 and 1999 for different purposes like agricultural land and
waterlogged land. Salt pan areas are observed in declining trend that, 2.67% in 1976,
2.58% in 1999 and 0.85% in 2007 due to the inter tidal areas are present from Ennore and
kovalam creek.
3.2 Environmental problems due to the changes in Chennai coastal region
3.2.1 Urban population pressure
Chennai has a highest density of population and rapidly increased in land conversation to
residential flats and waste generation. Due to enhanced importance of the city and its
environment, the migration of people is attracted towards the city, and occupies land for
businesses, commercial and residential purposes. (Rupesh and Anjan, 2008). The
dumping of the residential solid waste and untreated domestic wastewater are mixing to
the sea water and its affects the coastal ecology. (Figure.6).
Figure 6: Sewage pipe directly contaminated on the south Chennai coastal a & b.Chinna
Nilangari
3.2.2 Industrial activities nearby coastal region
Chennai coastal area comprises of the industries like thermal power stations, fertilizers
plant, tyre manufacturing unit, refineries and petroleum products industries another
associated small scale industries (Figure.7). Manali industrial zone and other several
zones are located near to the sea shore. These industrial units may discharge the partial
treated and untreated effluents that containing heavy metals and other toxic chemicals
that severely affecting the coastal and marine ecology. Especially, in north Chennai coast,
570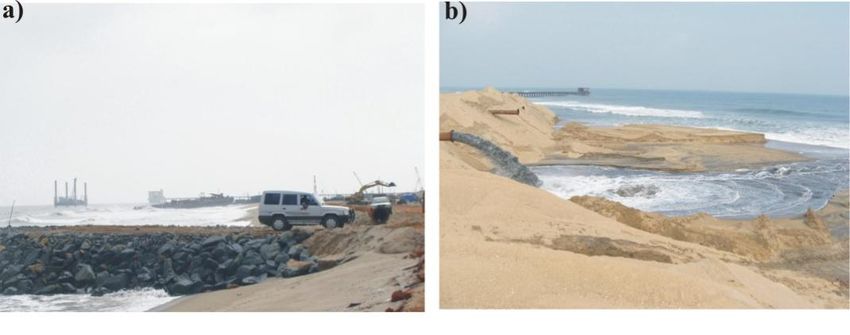
INTERNATIONAL JOURNAL OF GEOMATICS AND GEOSCIENCES
                               Volume 1, No 3, 2010
                       © Copyright 2010 All rights reserved Integrated Publishing services
Research article                                                                             ISSN 0976 – 4380

due to these industries Pulicat Lake is severely affected and it is the very sensitive
ecological area for birds migrating of this place. Also due to 2004 Tsunami the Chennai
coast was severely got eroded. Several commercial, business and construction activities
are creating more erosion problems to the coast (Figure. 8).

          Figure 7: Industrial activities of north Chennai coastal a. Kattupalli b.Ennore

                   Figure 8: Showing the Industrial map of Chennai coastal

                                                                                                         571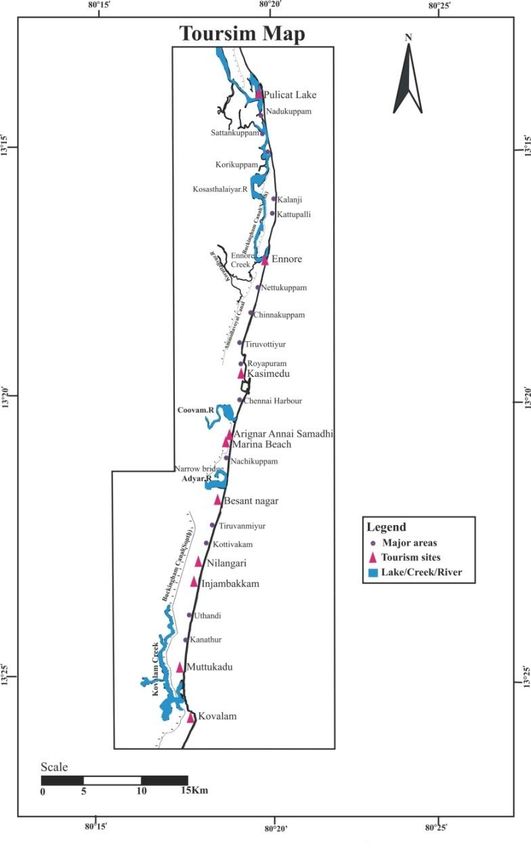
INTERNATIONAL JOURNAL OF GEOMATICS AND GEOSCIENCES
                               Volume 1, No 3, 2010
                     © Copyright 2010 All rights reserved Integrated Publishing services
Research article                                                                           ISSN 0976 – 4380

3.2.3 Tourism

The tourism activities are major problem for the coastal zone pollution especially solid
waste and plastics which creates several environmental problems to the marine organisms.
In north Chennai coast, Pulicat lake sanctuary is a very important tourism activity. The
Marina, Muttukudu, kovalam beaches are most hot tourism spots. Southern Chennai
region is very popular for tourism and resorts (Figure.9). Several theme parks and other
recreational activities are more in this region. These kinds of activities are polluting the
coastal zone and altering its nature (Figure.10).

      Figure 9: Toursim activities of Chennai coastal a. Marina beach b.Tiruvottiyur

                            Figure 10: Tourism map on Chennai coastal

                                                                                                       572
INTERNATIONAL JOURNAL OF GEOMATICS AND GEOSCIENCES
Volume 1, No 3, 2010
© Copyright 2010 All rights reserved Integrated Publishing services
Research article ISSN 0976 – 4380
Figure 11: The picture was taken in Chennai coastal region during field investigations. It
shows the comparison of same area in two different times. a) In 2008, the bridge
construction on Pulicat Lake. b) Anthropogenic activity (Bridge construction) resulting in
the erosion along Pulicat Lake (2010). C & d) represents the Ennore coast were in 2008
we can see the vegetation cover and the open coast while in 2010 there is more of
anthropogenic activity.
A view of the field observations confirm that heavily polluted from the Chennai coastal
and the coastal protection was immediately taken up some remedial measures is as
follows. First, it consists of design of groins, seawalls, jetties, offshore breakwaters and
artificial beach nourishments, these remedies to reduce from the beach erosion problems.
The coastal protection will be prepared to plan from plantation, mangroves. More
awareness from the people to participants to clean up and social mobilization should to
take to prevent from the coastal environment. The public people and government should
plan to protect the Chennai coast from the rapid changes of its nature. Proper treatment
facilities should be there for treating the residential zone waste materials and toxic waste.
4. Conclusions
Satellite remote sensing and GIS is a powerful tool for mapping and evaluating the
landuse/land cover changes in coastal environment. The Chennai coastal zone changes
during the past 10 years mainly due to the population growth, commercial and industrial
activities. The map shows the major changes in the coastal landforms i.e. increase in
builtup land, industries and in other hand cropland, forest area is decreased. Waterlogged
area has been decreased due to anthropogenic activities. Field observation also proves
that drastic change in the Chennai coastal zone because of commercial, industrial and
573INTERNATIONAL JOURNAL OF GEOMATICS AND GEOSCIENCES
Volume 1, No 3, 2010
© Copyright 2010 All rights reserved Integrated Publishing services
Research article ISSN 0976 – 4380
entertainment tourism activities. The study suggests some remedial measures to protect
the Chennai coastal environment changes. Proper coastal zone rules should be strictly
implemented to protect the construction and other related activities near to the coast.
Proper mitigation plan should be implemented for protecting the coast from the erosion.
More awareness should be given about the importance of the coastal ecology to touristers.
5. References
1. Abhijeet Bernard Chaves., Lakshumanan, C., 2008: “ Remote Sensing and GIS –
based integrated study and analysis for MangroveWetland Restoration in Ennore
Creek,Chennai,South India,” Proceeding of Taal2007:The 12th World Lake
Conference, pp.685690
2. Alphan, H., 2003: “Land use change and urbanization in Adana, Turkey”, Land
degradation and Development. 14, pp 575–586.
3. Beiras, R., Bellas, J., Fernandez, Z., Lorenzo, J. I., CobeloGarcia, A., 2003:
“Assessment of coastal marine pollution in Galicia (NW Iberian Peninsula); metal
concentrations in seawater, sediments and mussels (Mytilus galloprovincialis)
versus embryolarval bioassays using Paracentrotus lividus and Ciona intestinalis”,
Marine Environmental Research. 56, pp 531–553.
4. Bocco, G., Mendoza, M., Velazquez, A., 2001: “Remote sensing and GISbased
regional geomorphological mapping—a tool for land uses planning in developing
countries”, Geomorphology, 39, pp 211–219.
5. Borges, R., HernandezGuerra, A., Nykjaer, L., 2004: “Analysis of sea surface
temperature time series of the southeastern North Atlantic”, International J. of
Remote Sensing 25(5), pp 869891.
6. Brahabhatt, V.S., Dalwadi, G. B., Chhabra, S. B., Ray, S. S., Dadhwal, V. K.,
2000: “Landuse/land cover change mapping in Mahi canal command area,
Gujarat, using multitemporal satellite data”, J. Indian Soc. Remote Sensing.
28(4), pp 221232.
7. Capuzzo, J. M., Burt, B. V., Duedall, I. W., Park, P. K., Kester, D. R.,1985:
“Near shore waste disposal”. New York: Wiley.
8. Devi, V., Miranda, W. J., AbdulAzis, P. K., 1996: “Deterioration of water
quality—an overview on the pollution problems of the Ashtamudi Estuary”,
Pollution Research. 15, pp 367–370.
574INTERNATIONAL JOURNAL OF GEOMATICS AND GEOSCIENCES
Volume 1, No 3, 2010
© Copyright 2010 All rights reserved Integrated Publishing services
Research article ISSN 0976 – 4380
9. Gautam, N. C., Narayanan, L. R. A., 1983: “Landsat MSS data for land use/land
cover inventory and mapping: A case study of Andhra Pradesh”, J. Indian Soc.
Remote Sensing, 11(3), pp 1528.
10. Giri, C., Zhu, Z., Reed, B., 2005: “Comparative analyses of the Global Land
Cover 2000 and MODIS land cover data sets”, Remote Sensing of Environment,
94, pp 123–132.
11. Hakan, A., 2005: “Perceptions of coastline changes in river deltas: southeast
Mediterranean coast of Turkey”, Int. J. Environment and Pollution. 23 (1), pp 92
102.
12. Jain, S. K., 1992: “Land use mapping of Tawi catchment using satellite data”.
Report No. CS72, National Institute of Hydrology, Roorkee, 52.
13. Klemas, V., 1986: “Remote sensing of coastal resources in developing countries”,
Proceedings of the conference of Remote Sensing and its impact on Developing
Countries, Rome, 1621 June 1986: Pontifical Academy of Sciences, 122.
14. Klemas, V., Abdel Kader, A. M., 1982: “Remote sensing of coastal processes
with emphasis on the Nile Delta, In: Proceedings of the International Symposium
on Remote Sensing of Environments”, Cairo, Egypt, 27.
15. Konecny, G., 2003: “Geoinformation: Remote Sensing, Photogrammetry, and
Geographic Information Systems”, London: Taylor and Francis.
16. Li Xiubin., 1995: “A review of the international researches on land use/cover
change”, Acta Geographica Sinica.51 (6), pp 553.
17. Muttitanon, W., Tripathi, N. K., 2005: “Land use/cover changes in the coastal
zone of Bay Don Bay, Thailand using Landsat 5 TM data”, International Journal
of Remote Sensing, 26(11),pp 2311–2323.
18. Nurlu, E., Erdem, U., 2002: An overview of the Turkish coastal zone management
within the framework of the European Union. In D. Camarda & L. Grassini
(Eds.), Proceedings of the second meeting on “agriculture and urbanization in the
mediterranean region. Enablingpolicies for sustainable use of soil and water” (pp.
107–111), Options Mediterraneennes, Series: A, Mediterranean Seminars 53, Bari.
19. Rama Devi, V., Miranda, W.J., Adhul Azis, P.K., 1996: “Deterioration of water
qualityAn overview on the pollution problems of the Ashtamudi Estuary,”
Pollution Res, 15, pp 367370.
575INTERNATIONAL JOURNAL OF GEOMATICS AND GEOSCIENCES
Volume 1, No 3, 2010
© Copyright 2010 All rights reserved Integrated Publishing services
Research article ISSN 0976 – 4380
20. Rupesh, G., Anjan, S., 2008: “Monitoring physical growth of ranchi city by using
geoinformatics techniques”, ITPI journal 5(4), pp 38 – 48.
21. Sharma, K. R., Jain, S. C., Garg, R. k, 1984: “Monitoring land use and land cover
changes using landsat images”, J. Indian Soc. Remote Sensing 12(2), pp 115121.
22. Tran, K. C., Euan, J., Isla, M. L., 2002: “Public perception of development issues:
Impact of water pollution on a small coastal community”, Ocean and Coastal
Management 45, pp 405–420.
23. Verburg, P. H., Chen, Y., Soepboer, W., Veldkamp, A., 2000: “GISbased
modeling of humanenvironment interactions for natural resource management”,
Applications in Asia. In: Proceedings of the 4th International Conference on
Integrating GIS and Environmental Modeling (GIS/EM4): Problems, Prospects
and Research Needs, Canada 2000, 113.
24. Williams, C., 1996: “Combating marine pollution from landbased activities:
Australian initiatives,” Ocean and Coastal Management, 33, pp 87–112.
576You can also read