Generation of Ultrasound Based on the Frequency Response Characteristics of the "Koss Pro Headphone" with R. David Case Sound Wave Files-A Case ...
←
→
Page content transcription
If your browser does not render page correctly, please read the page content below
World Journal of Engineering and Technology, 2021, 9, 374-383
                                                                                                 https://www.scirp.org/journal/wjet
                                                                                                            ISSN Online: 2331-4249
                                                                                                              ISSN Print: 2331-4222

Generation of Ultrasound Based on the
Frequency Response Characteristics of the
“Koss Pro Headphone” with R. David Case
Sound Wave Files—A Case Study

R. David Case1, D. Chuckravanen2

The R. David Case Sound Device and Research Collaborator, Van Buren, Missouri, USA
1

British Association of Cognitive Neuroscience, Department of Psychology, University of Essex, Colchester,
2

United Kingdom

How to cite this paper: Case, R.D. and          Abstract
Chuckravanen, D. (2021) Generation of Ul-
trasound Based on the Frequency Response        The research aim of this work is to analyse the characteristics of R. David
Characteristics of the “Koss Pro Headphone”     Case Sound waves that seemed to have positive effects on people suffering
with R. David Case Sound Wave Files’—A
                                                from tinnitus. Moreover, the participants who listened to these sound wave
Case Study. World Journal of Engineering
and Technology, 9, 374-383.                     files using specific headsets or headphones of the Koss models (ktx Pro,
https://doi.org/10.4236/wjet.2021.92026         ksc-75) showed improved health condition such as alleviating tinnitus.
                                                Therefore, these discoveries have encouraged R. David Case to pursue posi-
Received: February 15, 2021
                                                tively his journey into finding out what is special about those sounds when
Accepted: May 24, 2021
Published: May 27, 2021
                                                being listened specifically with Koss models. In this research, we focus mainly
                                                on the technical aspects of R. David Case sound signals which he has record-
Copyright © 2021 by author(s) and               ed. These specific sound waves were analysed using time domain, frequency
Scientific Research Publishing Inc.
                                                domain as well as the effect of using the Koss Pro headphone frequency re-
This work is licensed under the Creative
Commons Attribution International
                                                sponse characteristics applied to the sound. Results obtained from the analy-
License (CC BY 4.0).                            sis demonstrated that the generation of ultrasound can be the underlying
http://creativecommons.org/licenses/by/4.0/     reason for the treatment of the tinnitus.
                Open Access
                                                Keywords
                                                Ultrasound, Tinnitus, David Case Sound Wave File, Frequency Analysis,
                                                Healing

                                              1. Introduction
                                              In General, hearing depends on a sequence of complicated stages that change
                                              sound waves in the air into electrical signals. Then, the auditory nerve transports

DOI: 10.4236/wjet.2021.92026        May 27, 2021                   374                 World Journal of Engineering and Technology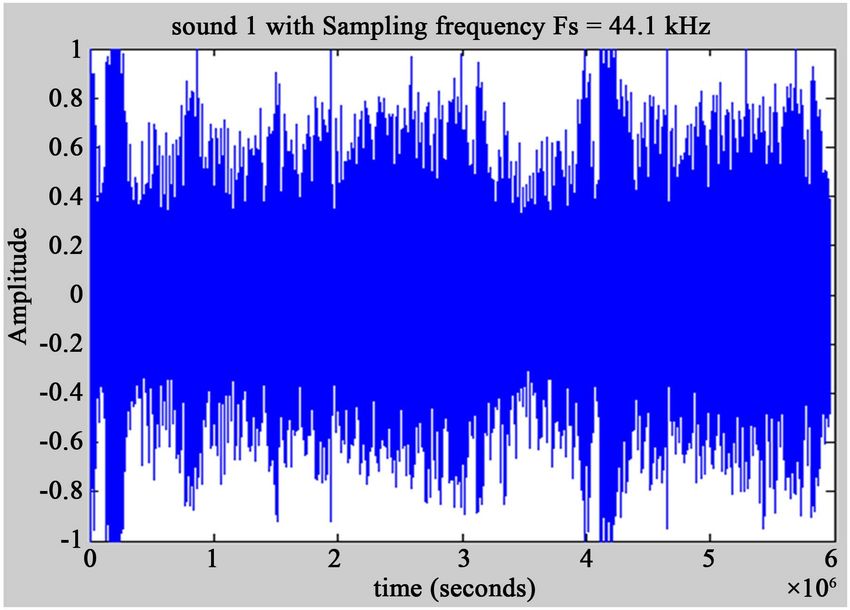
R. D. Case, D. Chuckravanen

                               these signals to our brain. The sound wave enters the outer ear and then it tra-
                               vels through the ear canal leading to the eardrum. Subsequently, the eardrum
                               vibrates owing to the incoming sound waves and then sends these vibrations to
                               tiny bones that are found in the middle ear. These bones amplify the sound vi-
                               brations which are then sent to the cochlea (snail-shaped structure) filled with
                               fluid in the inner ear. An elastic partition runs from the beginning to the end of
                               the cochlea, splitting it into an upper and lower part. This partition is called the
                               basilar membrane because it serves as the base, or ground floor, on which key
                               hearing structures sit. Once the vibrations cause the fluid inside the cochlea to
                               ripple, a traveling wave forms along the basilar membrane, hair cells—sensory
                               cells sitting on top of the basilar membrane—ride the wave. Hair cells near the
                               wide end of the snail-shaped cochlea detect higher-pitched sounds, such as an
                               infant crying. Those closer to the center detect lower-pitched sounds, such as a
                               large dog barking. As the hair cells move up and down, microscopic hair-like
                               projections (known as stereocilia) that perch on top of the hair cells bump
                               against an overlying structure and bend. Bending causes pore-like channels,
                               which are at the tips of the stereocilia, to open up. When that happens, chemi-
                               cals rush into the cells, creating an electrical signal. The auditory nerve carries
                               this electrical signal to the brain, which turns it into a sound that we recognize
                               and understand.
                                  The normal range of human hearing is 20 Hz to 20,000 Hz. Under ideal lab
                               conditions, human can hear sound as low as 12 Hz and as high as 28 kHz,
                               though the threshold increases sharply at 15 kHz in adults, corresponding to the
                               last auditory channel of the cochlea. The next sub-section explains what is ultra-
                               sound and why it is important for this research work.

                               1.1. What is Ultrasound?
                               Ultrasound is acoustic (sound) energy in the form of waves having a frequency
                               above the human hearing range. The highest frequency that the human ear can
                               detect is approximately 20 thousand cycles per second (20,000 Hz). This is where
                               the sonic range ends, and where the ultrasonic range begins. In physics the term
                               “ultrasound” applies to all acoustic energy with a frequency above human hear-
                               ing (20,000 hertz or 20 kilohertz). Typical diagnostic sonographic scanners op-
                               erate in the frequency range of 2 to 18 megahertz, hundreds of times greater
                               than the limit of human hearing. Ultrasound is used in electronic, navigational,
                               industrial, and security applications. It is also used in medicine to view internal
                               organs of the body.
                                  Since the inception of ultrasound as a therapeutic tool, its potential to treat
                               disorders throughout the brain has been explored. The objective has been to
                               utilize ultrasound’s focusing ability to target precisely within deep tissues, af-
                               fecting only the interested volume while leaving all other structures unaltered
                               [1]. Varying the ultrasound parameters not only allows ablation of pathological
                               tissue, such as brain tumours and metastases, or silencing of dysfunctional neu-
                               ronal circuits, but also opens up the blood–brain barrier for targeted drug deli-

DOI: 10.4236/wjet.2021.92026                        375                 World Journal of Engineering and Technology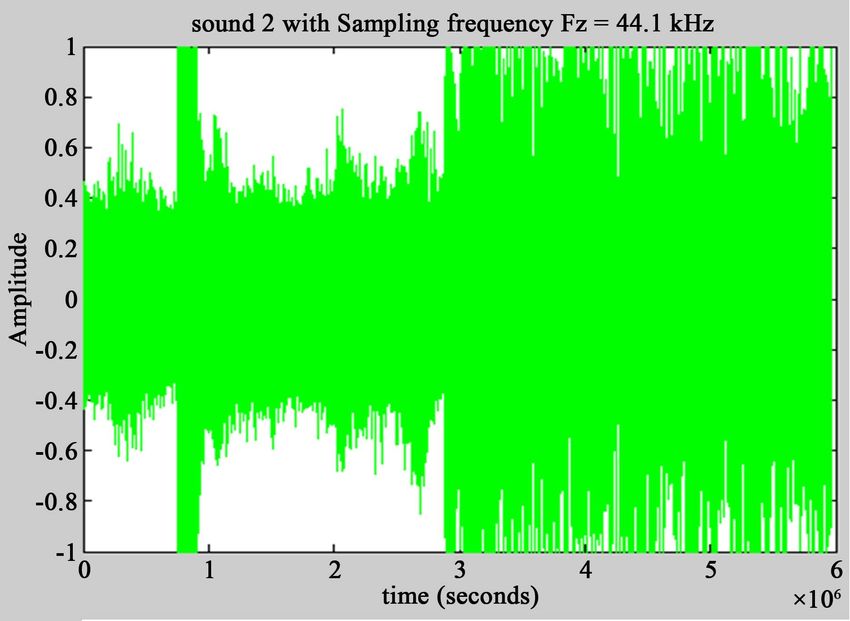
R. D. Case, D. Chuckravanen
very and modulation of neural function [2]. Before we go directly into analysing
those unique sound waves generated by a “device” built by R. David Case, it is
important also to define what is tinnitus and how it affects a lot of people
worldwide in the next sub-section.
1.2. Tinnitus
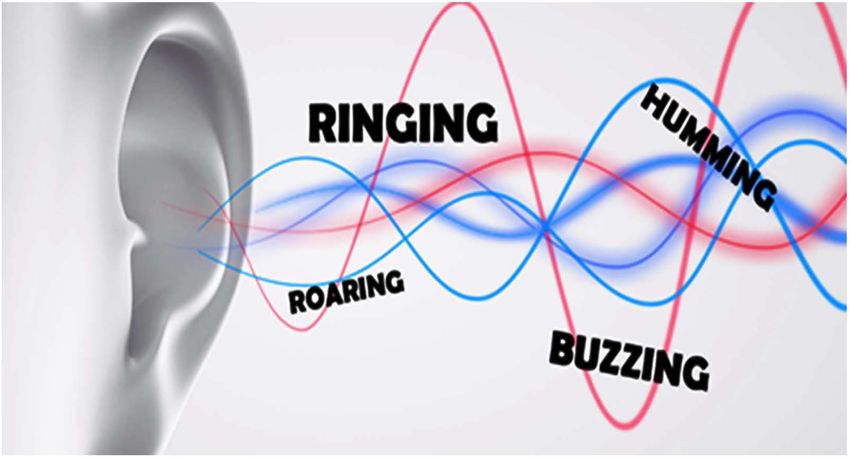
Tinnitus usually occurs when one experiences ringing or other noises in one or
both ears (See Figure 1). The noise you hear when you have tinnitus is not
caused by an external sound, and other people usually cannot hear it. In fact,
tinnitus is a common problem. It affects about 15% to 20% of people. Tinnitus is
usually caused by an underlying condition, such as age-related hearing loss, an
ear injury or a problem with the circulatory system. For many people, tinnitus
improves with treatment of the underlying cause or with other treatments that
reduce or mask the noise, making tinnitus less noticeable. In this research, we
have investigated how the sound files when listening from Koss Pro headphones
can really pose as Anti-tinnitus. Next section describes the methodology em-
ployed to analyse the sound wave signals as well as the effect of the frequency
response characteristics of the Koss Pro headphones on R. David Case sounds.
2. Research Methodology
All analyses are conducted on Scientific Matlab R2009a Platform running on a
64-bit computer system architecture with Intel Core I7 and processing speed is
2.90 GHz. Sound files were recorded by Mr. R. David Case and they are in *.wav
format and the digital size of the sound file is about 800 MB. All sound files
(stereo sounds) were imported to the Matlab environment for analyses purposes.
Spectral analyses are conducted on those sound waves, and also the effect of the
frequency responses of the specific Koss pro headphone on those sound files are
investigated too. Experiment is being conducted on Koss Pro headphone device
with the following specifications: 15 Hz to 25,000 Hz, 60 Ohms, 101 dB SPL, 4
ft/1.2 m. 3.5 mm (See Figure 2). In addition, follow-ups were conducted on all
the people who utilised such sounds to improve their health conditions such as
tinnitus, or vibrations in certain parts of the body or to reduce “voices” that only
them can hear.
Figure 1. Tinnitus and the types of ringing.
DOI: 10.4236/wjet.2021.92026 376 World Journal of Engineering and Technology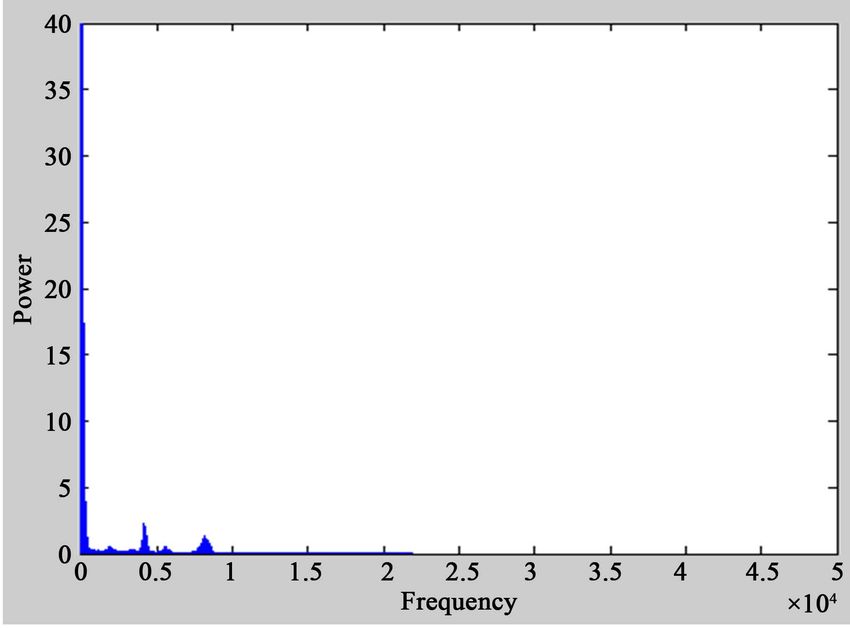
R. D. Case, D. Chuckravanen

                               Figure 2. Koss Pro Headphone under analysis for frequency response using Matlab Soft-
                               ware R2009a.

                               3. Results
                               3.1. Time-Domain Presentation of the R. David Case Sound File
                               The sound wav file was imported to the Matlab environment so as the sound
                               wav data can be used for further analyses as the sound data is in a matrix format.
                               Once the sound wav was in the Matlab workspace, the following Figure 3 was
                               generated in order to visualise in the time domain the sound wav. The sampling
                               frequency of the sound wave is 44.1 kHz.
                                  In contrast to Figure 3 which shows that the sound is varying randomly
                               (where we need to see what is happening in frequency domain), in Figure 4, the
                               amplitude of the sound changes abruptly at approximately half of the time pe-
                               riod.

                               3.2. Frequency Domain Presentation of R. David Case Sound File
                               As shown in Figure 4, when the spectral analysis is applied to the component 1
                               of the Sound wav, there were frequency peaks at around 0, 0.4, and 0.8 × 10⁴ Hz.
                               On the other hand, when the spectral analysis is applied to the component 2 of
                               the sound wav, there were frequency peaks at around 0 Hz, 0.20, 0.25, 0.4 and
                               0.9 × 10⁴ Hz (Figure 5 and Figure 6).

                               3.3. Characteristic Frequency Response of Koss Pro Headphone
                               From Figure 7, it is clearly observed that the power-frequency spectrum is not con-
                               stant and varies throughout the normal hearing frequency spectrum. It decreases
                               exponentially from 0 Hz to 4000 Hz and then the power increases at around 5000
                               Hz and again the power decreases to a minimum at about 7000 Hz and then in-
                               creases to a plateau effect at around 10,000 Hz and decreases till to 15,000 Hz.

DOI: 10.4236/wjet.2021.92026                        377                  World Journal of Engineering and Technology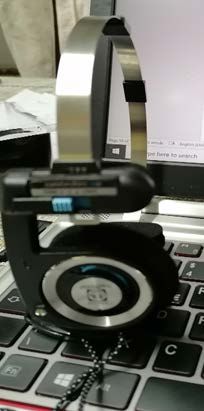
R. D. Case, D. Chuckravanen

                               Figure 3. Sound 1 component of the device stereo sound wav (Amplitude vs. Time).

                               Figure 4. 2nd sound component in the stereo sound wav data (Amplitude vs. Time).

                               Figure 5. Spectral analysis with Frequency centred at f = 0 Hz for sound component 1.

DOI: 10.4236/wjet.2021.92026                       378                  World Journal of Engineering and Technology
R. D. Case, D. Chuckravanen
Figure 6. Power vs. Frequency spectrum (for sound component 2 of the recorded R. Da-
vid Case sound wave. Frequency centred at f = 0 Hz for Sound component 2.
Figure 7. The power (W)-frequency (Hz) response of the Koss Pro headphone.
3.4. Convolution of the Sound Wave Signals with the Frequency
Characteristics of the Koss Pro Headphone
3.4.1. Application of Convolution
One of the most important concepts in Fourier theory is that of a convolution.
Mathematically, a convolution is defined as the integral over all space of one
function at x times another function at u-x. The integration is taken over the va-
riable x (which may be a 1D variable), typically from minus infinity to infinity
over all the dimensions. So the convolution is a function of a new variable u, as
C ( u) = f ( x ) ⊗ g ( x ) = ∫ f ( x ) g ( u − x ) dx
space
shown in the following equations.
= g ( x) ⊗ f ( x) = ∫ g ( x ) f ( u − x ) dx
space
The cross in a circle is used to indicate the convolution operation [3] [4] [5] [6].
DOI: 10.4236/wjet.2021.92026 379 World Journal of Engineering and TechnologyR. D. Case, D. Chuckravanen
Note that it does not matter which function to take first, i.e. the convolution
operation is commutative. The function f(x) represents the function of the sound
wave and the function g(x) represents the Headphone frequency response cha-
racteristics.
The positive working of the sound wave coupled with the Koss headphones
produce a frequency which is healing the inner ear organ of the human body and
act as an anti-tinnitus, and therefore convolution algorithm is applied to the sound
wav and also the frequency response characteristics of the Koss headphone to pro-
duce a new convolution spectrum elaborated in the next sub-section.
3.4.2. Analysed Work
It was interesting to find that the convolved signal of the frequency response of
the Koss headphone and the Sound component 1 did not show anything visually
significant. However, when the convolution method was applied to the second
sound wave component, the following spectrum Figure 8 is obtained.
It is clearly observed that there are maximum peaks at the frequency 2.822 ×
10 Hz which is created from the machinery of the sound device and the head-
6
phone and this ultrasonic wave frequency needs to be further investigated.
3.5. Experiment Repeated with a 80 Minute Sound Wave File
The sound wave signals were brought to Matlab environment and as it was large
size (memory), my program loops through every 2 minutes of the sounds in or-
der to depict the various frequency components (frequency spectrum), the
maximum frequency component also as well as the sounds through time. There
was decrease and increase in the signal throughout the duration of the sound
recordings. We have found the following peaked frequencies for each sound or
rather ultra-sound component (Figure 9 and Figure 10).
Figure 8. Spectrum of the sound wave signals when they were convoluted with the fre-
quency response from the headphone Koss.
DOI: 10.4236/wjet.2021.92026 380 World Journal of Engineering and TechnologyR. D. Case, D. Chuckravanen
Figure 9. The frequency component after the application of Fast Fourier transform (FFT)
on the signal component 1 demonstrated a maximum peak at 2.9949 MHz for the sound
component 1 and this is the average for every 2 minutes for the sound wav file.
Figure 10. The frequency component emanated from the Fast Fourier transform (FFT) of
the signal component 2 showed a maximum peak at 2.8219 MHz for the sound compo-
nent 2 and this is the average for every 2 minutes for the sound wav file.
1) Ultra-Sound component 1: 2.9949 × 10⁶ Hz
2) Ultra-Sound component 2: 2.8219 × 10⁶ Hz
4. Discussions
This research analysed the sound waves generated from a sound device by R.
David Case and the sound is called after him which is R. David Case sound wave
file. The sound has the capability to cure or accelerate the healing process or re-
verse the process of tinnitus. It is posited that there may be some frequencies
that are found in the generated sound waves which could do this.
Subjectively, based on various feedbacks from people who were administered
this sound (at their own consents) described the sounds as follows. One of the
DOI: 10.4236/wjet.2021.92026 381 World Journal of Engineering and TechnologyR. D. Case, D. Chuckravanen
participant who listened to the long sound wave at low volume intermittently
state that he does not need Valium to circumvent the ringing in the ear and he
states that the amplitude of the tinnitus seems to fluctuate high and low with
improved cognitive concentration. Another participant who listened to the
sound continuously for couple of days explained that he is able to do his day to
day activities in peace and he states that he is cured from the tinnitus. Another
participant posits that the sound waves have the capability to eliminate vibra-
tions that were occurring on chest area, and then torso and also he is looking
forward to remove occurrences from his lower body. Another subject claimed
that the sound therapy he received from this peculiar sound really stopped his
hyperacusis [7] in minimum duration (couple of weeks) and this sound has re-
duced his tinnitus greatly. Currently, he strongly wants to get rid of the tinnitus
by listening to the sounds more consistently than he did before. The next partic-
ipant realises that after 7 consecutive days of listening 6 hours of the sounds dai-
ly, he has observed that his right ear which normally can hear up to 10,400 Hz
improve to 14,600 Hz. His specialist advised him to continue using such sound
device as his tinnitus has greatly improved as well as his hearing capabilities.
Last but not the least, a participant found that he can sleep better at night after
listening to the sounds and at low volume.
Technically speaking, the production of the ultrasound waves can happen
owing to two types of effects that are: the first way is the magnetostriction oscil-
lator and the second way is the piezoelectric oscillator. In our case, we will study
the magnetostriction oscillator as it represents closely the materials that are
found in the headphone (coil + magnet). This is elaborated in further research
conducted by the authors. Based on the digital signal analysis of the sound wav
and the headphone frequency characteristics, it was found that there is a much
higher ultrasound frequency which is being generated. This, in turn is causing a
positive effect on those people suffering from tinnitus [8] [9].
5. Conclusion
In this case study research, it is demonstrated how the unique sound wave com-
prising of both stereo and mono-waves generated by R. David Case coupled with
the headphone characteristics (based on its Power-frequency response) can in
fact alleviate the tinnitus problem. The ultrasound frequencies, as obtained in
this research, can reverse the process of creating tinnitus and therefore it heals
the human beings suffering from it. Based on the different interviews and feed-
backs, it is clear that the sound wav and the headphone can be treated as a med-
ical sound treatment or medical ultrasound treatment. Further research will look
at analysing a larger sample of subjects/participants with their consent and ob-
serve if there are no long-term side effects. Couple with that, we need to devise
an anti-tinnitus administration protocol and state clearly in that protocol the
duration of listening this sound, and at what ideal amplitude, should the sound
be played. The sound can concentrate in specific range of frequencies.
DOI: 10.4236/wjet.2021.92026 382 World Journal of Engineering and TechnologyR. D. Case, D. Chuckravanen
Conflicts of Interest
The authors declare no conflicts of interest regarding the publication of this pa-
per.
References
[1] Hynynen, K. and Clement, G. (2007) Clinical Applications of Focused Ultrasound—
The Brain. International Journal of Hyperthermia, 23, 193-202.
https://doi.org/10.1080/02656730701200094
[2] Martin, E. and Werner, B. (2013) Focused Ultrasound Surgery of the Brain. Current
Radiolology Reports, 1, 126-135. https://doi.org/10.1007/s40134-013-0013-0
[3] Didar Urynbassarova, Li, B.Z. and Zhang, Z.C. (2017) A Convolution Theorem for
the Polynomial Fourier Transform. IAENG International Journal of Applied Ma-
thematics, 47, 381-387.
[4] McGillem, C.D. and Cooper, G.R. (1984) Continuous and Discrete Signal and Sys-
tem Analysis. 2nd Edition, Holt, Rinehart and Winston, New York, 118 (3-102).
ISBN 0-03-061703-0.
[5] Proakis, J.G. and Manolakis, D.G. (1996) Digital Signal Processing: Principles, Al-
gorithms and Applications. 3rd Edition, Prentice-Hall International, New Jersey,
297.
[6] Pienkowski, M., Tyler, R.S., Roncancio, E.R., Jun, H.J., Brozoski, T., Dauman, N.,
Coelho, C.B., Andersson, G., Keiner, A.J., Cacace, A.T., Martin, N. and Moore, B.C.
(2014) A Review of Hyperacusis and Future Directions: Part II. Measurement, Me-
chanisms, and Treatment. American Journal of Audiology, 23, 420-436.
https://doi.org/10.1044/2014_AJA-13-0037
[7] McCombe, A., Baguley, D., Coles, R., McKenna, L., McKinney, C. and Windle-
Taylor, P. (2001) Guidelines for the Grading of Tinnitus Severity: The Results of a
Working Group Commissioned by the British Association of Otolaryngologists,
Head and Neck Surgeons, 1999. Clinical Otolaryngology and Allied Sciences, 26,
388-393. https://doi.org/10.1046/j.1365-2273.2001.00490.x
[8] Langguth, B., Goodey, R., Azevedo, A., et al. (2007) Consensus for Tinnitus Patient
Assessment and Treatment Outcome Measurement: Tinnitus Research Initiative
meeting, Regensburg, July 2006. Progress in Brain Research, 166, 525-536.
https://doi.org/10.1016/S0079-6123(07)66050-6
[9] Meikle, M.B., Stewart, B.J., Griest, S.E., et al. (2007) Assessment of Tinnitus: Mea-
surement of Treatment Outcomes. Progress in Brain Research, 166, 511-521.
https://doi.org/10.1016/S0079-6123(07)66049-X
DOI: 10.4236/wjet.2021.92026 383 World Journal of Engineering and TechnologyYou can also read