IDENTIFYING DIFFERENT DEFINITIONS OF FUTURE IN THE ASSESSMENT OF FUTURE ECONOMIC CONDITIONS: APPLICATION OF PU LEARNING AND TEXT MINING
←
→
Page content transcription
If your browser does not render page correctly, please read the page content below
I DENTIFYING D IFFERENT D EFINITIONS OF F UTURE
                                               IN THE A SSESSMENT OF F UTURE E CONOMIC C ONDITIONS :
                                                   A PPLICATION OF PU L EARNING AND T EXT M INING
arXiv:1909.03348v3 [econ.EM] 22 Apr 2020

                                                                                                A P REPRINT

                                                                                            Masahiro Kato
                                                                                        The University of Tokyo
                                                                                    mkato@ms.k.u-tokyo.ac.jp

                                                                                               April 23, 2020

                                                                                                A BSTRACT
                                                    The Economy Watcher Survey, which is a market survey published by the Japanese government, con-
                                                    tains assessments of current and future economic conditions by people from various fields. Although
                                                    this survey provides insights regarding economic policy for policymakers, a clear definition of the
                                                    word “future” in future economic conditions is not provided. Hence, the assessments respondents
                                                    provide in the survey are simply based on their interpretations of the meaning of “future.” This mo-
                                                    tivated us to reveal the different interpretations of the future in their judgments of future economic
                                                    conditions by applying weakly supervised learning and text mining. In our research, we separate the
                                                    assessments of future economic conditions into economic conditions of the near and distant future
                                                    using learning from positive and unlabeled data (PU learning). Because the dataset includes data
                                                    from several periods, we devised new architecture to enable neural networks to conduct PU learning
                                                    based on the idea of multi-task learning to efficiently learn a classifier. Our empirical analysis con-
                                                    firmed that the proposed method could separate the future economic conditions, and we interpreted
                                                    the classification results to obtain intuitions for policymaking.

                                           1 Introduction
                                           The Economy Watcher Survey is a market survey published by the Japanese government. The data consists of two
                                           types of assessments of economic conditions, current and future economic conditions, with five ranks. Although
                                           this survey provides policymakers with deep insights, it is difficult to interpret the assessments of future economic
                                           conditions because the meaning of future is not clearly defined and the definition thereof relies on the respondent’s
                                           interpretation. Therefore, to obtain a clear understanding of survey participants’ expectations, our approach was to
                                           classify assessments of future economic conditions into those pertaining to the near and distant future, respectively.
                                           This led us to propose a novel method that uses text data and a machine-learning algorithm in an attempt to grasp
                                           these expectations with respect to future economic conditions using data from the Economy Watcher Survey. For
                                           the classification task, we apply an algorithm that learns from positive and unlabeled data (PU learning), which is a
                                           machine-learning algorithm that enables us to train a classifier only from positive and unlabeled data.
                                           Among studies of economic trends, methods using information contained in text data have become popular. Pio-
                                           neering methods in this field are Tetlock [2007]; Tetlock et al. [2008], which involved the construction of sentimental
                                           indexes from articles of a column in the Wall Street Journal and an analysis of the predictability of the stock market.
                                           Kulkarni et al. [2009] predicted the residential price by using the number of searches on Google. Guzman [2011] also
                                           constructed real-time inflation expectations from search queries on Google.
                                           PU learning is an algorithm of weakly supervised learning [Elkan and Noto, 2008; Ward et al., 2009; Blanchard et al.,
                                           2010; Nguyen et al., 2011]. In the section describing the problem setting, we consider a situation in which only positive
                                           and unlabeled data exist, and use only these data to train a binary classifier. PU learning has two scenarios known as
                                           censoring scenario and case-control scenario Elkan and Noto [2008]. In the study presented in this paper, we only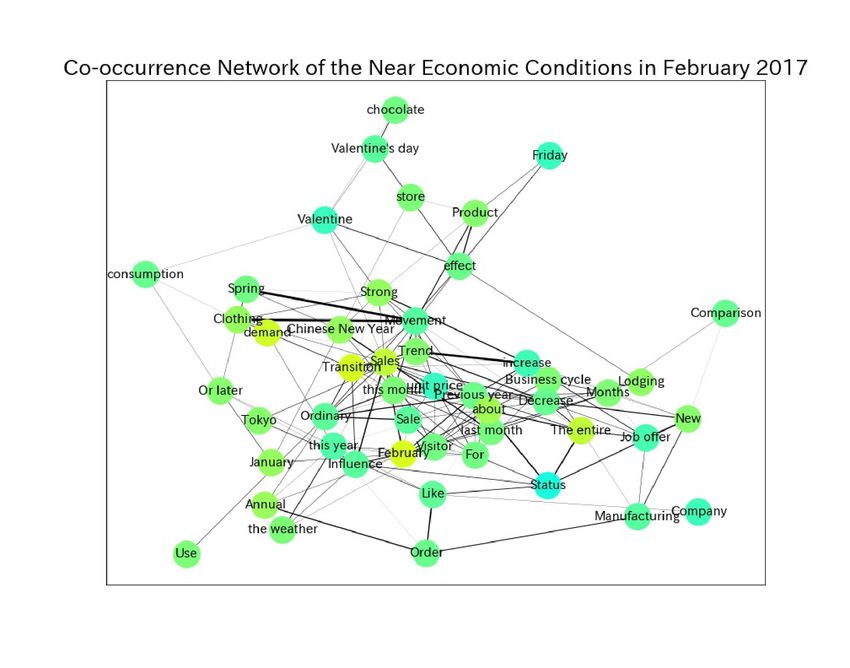
Identifying Different Definitions of Future
                                    in the Assessment of Future Economic Conditions:
                                       Application of PU Learning and Text Mining                                  A P REPRINT

focus on the case-control scenario, in which positive data are obtained separately from unlabeled data, and unlabeled
data are sampled from the entire population. In this study, we construct our algorithm on the basis of subsequent
research known as unbiased PU learning [du Plessis et al., 2015], which minimizes the unbiased estimator of the
classification risk.
After classifying the assessments of future economic conditions into those relating to the near and distant future, we
calculated the averaged ranks for both the near and distant future. As a result, we found that a significant difference
exists between economic conditions relating to these two future periods. This result infers the possibility that people’s
definition of the future differs. This fact is important from the viewpoint of economics. In macroeconomics, a re-
searcher may be interested in the possibility of controlling people’s expectations of the market. Our empirical analysis
reports the fact that assessments of the economic conditions of the distant future were mainly based on economic
fundamentals such as the population and diplomatic relationships.
In the following sections, we describe our problem setting and propose an algorithm that solves the problem. Subse-
quently, we present the results and interpretations of our empirical analysis.

2 Problem Setting
We consider the binary classification of text data. In the following parts, we describe the dataset and classification
problem in detail.

2.1 Economy Watchers Survey

In our analysis, we used the Economy Watchers Survey, a dataset that contains text data and is published by the
Japanese government 1 . The purpose of this survey is to enable the region-by-region economic trends to be grasped
accurately. This survey consists of two assessments, an assessment of current and future economic conditions with the
possibility of entering sentences to motivate the answers by providing reasons. Respondents evaluated the current and
future economic conditions by five ranks, 0, 1, 2, 3, 4. The evaluation 0 means “worse” or “will get worse” compared
with a previous period. The evaluation 4 means “better’ or “will get better” compared with a previous period. The
evaluation 2 represents a neutral position on the assessment of economic conditions.

Interpretation of Assessment of Future Economic Conditions: Assessments of current and future economic con-
ditions provide us with deep insights into economic reality. However, in the questionnaire, there is no clear definition
of the concept of the “future” with respect to future economic conditions. Hence, different people interpret the duration
of “future” in their own way. Whereas one person may imagine the future as just one week, the “future” might be a few
months for another person. Therefore, to analyze the assessments more accurately, we need to classify assessments of
future economic conditions as being either near or distant economic conditions.

2.2 Classification of an Assessment of Future Economic Conditions
To classify future economic conditions into those expected to occur in either the near or distant future, we propose
assuming that current economic conditions share similar sentences with those expected in the near future. Our classi-
fication strategy is to regard current economic conditions as positive data and future economic conditions as unlabeled
data, which potentially consists of positive and negative data. In this paper, positive data are assessments of the current
economic conditions and those expected in the near future, whereas negative data are assessments of economic condi-
tions foreseen to prevail in the distant future. We illustrate the relationship between assessments of current and future
economic conditions of our assumption on Figure 1. We train our classifier only from positive and unlabeled data by
using an algorithm that employs PU learning. Therefore, the goal of this problem is to classify x ∈ X ⊂ Rd into one
of the two classes {−1, +1}, where +1 denotes assessments of current economic conditions and those expected in the
near future (positive data) and −1 denotes economic conditions relating to the distant future (negative data).

2.3 Data Generating Process of Economy Watchers Survey
Let us describe the data generating process of our problem. Let us assume that we have n data points at t-th period
and denote the i-th text data as xi ∈ X ⊂ Rd . If the target of text data xi describes current or near future economic
conditions, we attach a positive label, i.e., yi = +1. If the target of text data xi describes distant future economic
    1
      Particulars   of    the    dataset    are     provided      on     the    homepage    of   the    Japanese     government,
https://www5.cao.go.jp/keizai3/watcher-e/index-e.html. The survey enlists the cooperation of people holding employment
positions that enable them to observe activity closely related to the regional economy. We downloaded the dataset from the page.

                                                               2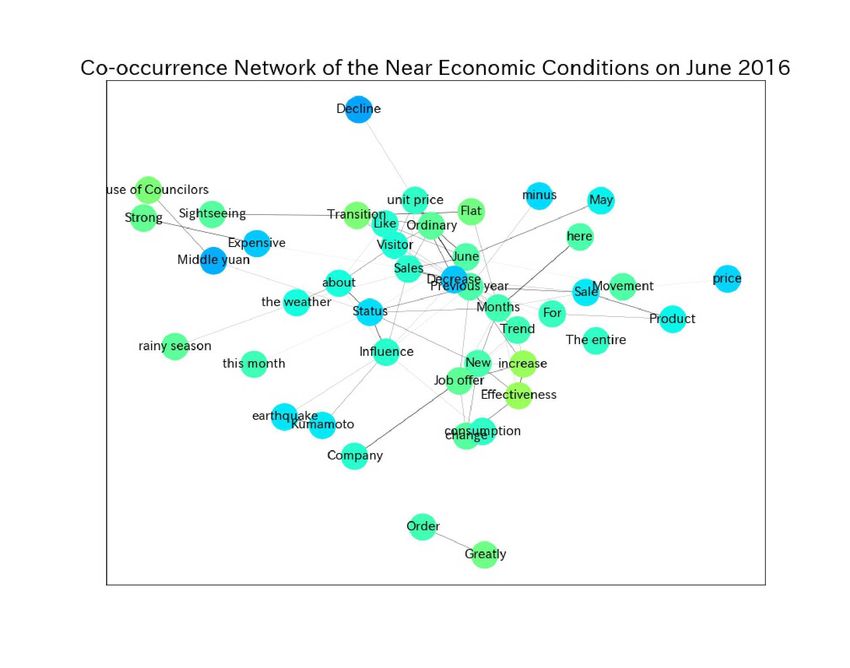
Identifying Different Definitions of Future
                                     in the Assessment of Future Economic Conditions:
                                        Application of PU Learning and Text Mining                           A P REPRINT

                               Figure 1: Our assumed definition of the time structure of assessments.

conditions, we attach a negative label, i.e., yi = −1. However, in the dataset, we can only observe positive data, and
unlabeled data, which includes both positive and negative data. In addition, if the text data xi belongs to a period
t ∈ {1, ..., T }, we denote the fact as zi = t. Using these notations, we define our data generating process as follows:
                                          i.i.d.                              ′   i.i.d.
                                {xi }ni=1 ∼ p(x|y = +1, z = t), {x′i }ni=1 ∼ p(x|z = t),
                           ′
where {xi }ni=1 and {x′i }ni=1 denote the positive and negative data at t-th period, and p(x|z = t) can be decomposed
as
                                   p(x|z = t) =p(y = +1|z = t)p(x|y = +1, z = t)
                                               + p(y = −1|z = t)p(x|y = −1, z = t).

3 Learning from Positive and Unlabeled Data with Time Series Data
To classify data consisting only of positive and unlabeled data, we propose using multi-task PU learning (MTPU). In
this section, we provide details of the proposed algorithm.

3.1 Learning from Positive and Unlabeled Data

Before explaining our model, let us explain the standard setting of PU learning. In PU learning, we consider a
binary classification problem to classify x ∈ X ⊂ Rd into one of the two classes {−1, +1}. We assume that
there exists a joint distribution p(x, y), where y ∈ {−1, +1} is the class label of x. PU learning relies on two
distinct sampling schemes, namely the censoring scenario and case-control scenario [Elkan and Noto, 2008]. The PU
learning framework we use in this study is the case-control scenario, in which we suppose access to a positive dataset
          i.i.d.                                            n′ i.i.d.
{xi }ni=1 ∼ p(x|y = +1) and an unlabeled dataset {x′i }i=1       ∼ p(x). Let ℓ : R × {±1} → R+ be a loss function,
          +
where R is the set of non-negative real values, and F be the set of measurable functions from X to [ǫ, 1 − ǫ], where
ǫ ∈ (0, 1/2) is a small positive value. This constant ǫ is introduced to ensure the following optimization problem is
well-defined based on the result of Kato et al. [2019]. Here, du Plessis et al. [2015] showed that the classification risk
of f ∈ F can be expressed as
                                  RPU (f ) = p(y = +1)Ep [ℓ(f (X), +1)]
                                       − p(y = −1)Ep [ℓ(f (X), −1)] + Eu [ℓ(f (X), −1)],                              (1)
where Ep and Eu are the expectations over p(x|y = +1) and p(x), respectively. The above formulation of PU learning
provides the unbiased risk of the classification problem.

3.2 Multi-Task Non-negative PU learning for Time Series Data

In addition to the standard setting of PU learning, we could take the time structure into account. The Economy
Watcher Survey comprises monthly data, with approximately 2, 600 records for each month. Here, we would need to
use different classifiers for the data included in each month for the following two reasons. First, the model can vary
across periods. Second, we would not be able to include data of the (t + 1)-th period to train a model of data of the
t-th period because the data of the (t + 1)-th period might have information of the data of the t-th period. This made
it necessary to use different models across different periods. For z = t, we denote the model as fz=t and the risk as
follows:
                               RPU (fz=t , z = t) = p(y = +1|z = t)Ep,t [ℓ(f (X), +1)]
                               − p(y = −1|z = t)Ep,t [ℓ(f (X), −1)] + Eu,t [ℓ(f (X), −1)], ,

where Êp,t denotes the averaging operator over positive data, Êu,t denotes averaging over the unlabeled data at the
t-th period. We additionally introduce a model for multi-task learning to PU learning. Multi-task learning is proposed

                                                                 3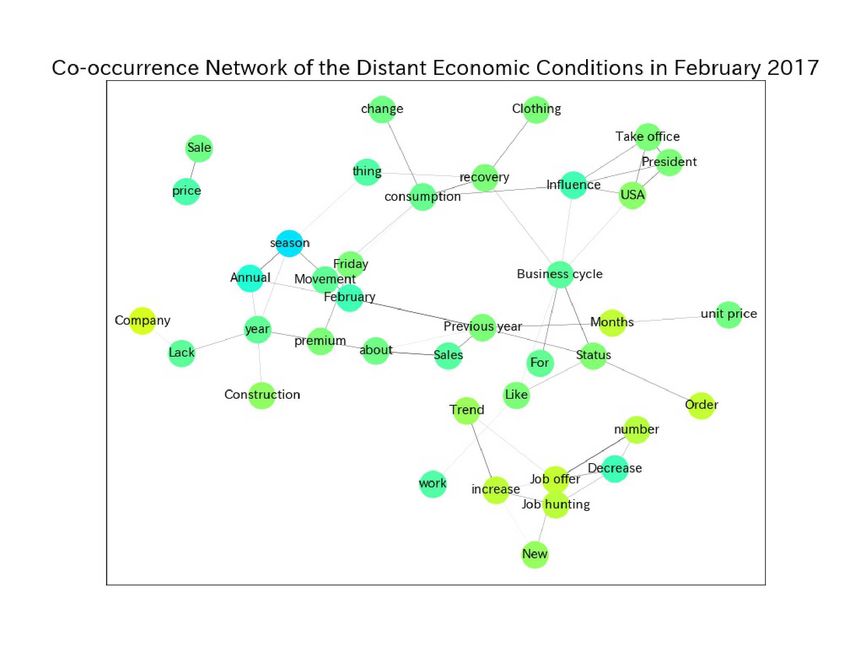
Identifying Different Definitions of Future
                                     in the Assessment of Future Economic Conditions:
                                        Application of PU Learning and Text Mining                                     A P REPRINT

  Figure 2: Neural network model for multi-task learning for PU learning. The models share one shared network with 3 layers.

Figure 3: Plotted assessments of the economic conditions of the near and distant future and those pertaining to the present and
future. The horizontal line at y = 2 is the neutral state. The red vertical lines on the horizontal line represent the results of the
two-sample t-test. The thin and bold red vertical lines represent the 5% and 1% significance levels, respectively.

to train neural networks efficiently by using the common features across different tasks Caruana [1997]. If a common
feature exists across periods, we can train our models more efficiently by sharing the common feature among models
fz=t for t = 1, ..., T through the layers named shared layers, the structure of which is shown in Figure 2. We named
this model MTPU. Details of its structure are provided in the section for empirical experiments.

                                                                 4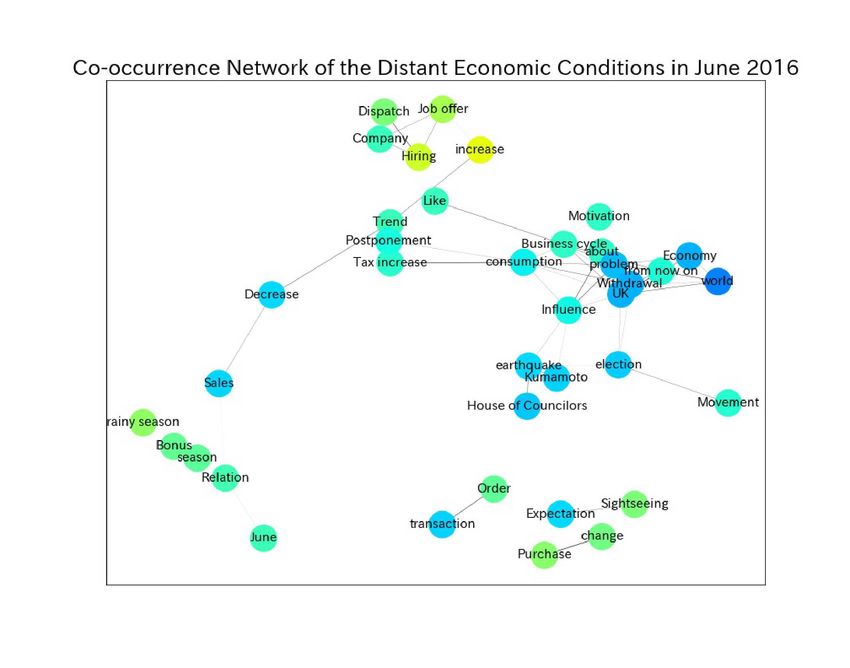
Identifying Different Definitions of Future
                                        in the Assessment of Future Economic Conditions:
                                           Application of PU Learning and Text Mining                                   A P REPRINT

Table 1: Averaged assessments for each period and each type of economic condition. For averaged assessments of near and
distant economic conditions, we conducted a two-sample t-test. A significant difference between the mean values of the assessment
is indicated by superscript ∗ in the table. One ∗ means that the null hypothesis of the two-sample t-test is rejected at the 5%
significance level, whereas two ∗s means that the null hypothesis of the two-sample t-test is rejected at the 1% significance level.

                                                MTPU                Original            PU1             PU2
                                                NF        DF        Current    Future   NF      DF      NF      DF
                                Jan.     2016   1.842**   1.925**   1.996      1.864    1.889   1.857   1.846   1.964
                                Feb.     2016   1.701**   1.720**   1.949      1.780    1.749   1.756   1.733   1.876
                                Mar.     2016   1.768*    1.694*    1.870      1.800    1.805   1.731   1.691   1.804
                                Apr.     2016   1.606**   1.668**   1.822      1.719    1.764   1.625   1.717   1.684
                                May      2016   1.574**   1.736**   1.896      1.683    1.661   1.680   1.582   1.808
                                June     2016   1.588     1.622     1.656      1.632    1.671   1.531   1.588   1.685
                                July     2016   1.721**   1.784**   1.887      1.804    1.797   1.864   1.725   1.860
                                Aug.     2016   1.770**   1.906**   1.904      1.815    1.789   1.863   1.695   1.887
                                Sept.    2016   1.661**   1.860**   1.961      1.781    1.700   1.767   1.650   1.887
                                Oct.     2016   1.789**   1.914**   1.985      1.852    1.785   1.878   1.762   1.906
                                Nov.     2016   2.028     1.865     1.978      1.960    1.936   1.956   1.944   1.948
                                Dec.     2016   2.139**   1.975**   1.974      2.095    2.053   2.074   2.151   1.996
                                Jan.     2017   2.036     1.888     1.997      1.959    1.897   1.932   2.008   2.008
                                Feb.     2017   1.947**   1.992**   2.091      1.969    1.886   2.024   1.886   2.033
                                Mar.     2017   2.181*    1.881*    1.967      2.040    2.122   1.984   2.157   1.968
                                Apr.     2017   2.176     1.963     2.034      2.039    2.049   1.959   2.135   1.955
                                May      2017   2.077*    1.963*    2.080      2.013    1.988   2.041   2.061   2.008
                                June     2017   2.086*    1.939*    2.084      2.022    1.951   1.971   2.016   2.078
                                July     2017   2.162     1.980     2.034      2.055    2.077   2.033   2.016   1.972
                                Aug.     2017   2.024     1.904     2.011      1.975    1.996   1.952   2.008   1.956
                                Sept.    2017   2.041     1.914     2.032      2.005    1.943   1.967   1.931   2.033
                                Oct.     2017   1.909**   2.040**   2.175      1.998    1.822   2.048   1.905   2.139
                                Nov.     2017   2.278     2.045     2.076      2.125    2.173   2.020   2.121   2.061
                                Dec.     2017   2.140**   2.137**   2.067      2.171    2.108   2.068   2.240   2.177
                                Jan.     2018   1.935**   1.951**   2.124      1.957    1.874   2.016   1.935   2.029
                                Feb.     2018   1.831**   1.938**   2.125      1.936    1.778   1.942   1.926   1.950
                                Mar.     2018   2.052*    2.032*    2.005      2.073    2.105   1.943   2.073   1.992
                                Apr.     2018   2.184     1.922     2.071      2.069    2.123   1.984   2.115   2.057
                                May      2018   1.907**   1.837**   2.039      1.900    1.870   1.894   1.878   1.963
                                June     2018   1.860**   1.963**   2.034      1.910    1.848   1.942   1.835   2.021
                                July     2018   1.883**   1.838**   1.965      1.874    1.785   1.887   1.895   1.919
                                Aug.     2018   1.900**   1.988**   2.034      1.913    1.799   1.931   1.956   2.016
                                Sept.    2018   1.735**   1.881**   2.041      1.882    1.861   1.918   1.682   2.000
                                Oct.     2018   1.964**   1.834**   2.006      1.916    1.948   1.785   1.911   1.887
                                Nov.     2018   2.049     1.909     2.033      1.980    1.943   1.930   1.947   1.979
                                Dec.     2018   2.017*    1.862*    1.881      1.951    1.996   1.900   2.017   1.912
                                Jan.     2016   1.780**   1.784**   2.016      1.800    1.748   1.833   1.756   1.833
                                Feb.     2019   1.871**   1.925**   2.014      1.863    1.917   1.837   1.829   1.95
                                Mar.     2019   1.975*    1.856*    1.943      1.879    2.004   1.797   1.895   1.856
                                Apr.     2019   1.852     1.894     1.972      1.916    1.877   1.962   1.797   1.928
                                May      2019   1.845**   1.762**   1.863      1.766    1.853   1.713   1.784   1.758
                                June     2019   1.736**   1.676**   1.868      1.719    1.762   1.718   1.715   1.748

3.3 Sample Approximation of the Unbiased Risk

When we train a classifier, we can naively replace the expectations with the corresponding sample averages. However,
Kiryo et al. [2017] pointed out that the basic form of the unbiased PU learning is ineffective with a deep neural
network because of over-fitting caused by the fact that the risk is not lower bounded. To implement PU learning with
deep neural networks, we applied the non-negative risk proposed by Kiryo et al. [2017] to the empirical risk defined
in (2). For a hypothesis set H, let us define the following risk minimization problem,
                                                          h                           i
                                 fˆz=t = argminfz=t ∈H R    bPU (fz=t , z = t) + R(f ) ,                          (2)

where RbnnPU (fz=t , z = t) is a sample approximation of RPU (fz=t , z = t) with non-negative transformation pro-
posed by Kiryo et al. [2017] and R is a regularization term.

3.4 Class Prior and Selection Bias

The remaining problem is to make a decision regarding the class prior p(y = +1|z = t). The class prior p(y =
+1|z = t) would be different across periods t. Although several algorithms have been proposed to estimate the
class prior [du Plessis and Sugiyama, 2014; Ramaswamy et al., 2016; Jain et al., 2016], the estimation is still known
to be a difficult task. However, we can avoid the problematic estimation in the case of the particular goal we hope to
reach. In our experiments, we assume that the class prior is p(y = +1|z = t) = 0.2 for all periods, t = 1, 2..., T .
This assumption is not realistic because the probability would have different values across the periods. However,
Kato et al. [2018, 2019] showed that the function fz=t is simply linear-proportional to the class prior, i.e., the following

                                                                         5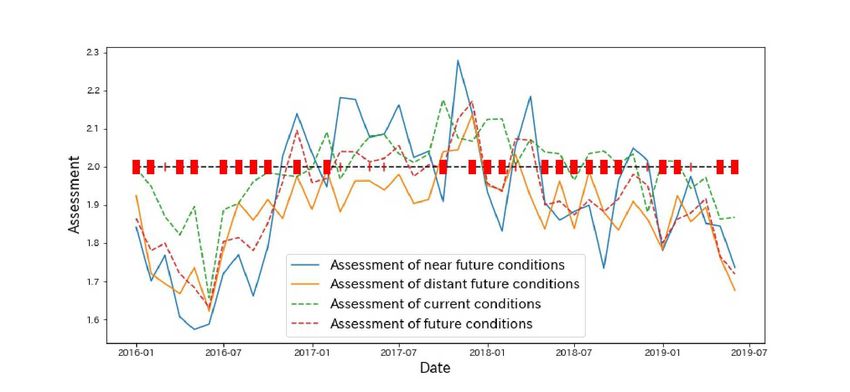
Identifying Different Definitions of Future
in the Assessment of Future Economic Conditions:
Application of PU Learning and Text Mining A P REPRINT
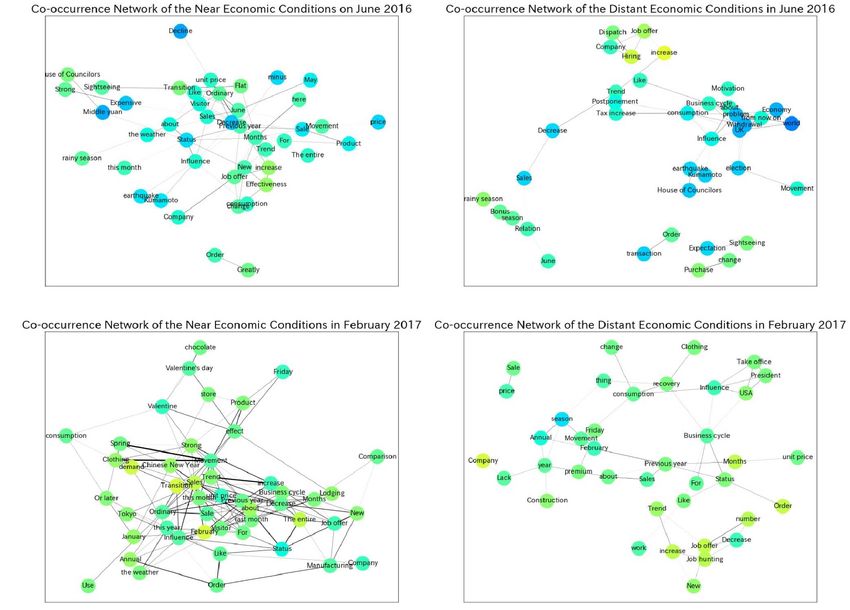
Figure 4: Co-occurrence network of near and distant future economic conditions in June 2016 and February 2017. The lengths of
the edges represent the value of the Jaccard coefficients. Shorter edges indicate a stronger relationship (the value of the Jaccard
coefficients is larger) between the two words. The widths of the edges also represent the value of the Jaccard coefficients between
the two words. The bold edges similarly signify a stronger relationship (the value of the Jaccard coefficients is larger) between the
two words. The color of the nodes relates to the assessment. The yellow-green color denotes that the averaged value is 2, i.e., the
assessment is neutral. The warmer and cooler colors represent positive and negative assessments, respectively.
relationship holds even if we miss-specify the class prior:
p(y = +1|x, z = t) ≤ p(y = +1|x, z = t)
⇔ fz=t (x) ≤ fz=t (x). (3)
Therefore, even when we cannot obtain the exact value of p(y = +1|x, z = t), we can still identify the order of
p(y = +1|x, z = t) with regard to x. Our empirical analysis separates the assessment of future economic conditions
into near and distant future economic conditions based on this property. We classify 1/5 of data from the highest
value of fz=t into assessments of near future economic conditions, and 1/5 of data from the lowest value of fz=t into
assessments of distant future economic conditions. In addition to the robustness to the miss-specified class prior, the
function fz=t also holds the relationship 3 under the selection bias of positive data [Kato et al., 2019] if our assumption
is mild. Thus, our results can reduce the influence of the miss-specified class prior and selection bias.
4 Empirical Analysis
In this section, we report the results of the empirical analysis of data from the Economy Watcher Survey. The survey
was conducted every month starting in 2000. Our analysis only used data from January 2016 to June 2019, i.e., 42
months’ data. Each month includes approximately 2, 600 samples. The reason for the heterogeneity among the data is
the lack of text in respondents’ answers. In total, we had 111,501 samples.
We used Bag-of-Words to represent the documents as 16, 914-dimensional vectors. After vectorizing the text data, we
applied PU learning with the aforementioned MTPU. In addition to the model, we also used the standard model of
PU learning to compare the performance. We used this model of PU learning in two ways. First, we used all samples
to train one model. Second, we prepared one model for each month. Details of the neural networks are provided in
6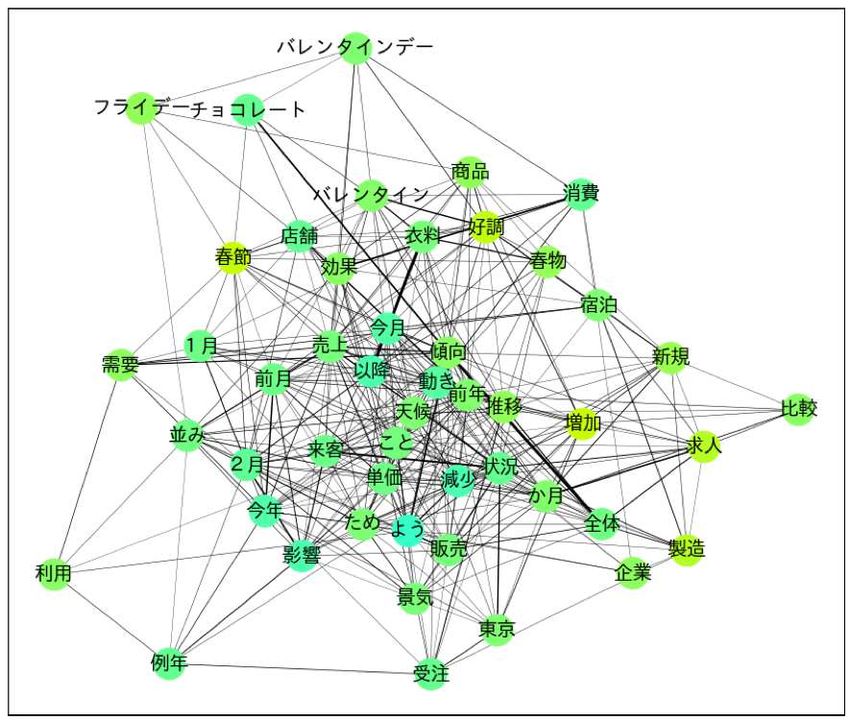
Identifying Different Definitions of Future
                                      in the Assessment of Future Economic Conditions:
                                         Application of PU Learning and Text Mining                                      A P REPRINT

the following section. After training our classifier, we classified the assessment of future economic conditions using
unlabeled data that we used for training.

Neural network model: First, we describe the model we used for MTPU. The model for the shared network was a
3-layer multilayer perceptron (MLP) with ReLU Nair and Hinton [2010] (more specifically, 16914−500−500−500).
The neural network model following the shared network was a 2-layer MLP (more specifically, 500 − 500 − 1) with
ReLU. Next, we describe the model we used for non-negative PU learning. The model for the neural network was a
5-layer MLP (more specifically, 16914 − 500 − 500 − 500 − 500 − 1) with ReLU. We set p(y = +1|z = t) = 0.2 for
all t ∈ {1, 2, ..., 42}. For both methods, we use logistic loss for the loss function ℓ.

4.1 Difference among the Assessments

In this section, we report the extent to which assessments differ across current, future, near future, and distant future
economic conditions.

Averaged Assessments and t-test: We report the averaged assessments of economic conditions in the near and
distant future in comparison with those of the current and future. Assessments of the near and distant future economic
conditions are estimated by MTPU and non-negative PU learning with neural networks. For non-negative PU learning,
we used two models. The first (named PU1) entailed training one model for all samples. The second (named PU2)
involved using different models for the data of different months. The results are presented in Table 1. For each
period, we show the results of the two-sample t-test with unequal variances between the assessments of the economic
conditions of the near and distant future. Values for which the difference between the mean of the assessments is
significant are indicated by superscript ∗ in the table. One ∗ and two ∗s mean that the null hypothesis of the two-
sample t-test is rejected at the 5% and 1% significance levels, respectively.

Visualization as a Time Series: To facilitate a more intuitive understanding of the reported results, we plotted the
averaged assessments in the time series in Figure 3, where the x-axis corresponds to the time series, and the y-axis
corresponds to the value of the assessment. The blue, orange, green, and red lines correspond to assessments of the
economic conditions in the near future, distant future, at the present time, and in the future. The horizontal black
dashed line at y = 2.0 represents the neutral condition in the 5-step evaluations for the economic conditions from 0
(bad) to 4 (good). The vertical red lines perpendicular to the line y = 2.0 indicate that the difference between the
average assessments of the economic conditions in the near and distant future is significant in the two-sample t-test.
The bold vertical lines represent that the null hypothesis of the two-sample t-test is rejected at the 1% significance
level and the other red lines represent that two ∗ means that the null hypothesis of the two-sample t-test is rejected
at the 5% significance level. For example, the assessments of the economic conditions in the near future in 2017 are
significantly higher than those of the distant economic conditions.

4.2 Text Mining

This section presents our analysis of the text based on assessments of the text data. For text mining, we use tf-idf
and the Jaccard coefficient, which are standard techniques of natural language processing. First, we separate the
assessments of the economic conditions in the near and distant future for the month in which the assessments were
published, i.e., we form groups of monthly assessments. Then, we denote a set of the group of assessments as M, and
we apply tf-idf to identify the word that characterizes the document. Then, for the 50 words with the highest tf-idf,
we measure the Jaccard coefficient Manning and Schütze [1999], which measures the similarity between two sets. Let
Mw ∈ M be a set of sentences including the word w. The Jaccard coefficient J(Ma , Mb ) for a word a and a word
b can be expressed as follows:
                                                                      |Ma ∩ Mb |
                                                  J(Ma , Mb ) =                  .                                               (4)
                                                                      |Ma ∪ Mb |

Based on these results, we plotted the co-occurrence networks in Figure 42 . Because of the limitation placed on the
length of the paper, we only show the network of assessments in June 2016 and February 2017. June 2016 is one of
the periods in which the value of assessments greatly changed. Throughout 2017, the economic conditions of the near
future are less than those in the distant future, and February 2016 is one of these periods. Because of the small size of
our graphs, we placed enlarged versions of these graphs in the appendix in both English and Japanese.
   2
       We translated from Japanese to English using an API provided by Google (https://pypi.org/project/googletrans/).

                                                                  7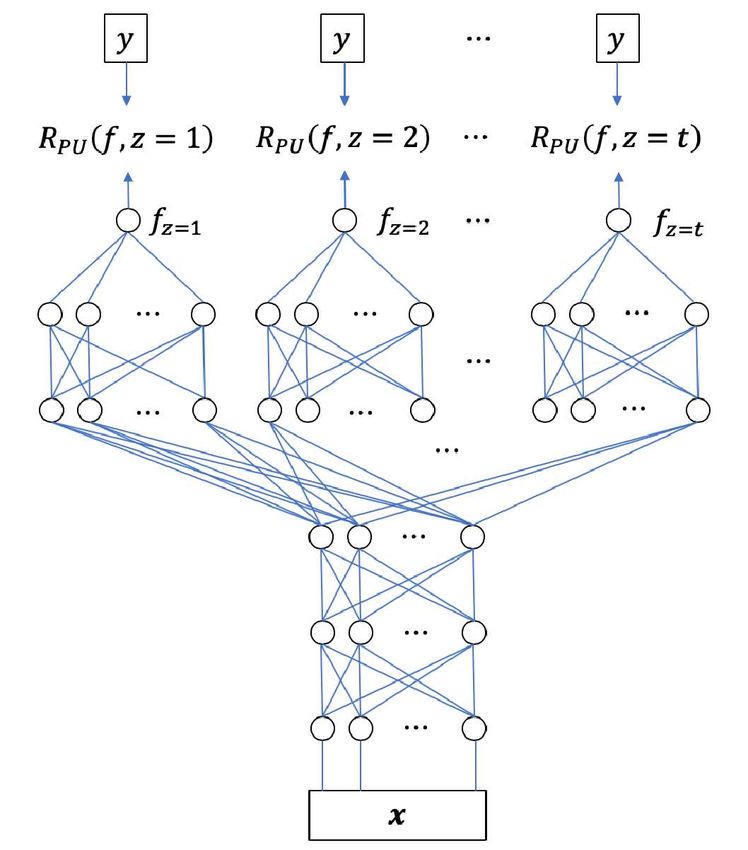
Identifying Different Definitions of Future
                                  in the Assessment of Future Economic Conditions:
                                     Application of PU Learning and Text Mining                               A P REPRINT

4.3 Interpretations

Figure 4 displays words related to economic fundamentals, such as the structure of the labor supply and international
politics. In other words, these results can be interpreted as meaning that assessments of the economic conditions of
the near future represent the economic cycle, whereas assessments of the economic conditions of the distant future
represent the economic trend. For example, the words “U.K.” and “withdrawal” appear, both of which are related to
Brexit among the economic conditions of the distant future, “Business cycle,” and “Trend” in June 2016. The words
“US” and “President” appear in Feb. 2017. On the other hand, the economic conditions of the near future in June
2016 and Feb, 2017 are represented by words that have less relationship with economic fundamentals such as “rainy
season” and “Valentin’s day.” For policymakers, this is an insightful finding because the result infers that they cannot
easily change people’s expectations based on economic fundamentals.

5 Conclusion
In this paper, we proposed a new application of PU learning and text mining to data consisting of financial text.
We developed a new model named MTPU to train neural networks efficiently using data with a time structure. Our
empirical analysis showed the classification result and interpretations based on text mining and economics. The result
is insightful to policymakers because the result infers that people might have a different interpretation of the definition
of the future and may assess the future economic outlook differently based on their interpretations of the future.
Besides, we also found that there are different main reasons between near and distant future economic assessments.

References
Gilles Blanchard, Gyemin Lee, and Clayton Scott. Semi-supervised novelty detection. Journal of Machine Learning
  Research, 11(Nov):2973–3009, 2010.
Rich Caruana. Multitask learning. Machine Learning, 28(1):41–75, Jul 1997.
Marthinus Christoffel du Plessis and Masashi Sugiyama. Class prior estimation from positive and unlabeled data.
 IEICE Transactions on Information and Systems, E97-D(5):1358–1362, 2014.
Marthinus Christoffel du Plessis, Gang. Niu, and Masashi Sugiyama. Convex formulation for learning from positive
 and unlabeled data. In ICML, pages 1386–1394, 2015.
Charles Elkan and Keith Noto. Learning classifiers from only positive and unlabeled data. In ICDM, pages 213–220,
  2008.
Giselle Guzman. Internet search behavior as an economic forecasting tool: The case of inflation expectations. Journal
  of Economic and Social Measurement, 36, 11 2011.
Shantanu Jain, Martha White, Michael W Trosset, and Predrag Radivojac. Nonparametric semi-supervised learning
  of class proportions. In NIPS, 2016.
Masahiro Kato, Liyuan Xu, Gang Niu, and Masashi Sugiyama. Alternate estimation of a classifier and the class-prior
 from positive and unlabeled data. arXiv:1809.05710, 2018.
Masahiro Kato, Takeshi Teshima, and Junya Honda. Learning from positive and unlabeled data with a selection bias.
 In International Conference on Learning Representations, 2019.
Ryuichi Kiryo, Gang Niu, Marthinus Christoffel du Plessis, and Masashi Sugiyama. Positive-unlabeled learning with
  non-negative risk estimator. In NIPS, pages 1675–1685, 2017.
Rajendra Kulkarni, Kingsley Haynes, Roger Stough, and Jean Paelinck. Forecasting housing prices with google
  econometrics. SSRN Electronic Journal, 07 2009.
Christopher D. Manning and Hinrich Schütze. Foundations of Statistical Natural Language Processing. MIT Press,
  Cambridge, MA, USA, 1999.
Vinod Nair and Geoffrey E. Hinton. Rectified linear units improve restricted boltzmann machines. In ICML, 2010.
Minh Nhut Nguyen, Xiaoli-Li Li, and See-Kiong Ng. Positive unlabeled leaning for time series classification. In
 IJCAI, pages 1421–1426, 2011.
Harish Ramaswamy, Clayton Scott, and Ambuj Tewari. Mixture proportion estimation via kernel embeddings of
  distributions. In ICML, pages 2052–2060, 2016.
Paul C. Tetlock, Maytal Saar-tsechansky, and Sofus Macskassy. More than words: Quantifying language to measure
  firms’ fundamentals. Journal of Finance, 63(3):1437–1467, 2008.

                                                            8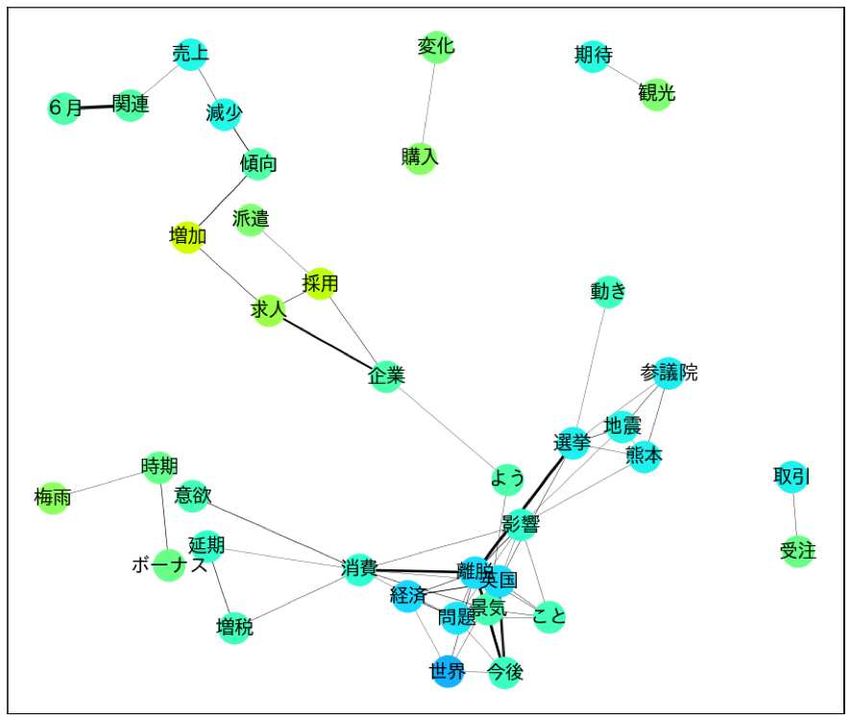
Identifying Different Definitions of Future
                                 in the Assessment of Future Economic Conditions:
                                    Application of PU Learning and Text Mining                           A P REPRINT

Paul C. Tetlock. Giving content to investor sentiment: The role of media in the stock market. The Journal of Finance,
  62(3):1139–1168, 2007.
Gill Ward, Trevor Hastie, Simon Barry, Jane Elith, and John R Leathwick. Presence-only data and the em algorithm.
  Biometrics, 65(2):554–563, 2009.

                                                         9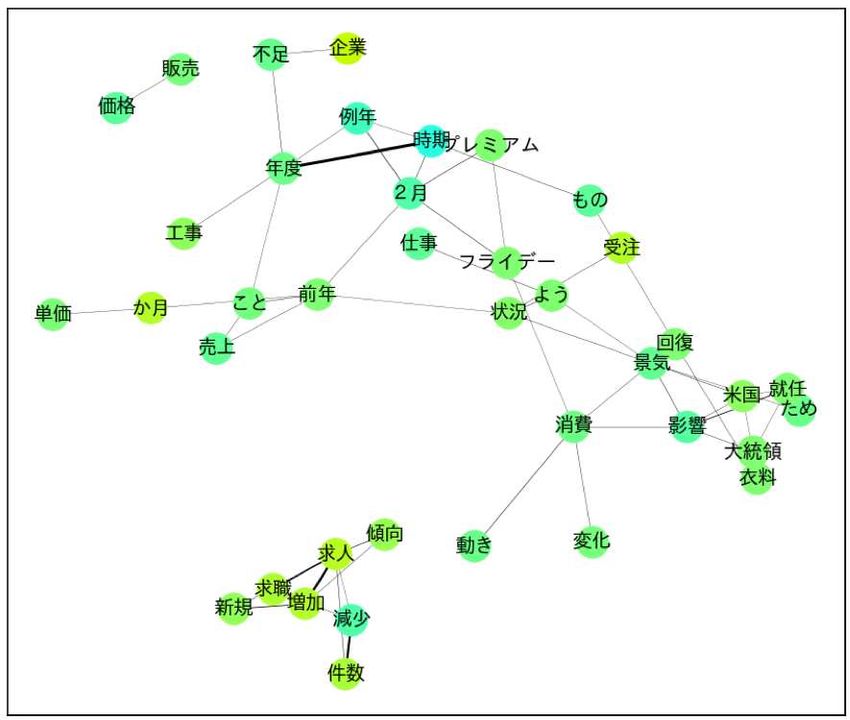
Identifying Different Definitions of Future
                                  in the Assessment of Future Economic Conditions:
                                     Application of PU Learning and Text Mining                             A P REPRINT

A    Graphs of Co-occurrence Network
Because of the length limitation of the paper, we only included reduced-size versions of the graphs in the main body.
Here, we present enlarged versions of Figure 4. The lengths of the edges represent the values of the Jaccard coefficients
with shorter edges indicating a stronger relationship between two words (the Jaccard coefficients have larger values).
The widths of the edges also represent the value of the Jaccard coefficients between two words. The bold edges
similarly indicate a stronger relationship (larger values of the Jaccard coefficients) between the two words. The color
of the nodes represents the averaged value of the assessments of the text in which the word appeared. Yellow-green
denotes that the averaged value is 2, i.e., the assessment is neutral. Warmer and cooler colors represent positive and
negative assessments, respectively.

                                                           10
Identifying Different Definitions of Future
in the Assessment of Future Economic Conditions:
Application of PU Learning and Text Mining A P REPRINT
A.1 Co-occurrence Network of Near Future Economic Conditions in June 2017
11Identifying Different Definitions of Future
in the Assessment of Future Economic Conditions:
Application of PU Learning and Text Mining A P REPRINT
A.2 Co-occurrence Network of Distant Future Economic Conditions in June 2017
12Identifying Different Definitions of Future
in the Assessment of Future Economic Conditions:
Application of PU Learning and Text Mining A P REPRINT
A.3 Co-occurrence Network of Near Future Economic Conditions in February 2017
13Identifying Different Definitions of Future
in the Assessment of Future Economic Conditions:
Application of PU Learning and Text Mining A P REPRINT
A.4 Co-occurrence Network of Distant Future Economic Conditions in February 2017
14You can also read