PYTHON DATA VISUALIZATION - 2019 Tools and Trends - Anaconda
←
→
Page content transcription
If your browser does not render page correctly, please read the page content below
PYTHON DATA
                                VISUALIZATION
                                   2019 Tools and Trends

Python Data Visualization | 1
Introduction
                        Having a myriad of separate
                        Python visualization libraries to
                        choose from is confusing and
                        likely to lead new users down
                        suboptimal paths.
                        After learning one library, it is difficult to re-learn      This eBook is designed to help you
                        others that may be more suitable for later tasks. Is         navigate the Python visualization
                        there hope that Python could tell a simpler story?           landscape. I’ll discuss the packages
                        Can users be steered toward a smaller number                 currently available, how they are linked,
                        of starting points without getting cut off from              evolution of these tools in recent years,
                        important functionality?                                     and where to go from here.

                                                                                               James A. Bednar
                                                                                     Manager, Technical Services
                                                                                               at Anaconda, Inc.
                                                                                  Contributor to Datashader, GeoViews,
                                                                                   HoloViews, Panel, hvPlot, and Bokeh

Python Data Visualization | 2
TABLE OF
                        CONTENTS
                        1. Navigating the Many Libraries                    3. Moving Toward Convergence
                                The Current Landscape                           Image Output
                                Differentiating Factors Between Viz Tools       Big Data
                                InfoVis Libraries Breakdown                     3D in Notebooks
                                                                                Widget/App Support
                        2. What Is Supported In Each Library                    De-facto .plot() API Standard
                                Plot Types                                      What Comes Next
                                Data Size
                                User Interfaces and Publishing              4. Where To Go From Here
                                API Types                                       Visions for the Future
                                Emerging Trends                                 Conclusions and Outlook

Python Data Visualization | 3
CHAPTER 1

                  NAVIGATING THE
                  MANY LIBRARIES

Python Data Visualization | 4
Chapter 1 | Navigating the Many Libraries

       The Current Landscape
       To set the stage, this is Jake
       VanderPlas’s 2017 overview
       of how the many different
       visualization libraries in Python
       relate to each other.
       Here you can see several main groups of libraries, each
       with a different origin, history, and focus.

       SciVis Libraries
       The clearly separable group in orange towards the
       middle-left of the figure is the SciVis libraries, for
       visualizing physically situated data. These tools (VisPy,
       glumpy, GR, Mayavi, ParaView, VTK, and yt) primarily
       build on the 1992 OpenGL graphics standard, delivering
       graphics-intensive visualizations of physical processes
       in three or four dimensions (3D over time), for regular or
       irregularly gridded data.

       These libraries predate HTML5’s support for rich web
       applications, generally focusing on high-performance
       desktop-GUI applications in engineering or scientific
       contexts.

Python Data Visualization | 5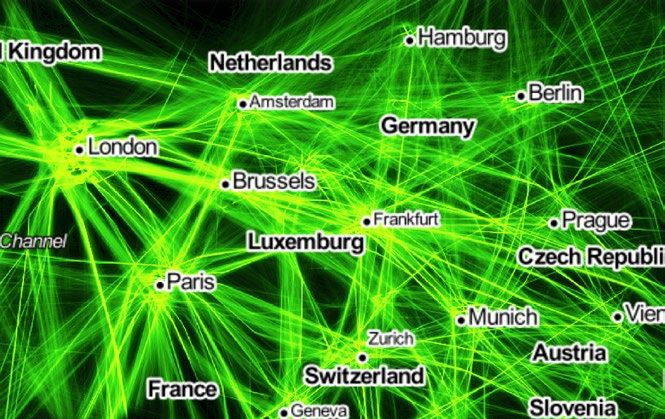
Chapter 1 | Navigating the Many Libraries

                                                                                              The choice of library is
                                                                                               more than a matter of
                                                                                              personal preference or
                                                                                                       convenience.

   Differentiating Factors
   Between InfoVis Tools
   The other libraries nearly all fall into the InfoVis group, focusing       The following breakdown by history and technology
   on visualizations of information in arbitrary spaces, not necessarily      helps explain how we got to the current profusion of
   the 3D physical world. InfoVis libraries use the two dimensions            Python viz packages. It also helps explain why there
                                                                              are such major differences in user-level functionality
   of the printed page or computer screen to make abstract spaces
                                                                              between the various packages—specifically in the
   interpretable, typically with axes and labels. The InfoVis libraries can
                                                                              supported plot types, data sizes, user interfaces, and
   be further broken down into numerous subgroups.
                                                                              API types.

                                                                              These differences make the choice of library more
                                                                              than a matter of personal preference or convenience
                                                                              and very important to understand.

Python Data Visualization | 6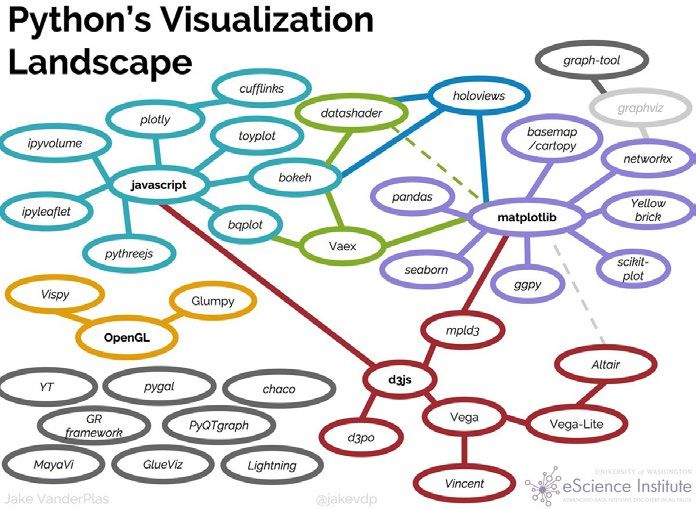
Chapter 1 | Navigating the Many Libraries

InfoVis Libraries Breakdown

      MATPLOTLIB                                                    MATPLOTLIB-BASED                                              JAVASCRIPT

      Released in 2003, one of the oldest                           A variety of tools have built on                              Once HTML5 allowed rich interactivity
      and by far the most popular of the                            Matplotlib’s 2D-plotting capability over                      in browsers, many libraries arose to
      InfoVis libraries with a very extensive                       the years.                                                    provide interactive 2D plots for web
      range of 2D plot types and output                             These libraries either use it as a rendering engine for       pages and in Jupyter notebooks–either
      formats.                                                      a certain type of data or in a certain domain (pandas,        using custom JS (Bokeh, Toyplot) or
                                                                    NetworkX, Cartopy, yt, etc.), or provide a higher-level
      Matplotlib also predated HTML5’s support for rich web         API on top to simplify plot creation (ggplot, plotnine,       primarily wrapping existing JS libraries
                                                                    HoloViews, GeoViews), or extend it with additional types of
      applications, focusing instead on static images for                                                                         like D3 (Plotly, bqplot).
      publication along with interactive figures using desktop-     plots (seaborn, etc.).
      GUI toolkits like Qt and GTK. Matplotlib includes some 3D                                                                   Wrapping existing JS makes it easy to add new plots
      support, but much more limited than the SciVis libraries      WEBGL                                                         created for the large JS market (as for Plotly), while using
      provide.                                                                                                                    custom JS allows defining lower level JS primitives that can
                                                                                                                                  be combined into completely new plot types from within
                                                                    Just as HTML5 did for 2D JavaScript                           Python (as for Bokeh).
      JSON                                                          plotting, the WebGL standard made 3D
                                                                    interactivity in the browser and Jupyter
      As JavaScript libraries have matured                                                                                        OTHER
                                                                    feasible, leading to 3D in-browser
      like D3, their functionality has                              plotting built on three.js (pythreejs,                        Many other libraries, beyond those
      been captured in declarative JSON                             ipyvolume), vtk.js (itk-jupyter-widgets),                     listed in Jake’s diagram, provide other
      specifications (Vega, Vega-Lite).                             or regl (Plotly).                                             complementary functionality (e.g.,
      JSON specs make it simple to generate JavaScript plots
                                                                    None of these newer web-based 3D approaches capture           graphviz for visualizing networks, or
      from any language, now including Python (via Altair and
      previously via vincent). Having the full plot specification
                                                                    the breadth and depth of the desktop SciVis 3D libraries,     veusz for GUI-based InfoVis plotting).
                                                                    but they do allow full integration with Jupyter notebooks
      available as portable JSON allows integration across many
                                                                    and easy sharing and remote usage via the web. Even
      types of tools.
                                                                    though WebGL tools have some applications in common
                                                                    with the SciVis tools, they are probably more closely tied
                                                                    with the other InfoVis tools.
Python Data Visualization | 7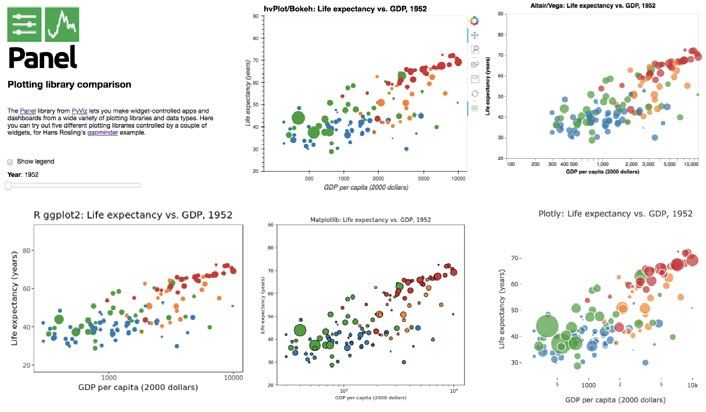
CHAPTER 2

   WHAT IS SUPPORTED
    IN EACH LIBRARY

Python Data Visualization | 8
Chapter 2 | What is Supported in Each Library

Plot Types
The most basic plot types are shared between multiple libraries, and others are only available in certain libraries.
Given the number of libraries, plot types, and their changes over time, it is very difficult to precisely characterize what’s supported in each library. It is
usually clear what the focus is if you look at the example galleries for each library.

   Statistical plots (scatter plots, lines, areas, bars, histograms)               Geographical data
   Covered well by nearly all InfoVis libraries, but are the main focus for        Matplotlib (with Cartopy), GeoViews, ipyleaflet, and Plotly.
   Seaborn, bqplot, Altair, ggplot2, and plotnine.

   Multidimensional arrays (regular grids, rectangular meshes)                    Networks/graphs
   Well supported by Bokeh, Datashader, HoloViews, Matplotlib, Plotly,            NetworkX, Plotly, Bokeh, HoloViews, and Datashader.
   plus most of the SciVis libraries.

     Irregular 2D meshes (triangular grids)                                       3D (meshes, scatter, etc.)
     Well supported by the SciVis libraries plus Matplotlib, Bokeh,               Fully supported by the SciVis libraries, plus some support in Plotly,
     Datashader, and HoloViews.                                                   Matplotlib, HoloViews, and ipyvolume.
Python Data Visualization | 9
Chapter 2 | What is Supported in Each Library

         Data Size
         The architecture and underlying technology for each library
         determine the data sizes supported, and thus whether the
         library is appropriate for large images, movies, multidimensional
         arrays, long time series, meshes, or other sizeable datasets.

            SciVis                                                             WebGL
            Can generally handle very large gridded datasets (gigabytes or     JavaScript libraries using an HTML Canvas are limited to
            larger) using compiled data libraries and native GUI apps.         hundreds of thousands of points for good performance, but
                                                                               WebGL allows up to millions (via ipyvolume, Plotly, and in some
            Matplotlib-based
                                                                               cases Bokeh).
            Can typically handle hundreds of thousands of points with
            reasonable performance, or more in some special cases              Server-side rendering
            (depending on backend).                                            External InfoVis server-side rendering from Datashader or Vaex
                                                                               allows billions, trillions, or more data points in web browsers.
            JSON
                                                                               This is done by converting arbitrarily large distributed or out-of-
            Without special handling, JSON’s text-based encoding of data
                                                                               core datasets into fixed-sized images that embed in the client
            limits JSON-based specifications to a few thousand points up
                                                                               browser.
            to a few hundred thousand points, due to the file sizes and text
            processing required.

            JavaScript
            ipywidgets, Bokeh, and Plotly all use JSON but augment it with
            additional binary-data transport mechanisms so that they can
            handle hundreds of thousands to millions of data points in some
            cases.

Python Data Visualization | 10
Chapter 2 | What is Supported in Each Library
User Interfaces and Publishing
The various libraries differ dramatically in the ways that plots
can be used.
Static Images
Most libraries can now operate headlessly to create static
Jupyter Notebooks
images, at least in PNG and typically in smooth vector formats
Most InfoVis libraries now support interactive use in Jupyter
like SVG or PDF.
Notebooks, with JavaScript-based plots backed by Python.
Native GUI App The ipywidgets-based projects provide tighter integration
The SciVis libraries plus Matplotlib, Veusz, and Vaex can create with Jupyter, while some other approaches give only limited
OS-specific GUI windows, which provide high performance interactivity in Jupyter (e.g., HoloViews when used with
support for large data sets and integration with other desktop Matplotlib rather than Bokeh).
applications. However, they are tied to a specific OS and usually
Standalone Web-Based Dashboards and Apps
need to run locally rather than over the web. In some cases,
Plotly graphs can be used in separate deployable apps with
JavaScript-based tools can also be embedded in native apps by
Dash, while Bokeh, HoloViews, and GeoViews can be deployed
embedding a web browser.
using Bokeh Server. Most of the other InfoVis libraries can be
Export to Interactive HTML deployed as dashboards using the new Panel library, including
Most of the JavaScript and JSON libraries can be operated in Matplotlib, Altair, Plotly, Datashader, hvPlot, Seaborn, plotnine,
a serverless mode that generates interactive plots (zooming, and yt, with varying levels of interactivity.
panning, etc.) that can be emailed or posted on web servers
Despite their web-based interactivity, the ipywidgets-based
without Python available.
libraries (ipyleaflet, pythreejs, ipyvolume, bqplot) are difficult to
deploy as public-facing apps because the Jupyter server allows
arbitrary code execution. See the defunct Jupyter dashboards
project, flask-ipywidgets, and voila for potential solutions.
Python Data Visualization | 11Chapter 2 | What is Supported in Each Library
InfoVis API types
Because using these low-level APIs can be tedious and error prone
The various InfoVis libraries offer a huge range of programming
for day-to-day analysis and data exploration, alternative APIs are
interfaces suitable for different types of users and ways of creating
also available that capture common patterns and tasks at a higher
visualizations. These APIs differ by orders of magnitude in how
level. Libraries generally offer a single higher-level API, except that
much code is needed to do common tasks, compared to how much
there are now several alternative APIs for Matplotlib and Bokeh.
control they provide to the user for handling uncommon tasks.
For most users, the following higher-level APIs may make more
The lowest-level APIs allow very detailed control for composing
suitable starting points.
primitives into new types of plots:
Imperative .plot() APIs
Declarative Graphics APIs
When working with high-level data structures like Pandas
The Grammar of Graphics-based (GoG) libraries like ggplot,
dataframes or Xarray DataArrays, it is convenient to be able to
plotnine, as well as those more loosely based on GoG like Altair,
request a plot directly from the data structure using .plot(). By
bqplot, and Bokeh, all provide a natural way to compose low-
default, the resulting Matplotlib-rendered plots are static (non-
level graphical primitives like axes and glyphs to create a full
interactive) and difficult to compose into larger figures, but add-on
plot. Composing such elements is straightforward for simple
packages are also now available using the same API to provide
plots, but highly verbose for complex plots that contain many
interactive and in some cases fully compositional plots (via hvPlot)
such glyphs in different combinations.
for a wide range of data structures and underlying plotting libraries.
Object-oriented Matplotlib API Thus users who learn the basic Pandas/Xarray .plot() API can make
Matplotlib’s main API allows full control and compositionality, but use of a broad range of libraries and capability with a relatively
it is complex and verbose even for some common tasks that are small investment.
simple with other APIs, such as creating subfigures.
Other high-level APIs
JS APIs Seaborn, Chartify, Plotly Express, and similar libraries provide a
Because many web-based Python libraries are built on an concise interface for constructing complex plots that fit certain
existing JavaScript framework like D3, it is always possible to stereotyped patterns, automating the selection of graphical
drop down to the JS API for unusual tasks, but doing so is not elements for common situations like faceting and statistical
usually straightforward. aggregation.
Python Data Visualization | 12Chapter 2 | What is Supported in Each Library
Declarative Data-Centric APIs workflows, and desire for customization compared
With each of the above types of APIs, generating a to the ease of obtaining basic results. With any
visualization is a one-way process of adding low- of the APIs, some tasks will become easier, and
level graphical elements (as in declarative or object- others more difficult, so it is vitally important to
oriented graphics APIs) or specifying additional choose an appropriate API.
options to .plot(), culminating in a completed
visualization. With a data-centric API like HoloViews
or GeoViews, creating a particular visualization Emerging Trends
consists of annotating data with additional semantic
information, such as declaring dimensions and As you can see, there is a
units. Subsequent views and aggregations or slices huge range of visualization
of the data will then make use of this information,
making it possible to make all the data visualizable functionality available for
in any combination, rather than specifically building
Python, with a diversity in
individual plots as needed.
approach and focus that is
Stateful Pyplot API
Matplotlib’s basic interface allows Matlab-style reflected in the large number
imperative commands manipulating global state,
which is concise for some simple cases. However,
of libraries available.
it is difficult for users to reason about how the Differences between approaches remain
state changes, and the lack of compositionality important and have far-reaching implications,
in the API makes it largely limited to a specific
meaning that users need to take these
set of supported configurations, so Pyplot and
differences into consideration before investing
similar approaches for other libraries are not
recommended for new users; use one of the other
deeply into any particular approach.
high-level approaches above instead! Luckily, trends toward convergence are helping
In practice, the various different APIs are suitable make it less crucial which libraries users select.
for different technical backgrounds, preferred
Python Data Visualization | 13CHAPTER 3
MOVING TOWARD
CONVERGENCE
Python Data Visualization | 14Chapter 3 | Moving Toward Convergence
Image Output
JavaScript InfoVis libraries, like Bokeh and Plotly, have
traditionally focused on interactive use in a web browser,
and provided static output mainly as pixelated screenshots
(and only with an internet connection in the case
of Plotly).
Libraries Becoming More Similar
Bokeh now supports PNG and SVG output, and Plotly
An important theme that emerged from SciPy 2018 was
graphs can be exported to PNG, SVG, or PDF via orca.
convergence–Python libraries becoming more similar in Both libraries can now be used for publication-quality plots
capability as they mature over time and share ideas and like the Matplotlib derivatives produce.
approaches.
These trends of convergence have started to erase
Users no longer have to decide
previous clear distinctions between each library. This is
great for users, though it makes blanket recommendations at the outset of a project whether
more difficult. they might scalable-resolution
As before, we will separate the SciVis projects (typically static outputs eventually.
3D plotting situated in real-world space) from InfoVis
projects (typically 2D plotting situated on the page or
screen surface with arbitrary coordinate axes).
Python Data Visualization | 15Chapter 3 | Moving Toward Convergence
3D in Notebooks
OpenGL-based 3D libraries previously worked only in native
GUI contexts, but Mayavi now supports limited use inside
of Jupyter notebooks, making it possible to capture and
disseminate workflows more readily, and complementing
the browser-only 3D from ipyvolume and Plotly.
Widget/app support
Previous mechanisms for providing widgets and support for
apps and dashboards were often specific to Python plotting
libraries, such as Dash for Plotly and Bokeh Server/Bokeh
Widgets for Bokeh. A wide variety of plotting libraries now
support usage with ipywidgets, making it feasible to switch
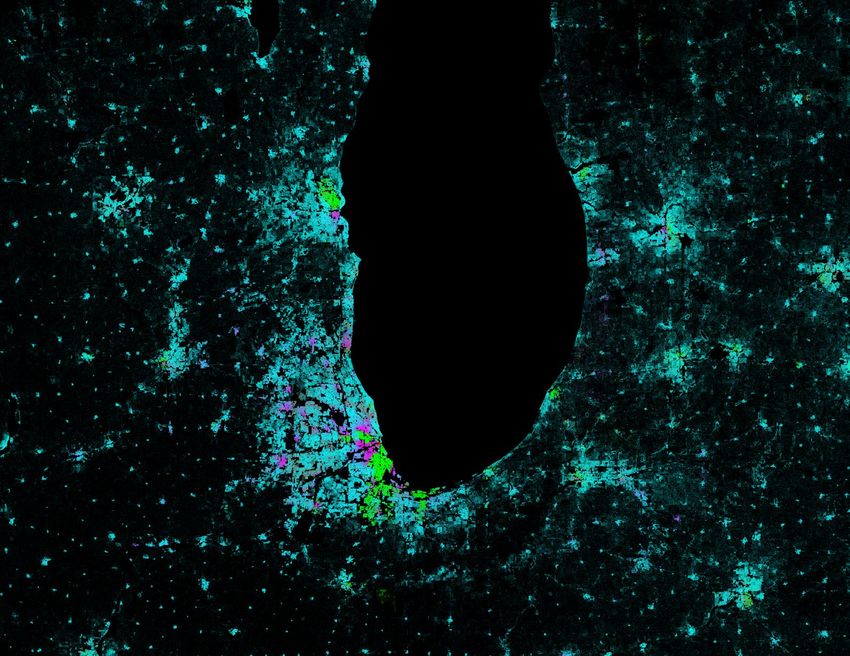
Big Data
between them or combine them as needed for particular
Extremely large InfoVis data (more than 100,000 or a million notebook-related tasks relatively easily. This broad base of
points) previously required external Python or C data- support makes the particular choice of ipywidgets-based
rendering programs like Datashader and Vaex. library less crucial at the outset of a project. Many different
plotting libraries can also be used with the new Panel app/
Server-side data rendering has now been integrated into
widget library, either using the ipywidgets-style “interact”
several JavaScript-based libraries so that they can be
interface or as separate objects, either in a Jupyter
used interactively (using Vaex in bqplot and Datashader in
notebook or in a separate server (see example app in
HoloViews, GeoViews, hvPlot, and now Plotly).
the image above, which combines plots from four Python
Today, there are many alternatives for working with very large libraries along with R’s ggplot2).
InfoVis datasets in Python.
Python Data Visualization | 16Chapter 3 | Moving Toward Convergence
De-facto .plot() API standard
The pandas plotting API has emerged as a de-facto standard
for 2D charts, with a similar set of calls on Pandas dataframes
now able to generate plots using Matplotlib (natively in
Pandas), Vega-lite (via pdvega), Plotly (via cufflinks), or Bokeh
(via hvPlot). hvPlot also provides the same plotting API for
many other data libraries (xarray, GeoPandas, Dask, Intake, What Comes Next?
Streamz), making it possible for users in many cases to
learn one set of plotting commands using Pandas and then These trends towards convergence mean that users
apply them to a wide range of libraries to get either static or who commit to a particular Python viz library or type of
interactive plots. library are no longer entirely cut off from other types of
functionality.
Although the different histories and starting points outlined
in chapter one remain important to understand, the
implications are no longer quite as severe as in previous
years.
Having so many separate Python visualization libraries to
choose from can still be confusing to new users, which is
why I and other representatives of the Python visualization
community, spent time at SciPy 2018 discussing ways to
simplify these libraries and steer users to a smaller number
of starting points.
Python Data Visualization | 17CHAPTER 4
WHERE TO GO
FROM HERE
Python Data Visualization | 18Chapter 4 | Where To Go From Here
Perhaps we do not need
to achieve centralization
of the libraries, but rather
centralization of educational
resources that can guide users
to the appropriate libraries.
Visions for the Future
Anaconda’s PyViz.org initiative takes the step to make data A representative of Matplotlib suggested
visualization in Python easier to use and learn. HoloViews and that the large number of existing libraries
GeoViews now provide a single and concise high-level declarative was not necessarily an issue.
data API for using multiple InfoVis libraries (currently including
He believes it’s entirely appropriate for
Bokeh, Matplotlib, Datashader, Cartopy, and Plotly), and Panel
Matplotlib to be the core workhorse for a
now provides a unified dashboarding approach across dozens of
large number of libraries building on it.
libraries and data formats.
Not everything needs to be in Matplotlib
If other InfoVis library authors support the high-level HoloViews
itself, and Matplotlib makes an excellent
API, then users could easily switch between backends depending
basis on which to build other, higher-level
on their immediate needs (e.g., for selecting different plot types),
2D static-plotting functionality, due to
without having to learn a completely new library’s API. Even
its comprehensive support for low-level
without such support, Panel already allows plots to be combined
primitives and output formats.
from any of the above sources, into the same figure or dashboard.
Python Data Visualization | 19Chapter 4 | Where To Go From Here
Others argue that scientific appropriate libraries. I agreed that if people were willing
to work on this, PyViz.org would be a natural place to host
professionals have indeed been such resources.
completely overwhelmed by the sheer
A representative of ipyvolume, bqplot, and ipywidgets
number of plotting possibilities in argued that ipywidgets (aka Jupyter widgets) is already
Python, yet the benefit of having so emerging as a de facto standard, supported by a wide
many different libraries available is range of libraries (ipyvolume, ipyleaflet, pythreejs, bqplot,
and Plotly) that can now be mixed and matched as needed
recognized.
to provide interactive apps and plots in a Jupyter notebook.
It seems unlikely that all the separate package authors
A representative of Mayavi emphasized that mature
would be able to coordinate closely, but perhaps the SciPy
SciVis tools like VTK, Mayavi, or ParaView cover important
community could do better at educating users on the data
functionality not addressed by InfoVis-focused libraries,
models, assumptions, and outputs of each of the main
offering advanced and specialized visualization techniques
visualization tools.
for large and complex finite-element-method simulations.
For example, perhaps we do not need to achieve
These tools support visualization of a variety of data
centralization of the libraries, but rather centralization
structures and the “long tail” of scientific research beyond
of educational resources that can guide users to the
just the initial visualization itself.
Python Data Visualization | 20Conclusions and Outlook
Conclusions and In particular, users need to consider the type
of plots they want to use, the data sizes they
Outlook work with, how they want to interact with and
publish their plots, and what type of API they
want (focusing on high-level capabilities or
Overall, it is clear that each of the main low-level control).
libraries represents a vibrant community
Library authors can help make these
of users and developers using different differences clear for each project, steering
techniques to achieve different goals. users towards appropriate solutions for their
It is both unlikely and perhaps undesirable for the libraries to needs. Hopefully this eBook helps clarify the
consolidate significantly because that would remove major situation a bit!
differences in functionality. Any unification efforts would likely be
distressing to some users of libraries not included in those efforts.
In any case, we can clearly do better at educating the public about
how each library and initiative is most useful, steering users more
efficiently into effective solutions for their various goals.
Python Data Visualization | 21READY TO SCALE DATA SCIENCE
WITHIN YOUR ORGANIZATION?
Anaconda Enterprise enables data science teams to
build, train, test, and deploy AI and machine learning
models at speed and scale. Simultaneously, the
platform fulfills IT governance and security needs by
securing open source supply chains with a private
package repository.
Learn more at anaconda.com/enterprise.
Python Data Visualization | 22You can also read