Controlling Cell-Free Gene Expression Behavior by Tuning Membrane Transport Properties - bioRxiv
←
→
Page content transcription
If your browser does not render page correctly, please read the page content below
bioRxiv preprint first posted online Apr. 10, 2019; doi: http://dx.doi.org/10.1101/604454. The copyright holder for this preprint
(which was not peer-reviewed) is the author/funder, who has granted bioRxiv a license to display the preprint in perpetuity.
                              It is made available under a CC-BY-NC-ND 4.0 International license.

   Controlling Cell-Free Gene Expression Behavior by Tuning Membrane
   Transport Properties

   Patrick M. Caveney1,2, Rosemary M. Dabbs2, William T. McClintic1,2, S. Elizabeth Norred1,2, C.
   Patrick Collier1, Michael L. Simpson*,1,2

   1
     Center for Nanophase Materials Sciences, Oak Ridge National Laboratory, Oak Ridge, TN,
   37831, USA
   2
     Bredesen Center for Interdisciplinary Research and Graduate Education, University of
   Tennessee Knoxville/Oak Ridge National Laboratory, Knoxville, TN, 37996, USA
   *
     Corresponding author: SimpsonML1@ornl.gov

                                                Summary
   Controlled transport of molecules across boundaries for energy exchange, sensing, and
   communication is an essential step toward cell-like synthetic systems. This communication
   between the gene expression compartment and the external environment requires reaction
   chambers that are permeable to molecular species that influence expression. In lipid vesicle
   reaction chambers, species that support expression – from small ions to amino acids – may
   diffuse across membranes and amplify protein production. However, vesicle-to-vesicle variation
   in membrane permeability may lead to low total expression and high variability in this
   expression. We demonstrate a simple optical treatment method that greatly reduces the
   variability in membrane permeability. When transport across the membrane was essential for
   expression, this optical treatment increased mean expression level by ~6-fold and reduced
   expression variability by nearly two orders of magnitude. These results demonstrate membrane
   engineering may enable essential steps toward cell-like synthetic systems. The experimental
   platform described here provides a means of understanding controlled transport motifs in
   individual cells and groups of cells working cooperatively through cell-to-cell molecular
   signaling.

                                             Keywords
   Cell-free, vesicles, gene expression, membrane permeability, synthetic biology

                                              Introduction
   Cell-free gene expression using purified components or cell extracts has become a viable
   platform for synthetic biology (Karim and Jewett, 2016; Moore et al., 2018; Pardee et al., 2016;
   Shin and Noireaux, 2012; Siegal-Gaskins et al., 2014). A broader goal is the realization of more
   complex cell-free systems (Perez et al., 2016) that may approach cell-like capabilities (Scott et
   al., 2016). However, these aspirations are stymied by highly variable behavior from identical
   cell-free expression reactors, especially at cell-relevant reactor volumes (Boreyko et al., 2017;
   Caveney et al., 2016; Hansen et al., 2015; Norred et al., 2018). Even in simple, single-gene,
   expression experiments, protein concentrations may vary by more than an order of magnitude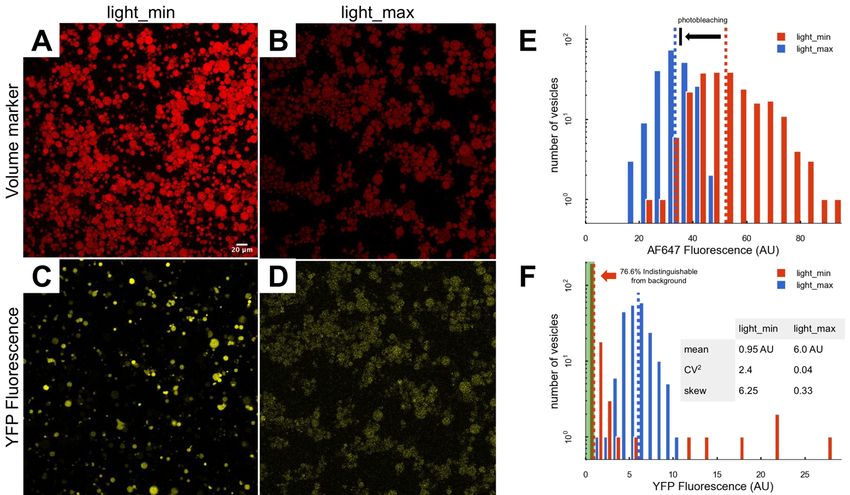
bioRxiv preprint first posted online Apr. 10, 2019; doi: http://dx.doi.org/10.1101/604454. The copyright holder for this preprint
(which was not peer-reviewed) is the author/funder, who has granted bioRxiv a license to display the preprint in perpetuity.
                              It is made available under a CC-BY-NC-ND 4.0 International license.

   across a population of identically constructed reaction chambers (Nourian and Danelon, 2013;
   Saito et al., 2009). For cell-free expression confined in lipid vesicles, a portion of this variability
   may emerge from vesicle-to-vesicle variation in the permeability of the membrane (Nishimura et
   al., 2014a) to molecular species (ions, amino acids, etc.) that may lead to variability in protein
   production. A small fraction (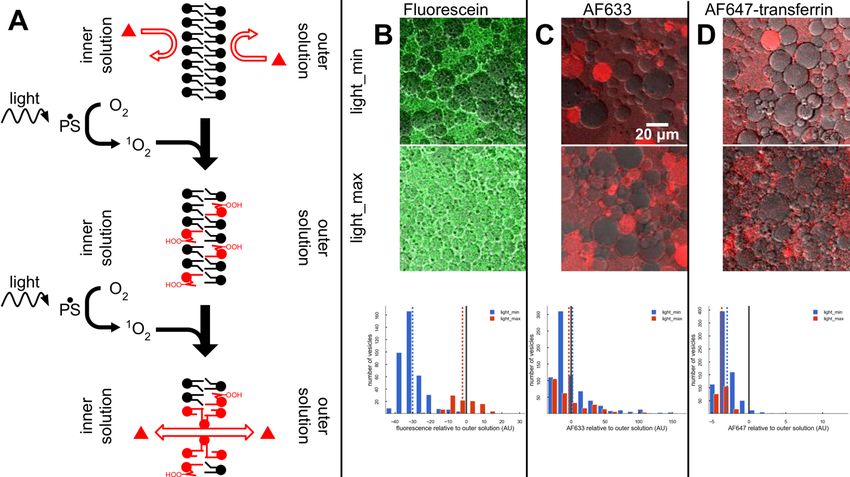
bioRxiv preprint first posted online Apr. 10, 2019; doi: http://dx.doi.org/10.1101/604454. The copyright holder for this preprint
(which was not peer-reviewed) is the author/funder, who has granted bioRxiv a license to display the preprint in perpetuity.
                              It is made available under a CC-BY-NC-ND 4.0 International license.

   these ROIs (Figure 2B, bottom) provided a random sample of the amount of protein expressed
   in individual vesicles across the population (Figure 2B, bottom inset). Imaging was performed
   using a Zeiss, LSM 710 confocal laser scanning microscope. Z-stacks of 20 slices were taken
   during every imaging event for 2 hours. Each slice was 512 x 512 pixels (pixels measured 0.81
   µm x 0.81 µm). Vesicles were illuminated with 405 nm, 488 nm, and 633 nm lasers. Laser
   powers were 6.5 mW, 6.1 mW, and 1.67 mW, respectively. During each image capture, each
   pixel was illuminated by all three lasers for 37.9 µs.

   We performed experiments using two different imaging protocols. In the first protocol (light_min;
   Figure 2A, bottom left), we imaged the vesicles only once at t=2 hours after expression activity
   ceased (Caveney et al., 2016; Karig et al., 2013; Sun et al., 2013). In this protocol, the vesicles
   were exposed to a minimal amount of light, much as they would be in a flow cytometry
   experiment. In the second protocol (light_max; Figure 2A, bottom right), we imaged each vesicle
   once every 3 minutes for the entire 2-hour duration of the experiment. Note that in the light_min
   protocol there was minimal photobleaching, but that both YFP and AF647 experienced
   significant photobleaching (18.0% and 32.5%, respectively; SI Figure 1) due to the constant
   illumination in the light_max protocol.

   The AF647 images from both protocols show numerous intact vesicles with distinct boarders
   (Figure 3A and B). Aside from the photobleaching inherent to light_max (Figure 3C), the
   distribution of AF647 across the population of vesicles was similar for both protocols (SI Figure
   2). In contrast, the expression behavior, as indicated by the YFP images (Figure 3D and E), was
   vastly different for the two protocols. The light-min protocol resulted in a skewed population
   (adjusted Fisher–Pearson standardized moment coefficient (g1) =6.25) where most vesicles
   (76.6%) had little or no YFP expression, 20.3% made some detectable amount of YFP, and a
   small number (3.1%) made much more YFP than the average. These results are consistent with
   previous reports of POPC vesicles made by the emulsion-transfer method expressing protein
   with the PURE system (Nishimura et al., 2014a) that show ~10% of vesicles are naturally
   permeable to small molecules necessary for gene expression. Conversely, the majority of
   vesicles are impermeable and may produce little or no protein if they are lacking essential
   expression resources encapsulated within the vesicle (Nishimura et al., 2014a).

   In contrast to the light_min protocol, the light_max protocol resulted in all vesicles expressing
   measurable levels of YFP with a much less skewed distribution (g1=0.33). As a result, even
   without correcting for photobleaching (Figure 3F; SI Figure 1), the mean YFP expression level
   was ~6-fold greater for light_max compared to light_min. Further, the light_max protocol
   decreased expression variability (measured using CV2 = YFP variance/YFP mean) by nearly
   two orders of magnitude (CV2=2.4 (light_min); CV2=0.04 (light_max)).

   The clear implication of the experimental results is that the light_max protocol permeabilized the
   vesicle membranes. Although not previously reported in gene expression studies, such
   photosensitive permeabilization of lipid membranes has been reported in other contexts (Figure
   4A). These reports (Itri et al., 2014; Mertins et al., 2014) indicate that light exposure creates
   short-lived, excited molecules that react with molecular oxygen to produce singlet oxygen.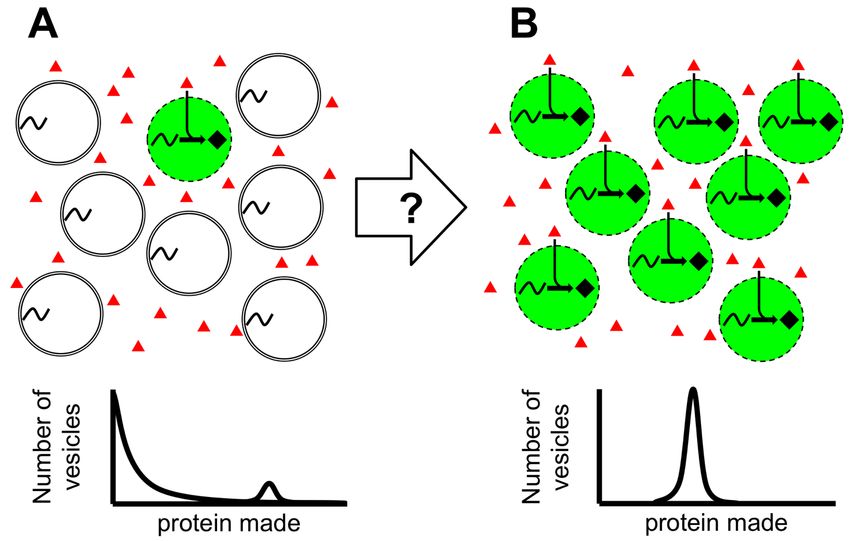
bioRxiv preprint first posted online Apr. 10, 2019; doi: http://dx.doi.org/10.1101/604454. The copyright holder for this preprint
(which was not peer-reviewed) is the author/funder, who has granted bioRxiv a license to display the preprint in perpetuity.
                              It is made available under a CC-BY-NC-ND 4.0 International license.

   Singlet oxygen reacts with double bonds found on lipid tails, resulting in a shift of the double
   bond by one carbon, and most importantly, generates lipid hydroperoxide species. The double
   bond shift increases the area per lipid molecule (Mertins et al., 2014), decreases membrane
   thickness (Itri et al., 2014) and the elastic moduli (Weber et al., 2014), but does not increase
   membrane permeability (Weber et al., 2014). However, the hydroperoxides produce alcohols
   and ketones on lipid tails, as well as truncated lipid tails capped with an aldehyde that form
   stable pores in the membrane (De Rosa et al., 2018) (Figure 4A, bottom).

   While the gene expression data suggest optically-induced pore formation in the vesicle
   membranes, they also imply molecular selectivity in transport through the pores. Most
   importantly, significant levels of YFP were only seen in vesicles. Furthermore, the drop in
   AF647-transferrin fluorescence in the light_max protocol was consistent with photobleaching
   and showed no evidence of significant loss due to leakage from the vesicles. Accordingly, it
   seems that the larger expression resource molecules (plasmid DNA, ribosomes, RNAPs) and
   the proteins (transferrin, YFP) remained encapsulated, while smaller molecular species (small
   ions, nucleotides, amino acids) were able to cross the membrane.

   To characterize the size-electivity of the membrane pores, we imaged populations of vesicles
   with various fluorophores in the outer solution (Figure 4B-D). The fluorophores were chosen to
   have molecular weights larger than small ions, but in the range of amino acids (~110 Da),
   nucleotides (~650 Da), and proteins (>20 kDa). Fluorescein (~332 Da), AF633 (~1.2 kDa), and
   AF647 conjugated to transferrin (~80 kDa) were added to the outer solution and the vesicles
   were imaged with both the light_min (Figure 4B-D, top) and light_max (Figure 4B-D, middle)
   protocols. The light_min protocol resulted in little or no diffusion of Fluorescein or AF647 into
   vesicles (Figure 4B and D, bottom). In contrast, light_max imaging enabled diffusion of
   Fluorescein across the membrane, equalizing the vesicle and outer solution concentrations
   (Figure 4B, bottom). Light_max imaging resulted in little change in the populations of AF633 and
   AF647-transferrin within the vesicles. However, even with very little optical exposure, AF633
   was found in many vesicles, often at concentrations greater than the outer solution (Figure 4C,
   bottom). This initial loading of fluorophore into vesicles was seen from the very first image in the
   light_max protocol and was unrelated to optical exposure. It seems likely that AF633 may
   become encapsulated in some vesicles during the vesicle synthesis process. These fluorophore
   transport and the gene expression results indicate that the light_max protocol enabled the
   transport of small ions, nucleotides, and amino acids, yet kept RNAP (~99 kDa), proteins,
   ribosomes (~2.7 MDa), and plasmid DNA (~1.58 MDa) encapsulated within the vesicles.

   Synthetic biology approaches to controlling gene expression level and variability have focused
   on genetic circuits. However, the central feature of cell-free synthetic biology is the ability to
   define the environment by manipulating confinement volume (Caveney et al., 2016), degree of
   macromolecular crowding (Norred et al., 2018), and the composition of cell extract (Garcia et
   al., 2018). Likewise, the results reported here show that membrane engineering is a viable
   approach to control expression behavior and demonstrate a simple optical treatment that greatly
   diminishes the variability in the permeability of POPC vesicle membranes. Looking ahead, such
   controlled transport across membranes is essential for energy exchange, sensing, and
bioRxiv preprint first posted online Apr. 10, 2019; doi: http://dx.doi.org/10.1101/604454. The copyright holder for this preprint
(which was not peer-reviewed) is the author/funder, who has granted bioRxiv a license to display the preprint in perpetuity.
It is made available under a CC-BY-NC-ND 4.0 International license.
communication that lie at the heart of many complex cellular functions. The intriguing implication
of this study is that membrane engineering may enable cell-like synthetic systems with similar
levels of functionality. As a result, such cell-free experimental platforms provide a viable path
both for the realization of cell-free synthetic biology applications and for understanding these
controlled transport motifs in individual cells and groups of cells working cooperatively through
cell-to-cell molecular signaling.
Methods
Vesicle Preparation
Vesicle were made using the oil-in-water emulsion-transfer method (Noireaux and Libchaber,
2004; Pautot et al., 2003) (Figure 2A). This method encapsulated a protein expressing inner
solution in vesicles separated from an osmotically balanced outer solution. The inner solution
was prepared using 10 µL Solution A and 7.5 µL Solution B of the PURExpress In Vitro Protein
Synthesis Kit from New England Biolabs; 5 µL of sucrose solution (1 M); 0.25 µL of Transferrin-
AlexaFluor 647; 0.125 µL of RNAsin (40 U/µL); 0.418 µL (1.67 nM) of YFP encoding pEToppYB
plasmid (Nishimura et al., 2014b) (200 ng; 478.2 ng/µL stock); and nuclease-free water to bring
the total volume of solution to 30 µL. The inner solution was vortexed in 330 µL of paraffin oil
containing 30 mg of 1-palmitoyl-2-oleoyl-glycero-3-phosphocholine (POPC) for 60 seconds. The
resulting emulsion was layered above the outer solution and centrifuged at 13,000 g for 20
minutes at room temperature. The low concentration inner reactions were made by diluting
Solution A and Solution B with nuclease-free water to 1/3 their standard concentrations.
Outer Solution Preparation
The outer solution for vesicles was mixed from frozen stocks before each experiment. 1.5 µL
Amino acid solution, 11.3 µL of ATP (100 mM), 7.5 µL of GTP (100 mM), 0.75 µL of CTP (500
mM), 0.75 µL of UTP (500 mM), 1.8 µL of spermidine (250 mM), 3.75 µL of creatine phosphate
(1 M), 4.5 µL of Dithiothreitol (100 mM), 0.75 µL of Folinic Acid (0.5 M), 24 µL of potassium
glutamate (3.5 M), 11.3 µL of magnesium acetate (0.5 M), 30 µL of HEPES (1 M), 60 µL of
glucose (1 M), and 141.8 µL of autoclaved type I pure water for a total volume of 300 µL.
Vesicle Imaging
The pellet of vesicles was collected with 100 µL of the outer solution and pipetted onto a no. 1.5
glass bottom petri dish. The lid was placed on the petri dish to minimize airflow and evaporation
of the 100 µL outer solution and vesicle drop. Two different protocols were followed for imaging:
light_max and light_min. For the light_max protocol the petri dish was placed on a Zeiss
LSM710 confocal scanning microscope with an incubation chamber warmed to 37°C and
imaged every 3 minutes in a z-stack with a 20x air objective. Vesicles were imaged with three
lasers: a 405 nm, 6.5 mW laser; YFP was excited with a 488 nm, 6.1 mW laser and fluorescent
emission was collected from 515-584 nm; and AF647 was excited with a 633 nm, 1.67 mW
laser and fluorescent emission was collected from 638-756 nm. Z-stacks were made of 20 slices
at 1 µm intervals, and the aperture for each slice was 1.00 Airy Units (open enough to allow
~1.5 µm depth of light). The time the vesicles sat on the microscope before imaging was
minimized (less than 15 minutes), allowing for imaging for most of the duration of proteinbioRxiv preprint first posted online Apr. 10, 2019; doi: http://dx.doi.org/10.1101/604454. The copyright holder for this preprint
(which was not peer-reviewed) is the author/funder, who has granted bioRxiv a license to display the preprint in perpetuity.
It is made available under a CC-BY-NC-ND 4.0 International license.
expression. For the light_min protocol, the petri dish with vesicles was placed in a dark
incubator at 37°C for 2 hours. It was then imaged once on the confocal microscope with the
same settings as the light_max protocol.
Data Acquisition and Analysis
Average fluorescent intensity and diameter were measured with the FIJI TrackMate (Tinevez et
al., 2017) (v3.8.0) plugin. TrackMate found spots with an estimated blob diameter of 10 µm
using the Laplacian of Gaussian detector. Spots that were found with an estimated diameter 19 µm, or contrast 5µm between frames, or tracked forbioRxiv preprint first posted online Apr. 10, 2019; doi: http://dx.doi.org/10.1101/604454. The copyright holder for this preprint
(which was not peer-reviewed) is the author/funder, who has granted bioRxiv a license to display the preprint in perpetuity.
It is made available under a CC-BY-NC-ND 4.0 International license.
References
Bacellar, I.O., Oliveira, M.C., Dantas, L.S., Costa, E.B., Junqueira, H.C., Martins, W.K.,
Durantini, A.M., Cosa, G., Di Mascio, P., and Wainwright, M. (2018). Photosensitized membrane
permeabilization requires contact-dependent reactions between photosensitizer and lipids. J.
Am. Chem. Soc. 140, 9606–9615.
Boreyko, J., Caveney, P., Norred, S.L., Chin, C., Retterer, S.T., Simpson, M.L., and Collier, C.P.
(2017). Synthetic Biology in Aqueous Compartments at the Micro-and Nanoscale. MRS Adv. 2,
2427–2433.
Caveney, P.M., Norred, S.E., Chin, C.W., Boreyko, J.B., Razooky, B.S., Retterer, S.T., Collier,
C.P., and Simpson, M.L. (2016). Resource Sharing Controls Gene Expression Bursting. ACS
Synth. Biol.
De Rosa, R., Spinozzi, F., and Itri, R. (2018). Hydroperoxide and carboxyl groups preferential
location in oxidized biomembranes experimentally determined by small angle X-ray scattering:
Implications in membrane structure. Biochim. Biophys. Acta BBA-Biomembr. 1860, 2299–2307.
Garcia, D.C., Mohr, B.P., Dovgan, J.T., Hurst, G.B., Standaert, R.F., and Doktycz, M.J. (2018).
Elucidating the potential of crude cell extracts for producing pyruvate from glucose. Synth. Biol.
3, ysy006.
Hansen, M.M., Meijer, L.H., Spruijt, E., Maas, R.J., Rosquelles, M.V., Groen, J., Heus, H.A., and
Huck, W.T. (2015). Macromolecular crowding creates heterogeneous environments of gene
expression in picolitre droplets. Nat. Nanotechnol.
Itri, R., Junqueira, H.C., Mertins, O., and Baptista, M.S. (2014). Membrane changes under
oxidative stress: the impact of oxidized lipids. Biophys. Rev. 6, 47–61.
Karig, D.K., Jung, S.-Y., Srijanto, B., Collier, C.P., and Simpson, M.L. (2013). Probing cell-free
gene expression noise in femtoliter volumes. ACS Synth. Biol. 2, 497–505.
Karim, A.S., and Jewett, M.C. (2016). A cell-free framework for rapid biosynthetic pathway
prototyping and enzyme discovery. Metab. Eng. 36, 116–126.
Massiot, J., Rosilio, V., and Makky, A. (2019). Photo-triggerable liposomal drug delivery
systems: from simple porphyrin insertion in the lipid bilayer towards supramolecular assemblies
of lipid–porphyrin conjugates. J. Mater. Chem. B.
Mertins, O., Bacellar, I.O., Thalmann, F., Marques, C.M., Baptista, M.S., and Itri, R. (2014).
Physical damage on giant vesicles membrane as a result of methylene blue photoirradiation.
Biophys. J. 106, 162–171.
Moore, S.J., MacDonald, J.T., Wienecke, S., Ishwarbhai, A., Tsipa, A., Aw, R., Kylilis, N., Bell,
D.J., McClymont, D.W., and Jensen, K. (2018). Rapid acquisition and model-based analysis of
cell-free transcription–translation reactions from nonmodel bacteria. Proc. Natl. Acad. Sci.
201715806.
Nishimura, K., Matsuura, T., Sunami, T., Fujii, S., Nishimura, K., Suzuki, H., and Yomo, T.
(2014a). Identification of giant unilamellar vesicles with permeability to small charged molecules.
RSC Adv. 4, 35224–35232.bioRxiv preprint first posted online Apr. 10, 2019; doi: http://dx.doi.org/10.1101/604454. The copyright holder for this preprint
(which was not peer-reviewed) is the author/funder, who has granted bioRxiv a license to display the preprint in perpetuity.
It is made available under a CC-BY-NC-ND 4.0 International license.
Nishimura, K., Tsuru, S., Suzuki, H., and Yomo, T. (2014b). Stochasticity in gene expression in
a cell-sized compartment. ACS Synth. Biol. 4, 566–576.
Noireaux, V., and Libchaber, A. (2004). A vesicle bioreactor as a step toward an artificial cell
assembly. Proc. Natl. Acad. Sci. U. S. A. 101, 17669–17674.
Norred, S.E., Caveney, P.M., Chauhan, G., Collier, L.K., Collier, C.P., Abel, S.M., and Simpson,
M.L. (2018). Macromolecular Crowding Induces Spatial Correlations That Control Gene
Expression Bursting Patterns. ACS Synth. Biol.
Nourian, Z., and Danelon, C. (2013). Linking genotype and phenotype in protein synthesizing
liposomes with external supply of resources. ACS Synth. Biol. 2, 186–193.
Pardee, K., Green, A.A., Takahashi, M.K., Braff, D., Lambert, G., Lee, J.W., Ferrante, T., Ma,
D., Donghia, N., and Fan, M. (2016). Rapid, low-cost detection of Zika virus using
programmable biomolecular components. Cell 165, 1255–1266.
Pautot, S., Frisken, B.J., and Weitz, D.A. (2003). Production of unilamellar vesicles using an
inverted emulsion. Langmuir 19, 2870–2879.
Perez, J.G., Stark, J.C., and Jewett, M.C. (2016). Cell-free synthetic biology: engineering
beyond the cell. Cold Spring Harb. Perspect. Biol. 8, a023853.
Rokitskaya, T.I., Firsov, A.M., Kotova, E.A., and Antonenko, Y.N. (2015). Photodynamic
inactivation of gramicidin channels in bilayer lipid membranes: Protective efficacy of singlet
oxygen quenchers depends on photosensitizer location. Biochem. Mosc. 80, 745–751.
Saito, H., Kato, Y., Le Berre, M., Yamada, A., Inoue, T., Yosikawa, K., and Baigl, D. (2009).
Time-Resolved Tracking of a Minimum Gene Expression System Reconstituted in Giant
Liposomes. ChemBioChem 10, 1640–1643.
Scott, A., Noga, M.J., de Graaf, P., Westerlaken, I., Yildirim, E., and Danelon, C. (2016). Cell-
free phospholipid biosynthesis by gene-encoded enzymes reconstituted in liposomes. PloS One
11, e0163058.
Shin, J., and Noireaux, V. (2012). An E. coli cell-free expression toolbox: application to synthetic
gene circuits and artificial cells. ACS Synth. Biol. 1, 29–41.
Siegal-Gaskins, D., Tuza, Z.A., Kim, J., Noireaux, V., and Murray, R.M. (2014). Gene circuit
performance characterization and resource usage in a cell-free “breadboard.” ACS Synth. Biol.
3, 416–425.
Sun, Z.Z., Hayes, C.A., Shin, J., Caschera, F., Murray, R.M., and Noireaux, V. (2013). Protocols
for implementing an Escherichia coli based TX-TL cell-free expression system for synthetic
biology. J. Vis. Exp. JoVE.
Tinevez, J.-Y., Perry, N., Schindelin, J., Hoopes, G.M., Reynolds, G.D., Laplantine, E.,
Bednarek, S.Y., Shorte, S.L., and Eliceiri, K.W. (2017). TrackMate: An open and extensible
platform for single-particle tracking. Methods 115, 80–90.bioRxiv preprint first posted online Apr. 10, 2019; doi: http://dx.doi.org/10.1101/604454. The copyright holder for this preprint
(which was not peer-reviewed) is the author/funder, who has granted bioRxiv a license to display the preprint in perpetuity.
It is made available under a CC-BY-NC-ND 4.0 International license.
Weber, G., Charitat, T., Baptista, M.S., Uchoa, A.F., Pavani, C., Junqueira, H.C., Guo, Y.,
Baulin, V.A., Itri, R., and Marques, C.M. (2014). Lipid oxidation induces structural changes in
biomimetic membranes. Soft Matter 10, 4241–4247.bioRxiv preprint first posted online Apr. 10, 2019; doi: http://dx.doi.org/10.1101/604454. The copyright holder for this preprint
(which was not peer-reviewed) is the author/funder, who has granted bioRxiv a license to display the preprint in perpetuity.
It is made available under a CC-BY-NC-ND 4.0 International license.
Figure 1. Engineering membranes for uniform protein production. (A) (Top) A population of
vesicles where only a few vesicles are permeable to resources essential for expression (red
triangles) in the outer solution and thus able to make protein (black diamonds and green
background). (Bottom) The result is a highly skewed protein population distribution where most
vesicles make no protein and a few make large amounts of protein. (B) A process to make more
vesicles permeable to protein expression resources (Top) would result in a more uniform protein
population distribution (Bottom).bioRxiv preprint first posted online Apr. 10, 2019; doi: http://dx.doi.org/10.1101/604454. The copyright holder for this preprint
(which was not peer-reviewed) is the author/funder, who has granted bioRxiv a license to display the preprint in perpetuity.
It is made available under a CC-BY-NC-ND 4.0 International license.
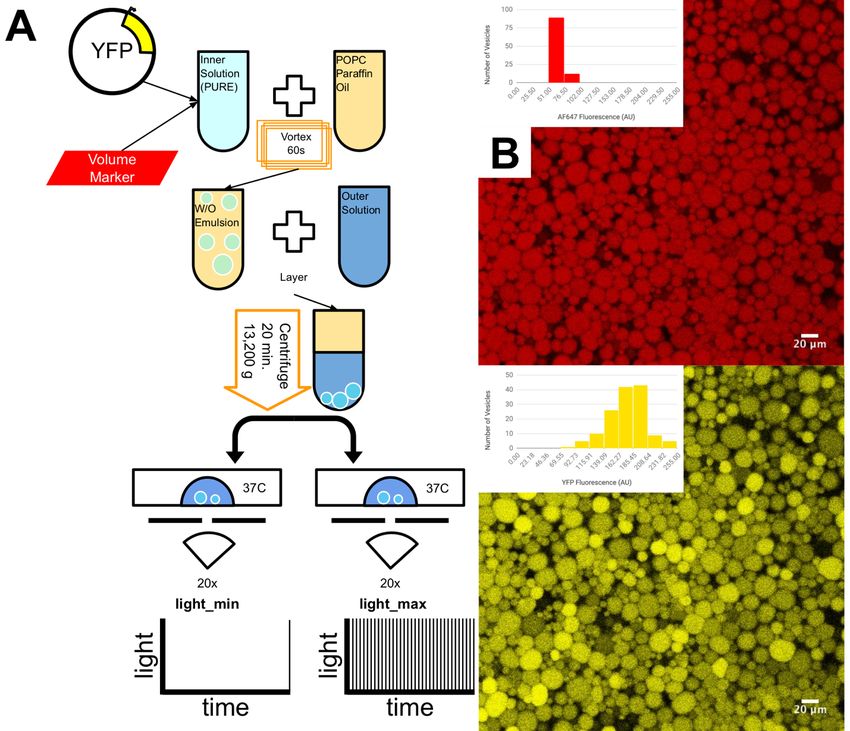
Figure 2. Vesicle production and imaging protocol. (A) Vesicle production via the emulsion-
transfer method. YFP expressing plasmid and a fluorescent volume marker (AF647) were
encapsulated in lipid vesicles. The vesicles were imaged on a confocal microscope using either
a minimal light exposure (bottom left) or maximal light exposure (bottom right) protocol. (B)
Images of YFP and AF647 fluorescence after 2 hours of gene expression for a control
experiment where membrane transport was not required for robust expression. Insets show the
distributions of fluorescent intensities.bioRxiv preprint first posted online Apr. 10, 2019; doi: http://dx.doi.org/10.1101/604454. The copyright holder for this preprint
(which was not peer-reviewed) is the author/funder, who has granted bioRxiv a license to display the preprint in perpetuity.
It is made available under a CC-BY-NC-ND 4.0 International license.
Figure 3. Effects of the light_min and light_max protocols on gene expression behavior.
The t=2 hour image of AF647 using (A) light_min and (B) light_max protocols. (C) The t=2 hour
distributions of AF647 fluorescence for light_min (red) and light_max (blue) protocols. The
dashed vertical lines indicate the means of the two distributions. The arrow shows the expected
shift in the mean due to photobleaching in the light_max protocol. The t=2 hour image of YFP
using the (D) light_min and (E) light_max protocols. (F) The t=2 hour distributions of YFP for
light_min (red) and light_max (blue) protocols. The dashed vertical lines indicate the means of
the two distributions.bioRxiv preprint first posted online Apr. 10, 2019; doi: http://dx.doi.org/10.1101/604454. The copyright holder for this preprint
(which was not peer-reviewed) is the author/funder, who has granted bioRxiv a license to display the preprint in perpetuity.
It is made available under a CC-BY-NC-ND 4.0 International license.
Figure 4. Permeabilization of POPC membranes (A) Light exposure excites photosensitive
species which produce singlet oxygen that reacts with the unsaturated tails of POPC to form
alcohol and ketone groups, leading to permeabilization of the membrane (De Rosa et al., 2018).
(B-D) Transport of fluorophores from outer solution into the vesicles after 2 hours of light_min
(top) or light_max (middle) imaging protocol for (B) Fluorescein, (C) AF633, and (D) AF647. The
light_max protocol enables Fluorescein transport into the vesicles (B, bottom), but has little
effect on AF633 (C, bottom) or AF647 (D, bottom) transport into vesicles. In (B-D, bottom) the
dashed vertical lines indicate the means of the populations. The solid black vertical lines
indicate concentration of fluorophore in the outer solution.You can also read