COMET - Aug 12, 2021 - COMET documentation
←
→
Page content transcription
If your browser does not render page correctly, please read the page content below
COMET

Aug 12, 2021
Contents

1   Direct Installation                                                                                                                                                                                      3

2   Installing via a Virtual Environment (Recommended)                                                                                                                                                        5

3   Usage                                                                                                                                                                                                    7

4   Troubleshooting                                                                                                                                                                                          9

5   User Manual                                                                                                                                                                                              11
    5.1 Background . . . . .     .   .   .   .   .   .   .   .   .   .   .   .   .   .   .   .   .   .   .   .   .   .   .   .   .   .   .   .   .   .   .   .   .   .   .   .   .   .   .   .   .   .   .   11
    5.2 Details of operation     .   .   .   .   .   .   .   .   .   .   .   .   .   .   .   .   .   .   .   .   .   .   .   .   .   .   .   .   .   .   .   .   .   .   .   .   .   .   .   .   .   .   .   12
    5.3 Input formatting . .     .   .   .   .   .   .   .   .   .   .   .   .   .   .   .   .   .   .   .   .   .   .   .   .   .   .   .   .   .   .   .   .   .   .   .   .   .   .   .   .   .   .   .   16
    5.4 Output . . . . . . .     .   .   .   .   .   .   .   .   .   .   .   .   .   .   .   .   .   .   .   .   .   .   .   .   .   .   .   .   .   .   .   .   .   .   .   .   .   .   .   .   .   .   .   18

6   API reference                                                                                                                                                                                            25
    6.1 hgmd.__main__ . . . . . . . . . . . . . . . . . . . . . . . . . . . . . . . . . . . . . . . . . . . . .                                                                                              25
    6.2 hgmd.hgmd . . . . . . . . . . . . . . . . . . . . . . . . . . . . . . . . . . . . . . . . . . . . . . . .                                                                                            25
    6.3 hgmd.visualize . . . . . . . . . . . . . . . . . . . . . . . . . . . . . . . . . . . . . . . . . . . . . .                                                                                           25

                                                                                                                                                                                                              i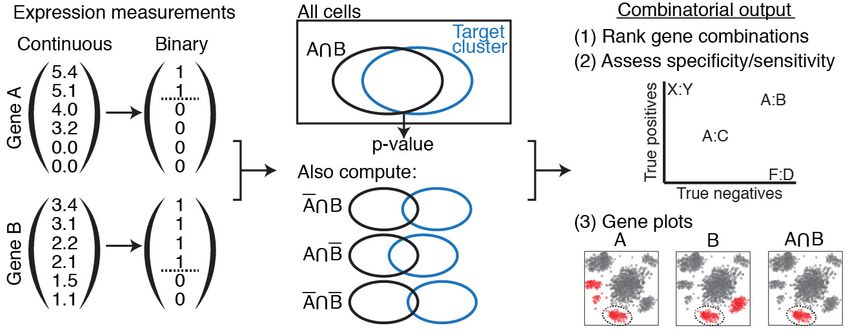
ii
COMET

COMET: Identifying candidate marker panels from single-cell transcriptomic data.
Official documentation for COMET.
Check out the paper on Molecular Systems Biology!
Start with Quickstart, or jump right into the User Manual.
Use the tool on COMET’s website.
Find our code on Github.
If you find COMET to be useful towards your research, please consider citing our paper on Molecular Systems Biol-
ogy!
To skip installation on your own machine and run COMET on your data through COMET’s interface, check out our
website!
To install COMET’s Python implementation on your own machine, you should have Python version 3.6 downloaded &
installed. If you do not, you can get it at the link here (scroll down to the bottom of the page and select your operating
system). Otherwise, you will not be able to set up the proper environment. You can check what python versions you
have installed by using the following command:

$ ls -ls /usr/bin/python*

As with all python usage, it is recommended to use python virtual environments to avoid conflicting package versions.
We provide below two options for installation: direct installation and installation via a virtual environment.

Contents                                                                                                                1
COMET

2       Contents
CHAPTER           1

                                                                                           Direct Installation

The easiest way to install the package without the use of virtual environments is to simply run in the terminal:

$ pip install COMETSC

This will auto-download the depencencies necessary for running the tool. If you prefer to download the source code
directly, you can clone the COMET source from our Github, navigate to the cloned directory, then install it using
Python.

                                                                                                                   3
COMET 4 Chapter 1. Direct Installation
CHAPTER            2

                                   Installing via a Virtual Environment (Recommended)

The following commands can be used to set up the virtual environment assuming there are no active environments
running on the computer.
The first line will install the virtual environment software to your computer (assuming you already have pip installed).

$ pip install virtualenv

The second line then sets up a new virtual environment directory of your choice with the proper version of python

$ virtualenv new_dir --python=python3.6

The following line will activate the virtual environment, just be sure that the path used is the correct one with respect
to the current working directory.

$ source new_dir/bin/activate

Now, install the proper COMET version to the virtual environment.

$ pip install COMETSC

When you are finished using the virtual environment, simply type ‘deactivate’ and you will return to your usual python.

$ deactivate

Your virtual environment should now be set up. If you run into any errors with the above steps, please consult the
python documentation at their tutorial or reach out to us at oshahid@ds.dfci.harvard.edu.

                                                                                                                       5
COMET 6 Chapter 2. Installing via a Virtual Environment (Recommended)
CHAPTER            3

                                                                                                            Usage

Now, run COMET on your data. Give the files of your data as the first three arguments and your desired output
directory as your fourth argument. Your data must be formatted into three files in your current directory. See the
Manual for more information.
In this example, we have our data located in the current directory. output/ is the directory where COMET’s output
will be stored. To test your installation, you can download the following example inputs here ! Copy them to the
directory of your choice and run the following command within the directory:

$ Comet tabmarker.txt tabvis.txt tabcluster.txt output/

After this command is entered, COMET will run in the terminal, processing your data. If you are following along on
your terminal and the run finishes, the install was a success! See some examples for details on what the outputs should
look like.
If, for example, you would like to skip the visualization step, simply add the “-skipvis” option as shown below:

$ Comet tabmarker.txt tabvis.txt tabcluster.txt output/ -skipvis True

All optional arguments for the tool are described below in detail.

Note: Why does my output contain genes that are not relevant (e.g. are secreted rather than cell-surface)?? Our
current marker list is inclusive rather than exclusive. If you find irrelevant non surface markers (e.g. secreted), you
can manualy delete them from the list you used and upload the new list.

The optional statements are available as follows:
-h ()
        Help.
-g (.txt)
        Optional gene list. Pointing -g to a text file with a list of genes will only run COMET with these genes.
        By default, it will run on all genes. Gene lists should be either comma delimited or line delimited.

                                                                                                                     7
COMET
-C (int)
Multi-process option. This allows the user to choose how many clusters to run in parallel. This option
is entirely dependent on your hardware, a good benchmark is the number of cores on your computer is a
good choice for this option if you want things to run faster. Defaults to 1.
-X (int)
X-param of the XL-mHG test. Determines the percentage of ones above the threshold. See the statistical
section for more info. Should only be values between 0 and 1. Defaults to .15 (15%)
-L (int)
L-param of the XL-mHG test. Determines the lowest threshold to consider. See the statistical section for
more info. Defaults to 2 * size of cluster
-Abbrev (list)
Abbrev is a variable to turn on the heuristics for a given run. After typing ‘-Abbrev’ , give a list of the
number gene combinations you would like to be treated with the heuristic. For example, if you want to
turn on the heuristic for 3- gene combinations only, input [3]. If you would like them for both 2- and 3-
gene combinations, input [2,3]. Defaults to an empty list.
-K (int)
The number of gene combinations you would like to consider. This defaults to 2, can be at most 4 (for the
time being). For example, if 4 is chosen, COMET will run 2, 3, and 4 gene combinations.
-Down (int)
For turning on downsampling. Will turn the data set into a random sampling of this many cells. Pre-
serves cluster percentages by taking cells of each cluster at the same rate as the full set. Defaults to no
downsampling.
-Trim (int)
Integer input for determining the size of the output files. Currently default is set to 2000 lines, but an
increase here will give more combinations / singletons in the final ranked output files.
-Count (Boolean)
Will graph the log(expression+1). Leads to nicer continuous expression plots when count data is used.
Defaults to False, will plot the inputted expression as is.
-tenx (Boolean)
For turning on tenx file integration. To submit a 10X format expression matrix, set this variable to True
and in place of the expression matrix file in the command, use the folder containing the 10X data. Keep
the default 10X names (e.g. barcodes.tsv, genes.tsv,matrix.mtx)
-online (Boolean)
Online version of COMET, turning this on will produce a run as if it were submitted to the interface. This
limits the run to looking at the 15 largest clusters.
-skipvis (Boolean)
Setting this to true will skip the visualization section of the tool. Useful for speeding things up or if a user
does not have coordinates to use. Please Note: The tool stilll expects an input for the visualization file,
so just use anything that will fill that spot. Can be an empty text file or even one of the files already in use
(e.g. cluster file), it will not be used.
8 Chapter 3. UsageCHAPTER 4
Troubleshooting
There has been a known issue with the compatibility of matplotlib with certain installations. The errors may look as
follows:
RuntimeError: Python is not installed as a framework. The Mac OS X backend will not be able to function correctly
if Python is not installed as a framework.
ModuleNotFoundError: No module named ‘tkinter’
This issue occurs when the python environment is using the wrong version of the matplotlib backend variable, a setting
used for a variety of different plotting schemes.
To fix this issue, change the matplotlibrc ‘backend’ variable to ‘Agg’ as follows:
cd ~/.matplotlib
Create an empty file called ‘matplotlibrc’ (e.g. vim matplorlibrc)
Add ‘backend: Agg’ to this file and save (esc+:+w+q)
The matplotlib install should be fixed and Comet should run normally. This issue is discussed on stackoverflow as
well. If you already have a matplotlibrc file in the site packages from downloading matplotlib, maneuvering to that
file and changing the backend as described above may also fix the problem.
The most common error when running COMET is the formatting of the input files. If a run is failing and you cannot
figure out why, please consult the Manual to make sure the inputs are absolutely correct.
Any further issues, please feel free to reach out to oshahid@ds.dfci.harvard.edu with any questions, concerns, or
troubleshooting problems.
9COMET 10 Chapter 4. Troubleshooting
CHAPTER            5

                                                                                                     User Manual

Welcome to COMET’s User Manual! Included are COMET’s technical details, statistical background, and instructions
for manual usage.
If you just want to run COMET on your data on COMET’s servers, check out our website!

5.1 Background

COMET’s goal is to make it easier to isolate a specified cluster of cells from a larger population. We attempt to find
the best set of ‘marker’ surface proteins that occur in the specified cluster, but not in the rest of the population. Given
this information, researchers can isolate the specified cluster using antibodies which bind to these ‘marker’ proteins.
We attempt to accomplish this by applying the hypergeometric statistical test to a dataset generated by single-cell RNA
sequencing of a representative cell population. This dataset maps each single cell to a numerical expression value for
each gene measured by this sequencing. By normalizing these values, we can compare expression of a set of genes
across the population, finding genes which are expressed by our specified cluster but not in the rest of the population.

5.1.1 The hypergeometric test

Traditional methods of extracting ‘marker’ proteins from a single-cell RNA sequencing dataset use the statistical t-test,
finding single genes where the median expression in the specified cluster differ most from the median of the rest of
the population. This method has limitations in utility and statistical rigor: most significantly, it cannot find sets of
‘marker’ proteins; only single proteins.
COMET uses the hypergeometric statistical test to overcome these limitations. The hypergeometric test considers
discrete expression/non-expression instead of a continuous expression scale, allowing us to test gene sets by consid-
ering expression/non-expression of the entire set. Combining genes using a continuous expression scale and t-tests is
possible: for example, by simply using the n ‘best’ marker genes. This, however, is ineffective: combinations of genes
do not necessarily mark the same cells as their components.
Additionally, COMET uses Florian Wagner’s implementation of the ‘mHG’ statistical test, which in this context
finds the most statistically significant cutoff between expression/non-expression, given our continuous gene expression
values.

                                                                                                                        11
COMET
5.2 Details of operation
COMET iterates sequentially through all user-specified clusters, generating statistics/visuals for one at a time.
Per-cluster program flow
• 1. Read in data from TXT.
• 2. Run XL-mHG tests on singletons.
• 3. ‘Slide’ XL-mHG cutoff values.
• 4. Generate discrete expression matrix using cutoffs.
• 5. Find cluster and population pair expression counts.
– Finding the parameters for gene pairs
– 3+ gene combinations
• 6. Run hypergeometric test on pairs using counts.
• 7. Calculate true positive/negative.
• 8. Export statistical results.
• 9. Generate and export visualizations.
A simplified version of the program flow.
First, continuous expression values are converted to discrete via the XL-mHG test. Then, genes are combined and
their combinations tests via the hypergeometric test. Finally, these combinations are ranked, assessed, and plotted.
5.2.1 1. Read in data from TXT.
User-specified data is read in via TXT format (currently, requiring tab delimiters.) See Usage for details of the format
of this data.
There are three components:
• Per-cell gene expression values. Each gene must be normalized over cells.
• Cluster membership by cell.
12 Chapter 5. User ManualCOMET
• Per-cell 2-D visualization coordinates, for plotting.
In order to test ‘complement’ genes (i.e. expressed as the absence of a gene rather than the presence of a gene),
COMET creates a new complement gene for each gene. These complement genes are treated exactly the same as
normal genes, but their expression values are the negative of the expression values of their analogous gene. This
allows COMET to find separate mHG cutoff values for genes and their complements.
5.2.2 2. Run XL-mHG tests on singletons.
COMET receives as input a gene expression matrix including n cells (sample size) and p genes, as well as a cluster
label for each cell. The tool will then proceed to testing, for each cluster C and gene G, whether gene G is a favorable
marker candidate for cluster C. A measure of significance will be computed for gene G’s potential as a marker, as well
as other informative statistics (such as True Positive and True Negative rates).
COMET will start by pooling all cells that are not in cluster C into a bigger cluster C0. The procedure then relies on
the XL-minimal Hypergeometric test (XL-mHG test) to assess whether a gene is a favorable marker for cluster C with
respect to cluster C0. In the following paragraphs, we briefly describe the minima Hypergeometric test (mHG test)
and the XL-Hypergeometric test. We refer the reader to Wagner(2017) fo more details on these statistical tests.
The mHG test is a rank-based nonparametric test used to determine gene set enrichment. Cell labels (“1” if the cell
belongs to cluster C, and “0” if the cells belongs to cluster C0) are sorted based on absolute gene expression values,
resulting in a binary list of cluster labels v. For each given cutoff index i, a Hypergeometric test (HG test) is performed
in order to determine enrichment in cluster C cells above the cutoff i. The corresponding HG p-value is computed.
The mHG test will then record which cutoff achieved the lowest HG p-value, i.e. the cutoff that achieved the best C
cells enrichment in the upper part of the list v. This lowest p-value is the mHG test statistic. A p-value for the mHG
test is then computed efficiently using a Dynamic Programming approach.
The XL-mHG test incorporates a slight variation to the mHG test, by including two additional parameters, X and L.
L is an upper bound on the cutoff index i (where i=0 represents the top of the list), while X is a percentage value
indicating the minimal number of cluster C cells the user wants to capture above the chosen cutoff. Once an optimal
cutoff index i* for gene G has been found using the mHG test, the original gene expression vector can be binarized.
We consider that G is expressed (value of 1) in all cells above the cutoff i*, and that G is not expressed (value of 0)
in all cells below the cutoff. In a sense, X and L can be viewed as parameters controlling the False Positive and False
Negative rates. X is precisely a lower bound on the True Positive rate, while L may be tuned to minimize the number
of False positives.
Common marker detection practice in single-cell transcriptomics is to compare the cell populations in cluster C and
cluster C0 using statistical tests such as the unequal variance t-test (Welch test), the Wilcoxon rank-sum test, the
Kolmogorov-Smirnov test, as well as more sophisticated models (zero-inflated Negative Binomial models, hurdle
models). COMET will also output the t-test statistic and p-values, but will not use these values for purposes other than
informing the user.
5.2.3 3. ‘Slide’ XL-mHG cutoff values.
It may happen that the cutoff index lands at a position in the list where all cells have the same gene expression value.
Since we cannot distinguish between cells having the same gene expression value, COMET needs to convert this cutoff
index into an absolute cutoff value t in terms of gene expression (usually expressed in CPM, TPM, or log-transformed
TPM). It accomplishes this by ‘sliding up’ the cutoff index in the sorted list of cells until the index encounters a cell
with a different gene expression value.
For example, gene expression data often contains many cells that do not express the gene of interest at all. These
cells have a gene expression value of 0. In the case that the XL-mHG cutoff index lands on a cell with 0 expression,
COMET will ‘slide’ up the cutoff index in the sorted list of cells until it finds a cell with non-zero expression. In other
words, COMET will choose a cutoff value between 0 and the lowest non-zero expression value, sliding ‘upwards’
5.2. Details of operation 13COMET towards higher values. This results in a non-expression (binarized gene expression value of 0) and expression group (binarized gene expression value of 0), where non-expression is exclusively 0-expression. COMET will always slide ‘upwards’. In the above case of 0-expression, sliding ‘downwards’ and choosing a cutoff below 0 would create an non-expression group of 0 members; no cell expresses below 0! The exception is if COMET reaches the ‘top’ of the list: if it chooses a cutoff value above any cell, the expression group will have zero members. In this case, COMET will turn around and slide ‘downwards’ until it finds a suitable cutoff value. ‘Complement’ genes are treated in the same way, even though their expression values are negative. 5.2.4 4. Generate discrete expression matrix using cutoffs. Now that COMET has generated absolute cutoff values for each gene, it converts the gene expression matrix (rows are genes, columns are cells) of continuous gene expression to one of discrete gene expression: where expression for each individual gene G is represented as a ‘1’ for cells that have expression levels above the XL-mHG absolute cutoff value for G, and as a ‘0’ for cells whose G’s expression level is below the XL-mHG absolute cutoff. Binarizing gene expression data is useful to compute statistics such as True Positive and True Negative rates for each gene and each cluster. It also facilitates handling gene combinations. 5.2.5 5. Find cluster and population pair expression counts. Once binarized gene expression values have been obtained for each single gene relative to each cluster of interest, one can leverage these results to obtain similar binarized expression values for combinations of genes. For clarity purposes, we specialize this paragraph for combinations of two genes, but this extends beyond this simple case to combinations of any number of genes, or/and their complements. If v1 (resp. v2) represents the binarized gene expression vector for gene A (resp. B), the binarized gene expression vector for the combination (A AND B) will be the vector v1*v2. where * denotes the element-wise product. Gene combinations are then ranked using the p-values of a Hypergeometric test looking at the number of cells in cluster C that have a binarized (A AND B) expression value of 1. The parameters of the hypergeometric test are as follows: - Number of cells in cluster C expressing the combination (A AND B); - Number of cells in cluster C; - Number of cells expressing the combination (A AND B); - Total number of cells. These parameters are usually referred to as k, s, M, and N, respectively. As a note, by default COMET will not consider any single genes with a True-Positive value of less then 15% in any multiple gene marker panels since the True-Positive rate can only decrease with the addition of genes to a marker panel. This also decreases the size of matrix multiplications. Finding the parameters for gene pairs For gene pairs, True Positive and True Negative rates can be computed efficiently using matrix multiplication. To understand this better, let’s take the case of a combination of two genes (A AND B). Let u1 be the vector whose i-th entry is 1 if cell i is a True Positive for gene A (i.e. if cell i belongs to cluster C and expresses gene A), and 0 otherwise. Define u2 similarly for gene B. Then the inner product of u1 with u2 will provide to the number of True Positives for (A AND B), i.e. the number of cells expressing (A AND B) that belong to cluster C. Dividing this inner product by the number of cells in cluster C will yield the True Positive rate. Organizing the True Positive vectors into a gene x cell matrix M, it follows that computing the True Positive rate for gene pairs boils down to matrix multiplication of M with its transpose. The result of this operation is a gene x gene matrix TP, where the (i,j)-th entry TP(i,j) is precisely the True Positive rate corresponding to the combination of gene Gi and gene Gj. This similarly applies to computing True Negative rates. In this way, COMET finds the k and M parameters for the hypergeometric test mentioned above, which is used to rank gene combinations in the final output. The s and N parameters are easily found by counting cluster members. 14 Chapter 5. User Manual
COMET

3+ gene combinations

Combinations of 3-4 genes are currently implemented and turned on using the -K option. For each given combination
of genes (A AND B AND C), COMET will compute a True Positive rate, True Negative rate as well as a Hyperge-
ometric significance measure, as mentioned above. These computations leverage matrix multiplication. Due to the
current computational expense, it can be run in full (if a cluster is available) or on lesser hardware with an abbreviated
search space by turning on the heuristics. The main bottleneck is matrix multiplication on computers with smaller
memory loads.
For the 3-gene combinations , we construct an ~N^2 x Cells matrix containing 2-gene combinations (A AND B),
then multiply by another N x Cells matrix containing gene C. This gives us an expression count matrix for the 3 gene
combinations (large) and is then trimmed down to discard gene combinations such as AAA and AAB where there are
gene repeats.

5.2.6 6. Run hypergeometric test on pairs using counts.

Ranking single genes and gene combinations according to their potential as markers for a given clusters requires defin-
ing a unified metric to compare the performance of these different marker candidates. Because each gene combination
(where a singleton is considered to be a combination of a single gene) has its own binarized expression vector (where
the combinations is said to be expressed for values of 1, and not expressed for values of 0), we can use this expression
vector to perform a Hypergeometric test looking at the number of cells in cluster C that have a binarized expression
value of 1. This test will produce a p-value, which is then used to rank all different combinations. Intuitively, a lower
p-value suggests that the corresponding gene combination is a better candidate marker panel.

5.2.7 7. Calculate true positive/negative.

Once COMET has ranked all gene combinations using the corresponding hypergeometric p-value, it reports True
Positive and True Negative rates associated with each gene combination, using the matrix products found earlier. As a
reminder, True Positive rate is found by dividing the number of expressing cells in the cluster by the total cell count of
the cluster; true negative is found by dividing the number of non-expressing cells outside the cluster by the total cell
count outside the cluster.

5.2.8 8. Export statistical results.

COMET’s statistical results are exported to multiple CSV files per cluster: some including statistical values for ex-
clusively singletons, and some including combinations. Rows are genes or gene combinations, columns are values
associated with that gene/combination.
The columns of the statistical data are:
    • gene: the name of the gene.
    • HG_stat: the hypergeometric test statistic. Genes are ranked using this value.
    • mHG_pval: the statistical significance of the cutoff which the XL-mHG test has chosen.
    • mHG_cutoff_index: the index which the XL-mHG has chosen, after sliding.
    • mHG_cutoff_value: the gene expression cutoff value corresponding to the chosen index.
    • t_stat: the t-test statistic.
    • t_pval: the t-test p significance value corresponding to the test statistic.
    • TP: the true positive rate.
    • TN: the true negative rate.

5.2. Details of operation                                                                                              15
COMET
• FoldChange: the log base 2 fold change of a single gene from the cluster of interest compared to the rest of
the cells.
• init rank: sequential ranking based on HG_stat, where lower HG_stat is better ranking. No two genes
are ranked the same; those with identical hypergeometric statistic values are ranked arbitrarily relative to one
another.
• CCS: Cluster Clear Score. This gives us a statistic for the clearing out of other clusters with the addition of the
second gene in comparison with the single gene case. The ‘lead gene’ is whichever of the pair has the smallest
p-value, then we compute weighted True Negative deltas across the other clusters for the lead gene and the pair.
This is only computed for a certain number of the top performing ‘init rank’ gene combinations.
• rank: Final rank. Takes the average of the the init rank and the CCS to determine which gene combinations
are the best performing in both tests.
• Plot: Determines whether a gene is plotted (1) or not (0). The purpose is to only graph the top ten of a given
gene appearance to avoid very well performing genes from taking over the entire results page.
• gene is replaced by gene_1 and gene_2 (combinations of 3+ genes are unimplemented as of yet).
• mHG_pval, mHG_cutoff_index, mHG_cutoff_value, t_stat, and t_pval are omitted, since they
are irrelevant to non-singletons.
5.2.9 9. Generate and export visualizations.
For each cluster, COMET generates several PNG file folders containing visualizations of the statistical results.
Each folder’s name is prefixed by the cluster name, and includes visuals for only the first few highest ranked
genes/combinations. The data files are described in the Output section.
The folders are:
• (cluster)_pairs_as_singletons: compares discrete expression and continuous expression for each
gene in a combination on a t-SNE plot.
• (cluster)_discrete_pairs: compares discrete expression of a gene combination with that of its com-
ponents.
• (cluster)_pair_TP_TN: plots true positive/negative rates of each gene.
• (cluster)_singleton: same as the combined plot, but includes only singletons.
• (cluster)_singleton_TP_TN: same as the TP_TN plot, but includes only singletons.
• (cluster)_discrete_trios: compares discrete expression of a gene combination with that of its com-
ponents, but there are three.
5.3 Input formatting
Before you use COMET with gene expression data, your data should be formatted into 3 files as shown below. The
tables below are shown in excel format for ease of view, but files should be given as plain text files.
• markers.txt: The expression matrix table stored as a TXT file (.txt). The columns of the table lists cell
names, while the rows lists genes. Each element in the rest of the table should contain a numerical gene expres-
sion value, corresponding to the row/cell and column/gene of the element. Tab delimited only. COMET does
not do any preprocessing on this file.
Using the ‘-tenx’ option in the terminal allows the input of 10X data directly from the cellranger output. You
must specify the folder where the expression matrix is found instead of a single file. The names of the files
MUST be: genes.tsv , barcodes.tsv, matrix.mtx
16 Chapter 5. User ManualCOMET
• vis.txt: The visualization coordinates stored as a TXT file (.txt). Consists of three columns separated by
tabs, the first column is cell name (the same as those in markers.txt), the second is the x-axis value for the
cell, and the third is the y-axis value for the cell. Tab delimited only.
Any 2-d visualization is fine (e.g. t-SNE, UMAP)
• cluster.txt: The cluster assignments for cells stored as a TXT file (.txt). The first column is cell name
(consistent with markers.txt and tsne.txt) and the second is the cluster of which the cell is a member.
Tab delimited only.
5.3. Input formatting 17COMET
• gene_list: A list of genes to use for filtering in your data. An optional addition, but when used COMET will
only consider the genes submitted here. By default COMET’s online interface will use our own list of surface
marking genes whereas the package will use all genes. Can be comma delimited on a single line or one gene
per line, no commas.
5.4 Output
Following are examples of COMET output. Descriptions of statistical values can be found in the details section of the
manual.
Comet outputs two folders, one with ranked marker panel lists and one with helpful visualizations for the top ranked
marker panels. The data folder contains all of the ranked marker panel lists (see below) ordered by the cluster of
interest which is stated in the file name. The vis folder contains folders for each cluster (see below) as well as the
TP/TN plos for each cluster (see below). Each sub-folder in vis contains png files of different helpful visualizations of
the data. The metadata file and pickles folder are for future developments and are currently not utilized.
For each cluster the following output files will be generated:
Candidate marker panel output files:
• singleton_all_ranked : Single gene marker list containing the overall rankings based on the xl-mHG
p-value and the absolute fold change. Includes genes with True Positive value greater than 0.15 and negation
genes if they have a True Negative value of greater than 0.5 .
18 Chapter 5. User ManualCOMET
• singleton_positive_markers_ranked: Single gene marker list as above, except without the negation
genes. Useful if the focus is on positive markers.
• singleton_full_unranked : ALL single genes, with no rank. Useful for finding genes that did not pass
the thresholds in singleton_all_ranked
• pair_final_ranking : Gives the gene-pairs ordered based on our ranking system of statistical relevance.
Does not include all pairs.
• pair_full_unranked : Gives ALL gene-pairs with no ordering and no rankings. Useful for looking at
pairs that did not show up in the ranked list.
• _trips : Three gene marker panels ranked (if enabled).
• _quads : Four gene marker panels ranked (if enabled).
CSV pair output example :
Singleton-only CSV output example :
Visualization Directories:
Shown below is t-sne format, but any two-dimensional visualization method is fine to use as input to COMET.
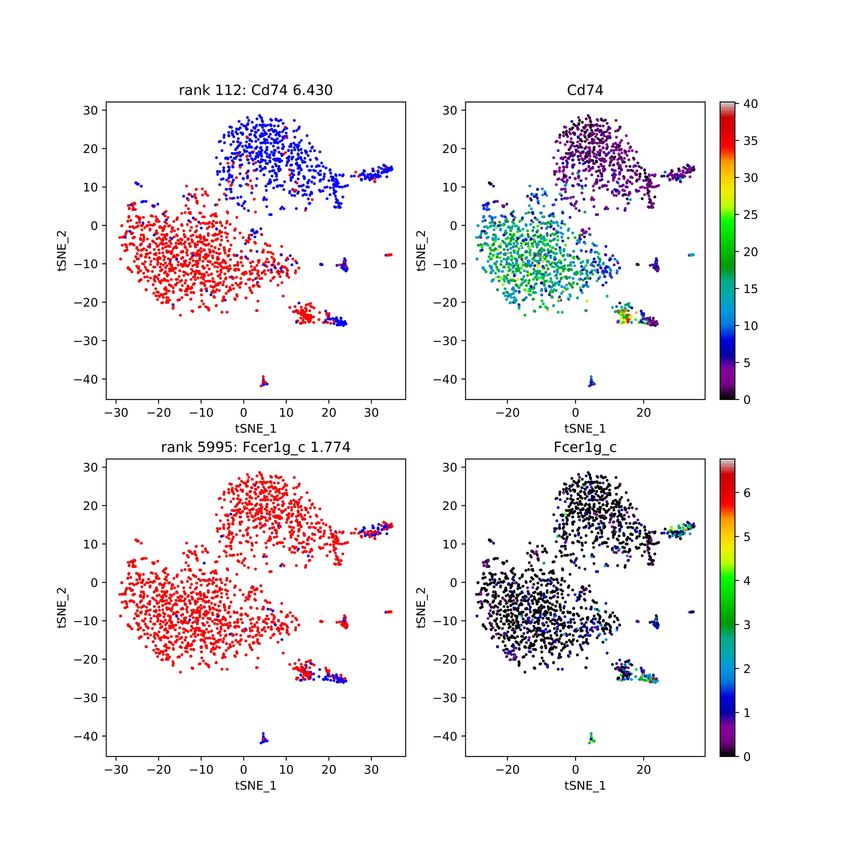
• pairs_as_singletons: Gives the discrete and continuous plot for the single genes of the top performing
pairs.
5.4. Output 19COMET
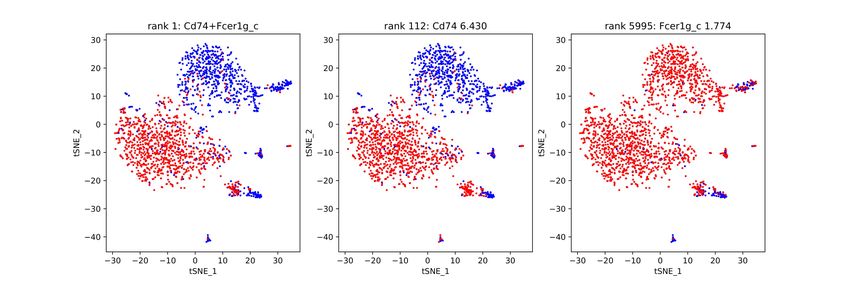
• discrete_pairs : Discrete only plots that show a pair of genes each. Gives a visualization of the discrete
dual-expression alongside each single gene’s discrete expression.
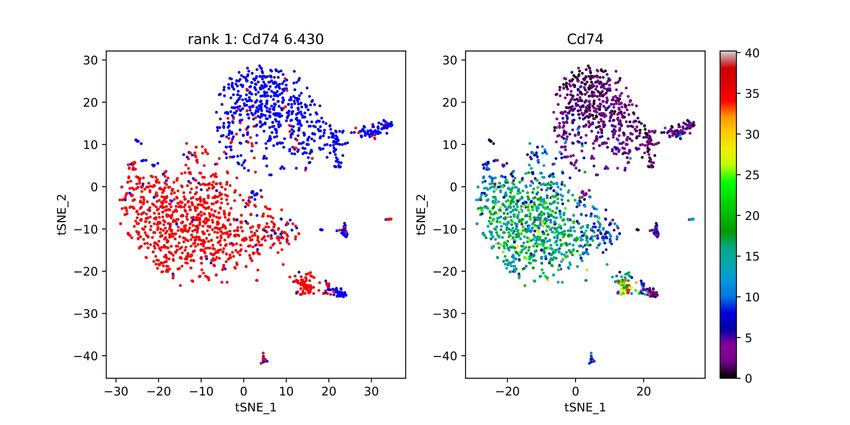
20 Chapter 5. User ManualCOMET • singleton : Plots that show the discrete and continuous version of the top performing single genes. • Pair_TP_TN : True positive/ True negative values for the top gene pairs. 5.4. Output 21
COMET

     • Singleton_TP_TN : true positive / True negatives values for the top single genes.

22                                                                                   Chapter 5. User Manual
COMET Results shown here are using the Mouse Cell Atlas database (Han et. al. 2018) 5.4. Output 23
COMET

24      Chapter 5. User Manual
CHAPTER   6

                                                                     API reference

At the moment, these functions are designed for internal use only.

6.1 hgmd.__main__

6.2 hgmd.hgmd

6.3 hgmd.visualize

                                                                                25
You can also read