2019 FULL YEAR RESULTS - Legrand
←
→
Page content transcription
If your browser does not render page correctly, please read the page content below

2019 FULL YEAR RESULTS
FEBRUARY 13, 2020
1   HIGHLIGHTS                                P.3

2   NET SALES                                 P.6

3   INTEGRATED PERFORMANCE & VALUE CREATION   P.11

4   STRENGTHENING PROFITABLE GROWTH PROFILE   P.22

5   2020 TARGETS                              P.34

6   APPENDICES                                P.36

                                                     2
HIGHLIGHTS

             3
1
HIGHLIGHTS
Total growth in sales +10%
Integrated performance fully in line with targets(1)
• Organic growth in sales: +2.6%
• Adjusted operating margin before acquisitions(2): 20.4%
• Achievement rate of CSR roadmap(3): 113%
Strong value creation
• Net profit attributable to the Group: +8%
• Normalized free cash flow: +13%
Strengthening profitable growth profile
• Continued deployment of Eliot program
• Innovation-driven enrichment of product offering
• Three acquisitions made in 2019
• Ongoing momentum for improving performance
1. For a complete wording of 2019 targets, readers are invited to refer to the press release dated February 14, 2019.
2. At 2018 scope of consolidation. 4
3. Achievement rate of CSR 2019-2021 roadmap in 2019.
1
HIGHLIGHTS

                                                                                 Average
                                          2018             2019
                                                                               over 2 years

               Increase in net sales     +8.6%           +10.4%                  +9.5%

             Adjusted operating margin   20.2%            20.0%                  20.1%
                                                  (20.4% excl. acquisitions)

             Basic earnings per share    +23.2%           +8.2%                  +15.7%

             Normalized free cash flow
                     on sales            14.9%            15.2%                  15.1%

                  CSR roadmap
                 achievement rate        122%             113%                    118%

                                                                                              5
NET SALES

            6
2
NET SALES
€ millions
5,997 6,622
Organic growth: +2.6%
Total growth
External growth: +5.3%(1)
+10.4%
FX effect: +2.2%(2)
2018 2019
1. Based on acquisitions completed in 2019 and their likely date of consolidation, the impact of the change in scope of consolidation should reach around +1% for
full-year 2020.
2. Applying average exchange rates for January 2020, the full-year 2020 impact on sales of changes in currency rates should be about +0.5%. 7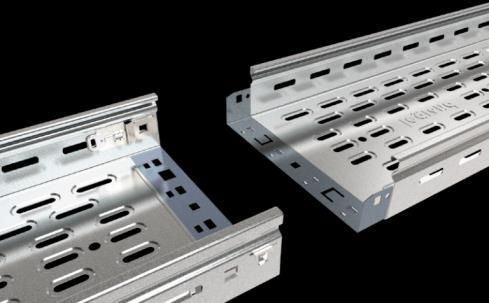
2
NET SALES

                            o      +3.3% organic growth.

                            o      In Europe’s mature countries, sales rose organically by +2.9% in 2019. The trend was
                                   driven by good showings in Italy – that reported strong performances in energy
                                   distribution, user interfaces, and connected products such as video door entry
                                   systems, Smarther thermostats, and the Living Now with Netatmo range – as well as
                                   in the United Kingdom, in the Benelux(1), in Switzerland and in Southern Europe(2).
                                   Sales rose in France from 2018, driven by the positive response to new connected
                                   products including emergency lighting and user interfaces with the Mosaic line
                                   launched in 2019 and the dooxie range introduced earlier.

                            o      In Europe’s new economies, 2019 sales rose +6.0% at constant scope of consolidation
                                   and exchange rates, with Eastern Europe turning in a particularly solid showing.

                            o      The very sustained growth in sales recorded in Europe in the fourth quarter alone
                                   compared with 2018 (+5.1%), benefitted in part from one-off factors, particularly in
                                   Turkey and in Eastern Europe, and sets a demanding basis for comparison for 2020.

            1. Benelux: Belgium + the Netherlands + Luxembourg.                                                           8
            2. Southern Europe: Spain + Greece + Portugal.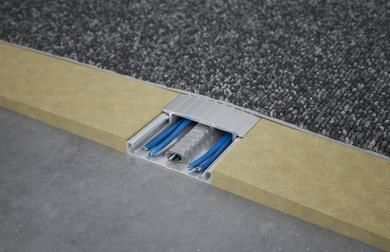
2
NET SALES

            o   +2.5% organic growth.

            o   This good showing was driven by the United States, where sales rose +2.9% with solid
                growth in user interfaces, cable management, and busways for data centers, rounded
                out by rising sales in lighting commands and solutions.

            o   Sales also rose in Canada, and retreated in Mexico.

            o   Note that in 2020, the Group will not be pursuing a US retail contract that no longer
                meets Legrand’s profitability criteria; this is expected to have a negative impact on
                2020 sales in North and Central America of around -2% of 2019 sales.

                                                                                                        9
2
NET SALES

            o   +1.4% organic growth.

            o   In Asia-Pacific, sales were up +2.4% from 2018, reflecting in particular a sustained
                increase in India and China. Australia saw a decline in business, as did certain
                countries in Southeast Asia.

            o   In South America, organic growth in sales came to +0.4% in 2019, with sales nearly
                unchanged in Brazil and mixed trends for the rest of the area.

            o   In Africa and the Middle East, sales retreated by -0.5%. Strong growth recorded in
                many African countries including Egypt and Algeria was offset by a marked decline in
                the Middle East reflecting the region’s difficult geopolitical and economic environment.

            o   2020 should remain marked by the uncertain political and economic environment in
                several regions.

                                                                                                           10
INTEGRATED
PERFORMANCE &
VALUE CREATION
11INTEGRATED PERFORMANCE & VALUE CREATION
3
€ millions
2018
1,212
+9.4%
2019
1,326
123
INTEGRATED PERFORMANCE & VALUE CREATION
2018 Adjusted operating margin 20.2%
• Rising US tariffs, which were fully offset
• Efficient management of pricing +0.2 pts
• Good operating performance
• Solid control of administrative and selling expenses
2019 Adjusted operating margin before acquisitions(1) 20.4%(2)
• Impact of acquisitions -0.4 pts(3)
2019 Adjusted operating margin 20.0%(2)
1. At 2018 scope of consolidation.
2. Including a favorable impact of around +0.1 points linked to implementation of IFRS 16 standard. 13
3. As announced. Readers are invited to refer to the press release dated February 14, 2019 for more details.3
INTEGRATED PERFORMANCE & VALUE CREATION
o Rise in operating profit (+€98m)
Net profit attributable to the
Group:
o Unfavorable change (-€16m) in net financial
€835m
expenses(1) and FX result
up
+8.2%
o Increase in corporate tax (-€17m)(2)
1. Due primarily to implementation of the IFRS 16 standard for an impact of -€10m.
2. In absolute value. Coming from the increase in Group profit before tax, partially offset by the favorable impact of a one-off reduction in the corporate tax rate from 28.1% in
2018 to 27.5%. 143
INTEGRATED PERFORMANCE & VALUE CREATION
o Cash flow from operations stood at 18.4%(2) of
sales in 2019, i.e. a rise of +11.0%
o Working capital requirement came to 8.1%
of sales at December 31, 2019, down 1.1 points Normalized free cash flow:
from December 31, 2018, primarily due to a
particularly favorable trend in operating working €1,010m
capital requirement that was partially offset by up
the consolidation of recent acquisitions
+13.0%
o Exceeding €1bn, free cash flow represented
15.8%(2) of Group sales, marking a sharp rise in
2019 – nearly +40% – from 2018
1. For more details on the reconciliation of free cash flow with normalized free cash flow, readers are invited to consult page 68.
2. Including a favorable impact of around +1.0 point linked to implementation of the IFRS 16 standard. 153
INTEGRATED PERFORMANCE & VALUE CREATION
• Accreditation for • Organized around three
Responsible Supplier 3rd focal areas—Business 3 targets
1st Relations Roadmap for 2030
ecosystem, People and
Roadmap
Environment
• Ten key challenges
• Launch of the Group’s
contributing to the UN’s
compliance program
Sustainable
Development Goals
2004 2004-2010 2011-2013 2014-2018 2019-2021 2030
• Certification by an
external auditor from • 80% of total products
• Joined the Global 2015 revenue sustainable by
Compact design and/or by usage
Creation of a • Integration of CSR 4th
Sustainable • Added to the 2nd criteria in long-term • 1/3 of key positions held
Roadmap
Development FTSEE4GOOD index Roadmap compensation by women & Gender-
function (2007) balanced workforce
• 122% achievement rate
• Reduce carbon
emissions by 30% for
scope 1 & 2 emissions
163
INTEGRATED PERFORMANCE & VALUE CREATION
123%
BUSINESS ECOSYSTEM
2019-2021 CSR roadmap
achievement rate
109%
113% PEOPLE
108%
ENVIRONMENT
2019 achievements ahead of its roadmap,
demonstrating Legrand’s commitment to CSR.
173
INTEGRATED PERFORMANCE & VALUE CREATION
Release of “diversity and
Ongoing progress in employees’
Pursued involvement to develop and inclusion” policy structured around
Health & Safety achievements,
restore access to water and five areas: Gender diversity, Inclusion
raising by +27% average hours of
electricity with NGO “Electriciens of disabled workers, Intergenerational
training per employee and reducing
sans Frontières”, notably following collaboration, Social and cultural
significantly the frequency rate
natural disasters diversity, Inclusion of
of accidents
LGBT+ people
183
INTEGRATED PERFORMANCE & VALUE CREATION
Reassertion of climate commitment Group governance awarded
during the French Business Climate Over 2.4 million tons 2019 Website Transparency Award
Pledge notably by targeting a of CO2 emissions avoided through 2019 Annual General Meeting Awards
reduction by 30% in CO2 emissions Group’s energy-efficient solutions,
by 2030 and by providing customers i.e., outperforming the target for CSR in Financing
with Product Environmental Profiles the year (2.2 million tons) Introduction of CSR performance
(PEP) criterion for syndicated loan
193
INTEGRATED PERFORMANCE & VALUE CREATION
February 2019 2019
Metrics
Targets announced Achievements
Organic growth 0% to +4% +2.6% ✓X
Adjusted
19.9%(2) to 20.7%(2) 20.4% (3)
operating margin
before acquisitions(1)
of sales
of sales ✓X
✓X
CSR roadmap
achievement rate 113%
1. At 2018 scope of consolidation.
2. After an estimated favorable impact of around +0.1 points linked to the implementation of IFRS 16 standard from January 1, 2019 on. 20
3. Including a favorable impact of around +0.1 points linked to implementation of IFRS 16 standard.3
INTEGRATED PERFORMANCE & VALUE CREATION
+6.0%
€1.42(1)
€1.34
2018 2019
1. Subject to the approval of shareholders at the General Meeting on May 27, 2020 and payable on June 3, 2020. This dividend will be paid in full out of distributable income. 21STRENGTHENING
PROFITABLE
GROWTH PROFILE
224
STRENGTHENING PROFITABLE GROWTH PROFILE
o Continued deployment of Eliot program
o Innovation-driven enrichment of product offering
o Three acquisitions made in 2019
o Ongoing momentum for improving performance
234
STRENGTHENING PROFITABLE GROWTH PROFILE
Reinforcing worldwide reach Ongoing new launches Enriching the experience
Many new connected products Enhanced IoT integrated
User interface connected ranges
launched, increasing reach to experience through additional
deployed in 28 new countries
innovative functionalities functionalities, accessible notably
in 2019
in all buildings with the Home + Control app
244
STRENGTHENING PROFITABLE GROWTH PROFILE
Pursuit of strong growth path Continued fruitful innovation synergies
2019 organic growth
in sales, about
+20%
Drivia with Netatmo Smart Door
Lock & Keys
A stream of new products presented
R&D: team of nearly 170 at the end of 2019
at the 2020 CES in innovative fields
254
STRENGTHENING PROFITABLE GROWTH PROFILE
Metrics 2019 achievements 2022 organic growth targets(2)
Organic growth in sales of +10%
connected products from 2018 Double-digit CAGR(3)
from 2018 to 2022
More than €1 billion
sales in 2022
Total sales €819(4) million
of connected products +29% from 2018
1. For more information on these targets, readers are invited to refer to the press release of June 12, 2019.
2. Excluding any major economic slowdown.
3. CAGR: Compound Annual Growth Rate.
4. Sales at 2019 perimeter and exchange rates.
264
STRENGTHENING PROFITABLE GROWTH PROFILE
Valena Next with Netatmo Mosaic Plexo with Netatmo Radiant furniture for hospitality
Spain & Belgium France Europe North America
Classia Adorne Graphite Clip On multi-outlet
Europe North America extension sockets
Europe
Reach Digital At-Home
Lyncus Rivia Belanko S
alarm units
India Vietnam South East Asia
United Kingdom
274
STRENGTHENING PROFITABLE GROWTH PROFILE
CRT Tier 2
P31 solutions
Trimod MCS UPS Highly energy-efficient Connected emergency lighting
for cable management
Worldwide transformer France
Europe
Europe
DRX 125 / 250 HP XCP-S Aluminium and RX3 C-curve
Universal floor boxes
molded case circuit breaker Copper busbars miniature circuit breaker
World
Asia Worldwide India
284
STRENGTHENING PROFITABLE GROWTH PROFILE
Connected door entry system Classe 100x Kenall’s MedMaster MedSlot Series Pinnacle’s EDGE 2 & 4
with facial recognition Connected video door entry system lighting for critical environments architectural lighting
China Europe North America North America
Finelite’s HP-4 Circle Pinnacle’s Cove LED
Natural lighting management Sanus Advanced full-motion
architectural lighting architectural lighting
QMotion QzHub3 North America
North America North America
North America
294
STRENGTHENING PROFITABLE GROWTH PROFILE
Power over ethernet switches
Worldwide
LCS3
Kontour KXC Parallax Stratos 1.0
10’’ patch panel &
Monitor arms screen
area distribution box
North America North America
Worldwide
Pre-equipped
fiber cassettes
Worldwide
On-Q Enhanced WiFi Ready
UHD Fiber cassettes LCS3 Zero U solutions AV mini-bridge
Enclosures
Worldwide Worldwide North America
North America
304
STRENGTHENING PROFITABLE GROWTH PROFILE
Share of R&D investments
on sales
4.8%
Pursuit of innovation strategy for continuous product catalogue enrichment
31
1. 2019 data.4
STRENGTHENING PROFITABLE GROWTH PROFILE
• Undisputed #1 in the United States • Chinese leader in connected • Innovative US company specializing
in busways for data centers hotel-room management solutions in over-floor power and data
• Solutions that have long been (lighting, air temperature, etc.) distribution
known for their quality as well as
their ease of installation and use, • Solutions for new construction and
• Annual sales of over €10 million renovation of commercial buildings
and that are sold under the Starline
brand – a true benchmark for the
market • Annual sales of around $20 million
• Annual sales of around $175 million
Based on acquisitions completed in 2019 and their likely dates of consolidation, the impact of the change in scope of
consolidation for full-year 2020 should reach around +1% of sales 324
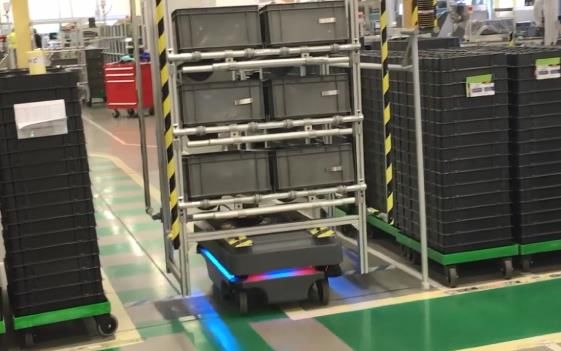
STRENGTHENING PROFITABLE GROWTH PROFILE
Legrand Way(1) deployment Digitalization of organization Optimizing industrial footprint
• Continuous roll-out of the Group • Front office: numerous • Rationalization of the configuration
best practices program: initiatives for digital marketing, and the number of production sites in
notably through web campaigns, Russia, Spain, China, India, Saudi
• Successfully applied at
and marketing automation to all Arabia and Brazil
industrial sites (increase in
customers
deployment ratio of +2 pts in
2019 from 2018, on track with • Back office: ongoing deployment • Reduction in Group carbon
ambitions) of Factory 4.0 tools with emissions in 2019 from
numerous initiatives (POCs(2)) 2018 : -6%
• Active expansion to all
• 70 already effective (vs. 51 in
functions, and in particular
2018)
product development
• 40 currently being tested
1. Program dedicated to the implementation of best practices throughout the Group, covering in particular the management of operational performance, new-product
development, rules for health and safety, and quality. 33
2. POC: Proof of Concept.2020 TARGETS
345
2020 TARGETS
In 2020, Legrand will pursue its strategy of profitable and sustainable growth.
Based on current macroeconomic projections, which are uncertain on the whole for 2020, and
excluding any major changes in the economic environment(1), Legrand has set as targets, on the
one hand organic evolution in sales in 2020 of between -1% and +3%, and on the other hand
adjusted operating margin before acquisitions (at 2019 scope of operations) of between 19.6% and
20.4% of sales.
Legrand will also pursue its strategy of value-creating acquisitions and, subject to finalization of
opportunities currently under discussion, intends to aim for a total increase of at least +4% in scope
of consolidation on sales in 2020.
Legrand will moreover actively continue to deploy its demanding CSR roadmap for 2019-2021.
35
1. Possibly linked to developments in the world health outlook.APPENDICES
366
APPENDICES
• Adjusted operating profit is defined as operating profit adjusted for amortization and depreciation of revaluation of assets at the time of acquisitions and for other P&L
impacts relating to acquisitions and, where applicable, for impairment of goodwill.
• Busways are electric power distribution systems based on metal busbars.
• Cash flow from operations is defined as net cash from operating activities excluding changes in working capital requirement.
• CSR stands for Corporate Social Responsibility.
• EBITDA is defined as operating profit plus depreciation and impairment of tangible and of right of use assets, amortization and impairment of intangible assets (including
capitalized development costs), reversal of inventory step-up and impairment of goodwill.
• Free cash flow is defined as the sum of net cash from operating activities and net proceeds from sales of fixed and financial assets, less capital expenditure and capitalized
development costs.
• KVM stands for Keyboard, Video and Mouse.
• Net financial debt is defined as the sum of short-term borrowings and long-term borrowings, less cash and cash equivalents and marketable securities.
• Normalized free cash flow is defined as the sum of net cash from operating activities—based on a normalized working capital requirement representing 10% of the last 12
months’ sales and whose change at constant scope of consolidation and exchange rates is adjusted for the period considered—and net proceeds of sales from fixed and
financial assets, less capital expenditure and capitalized development costs.
• Organic growth is defined as the change in sales at constant structure (scope of consolidation) and exchange rates.
• Payout is defined as the ratio between the proposed dividend per share for a given year, divided by the net profit attributable to the Group per share of the same year,
calculated on the basis of the average number of ordinary shares at December 31 of that year, excluding shares held in treasury.
• PDU stands for Power Distribution Unit.
• UPS stands for Uninterruptible Power Supply.
• Working capital requirement is defined as the sum of trade receivables, inventories, other current assets, income tax receivables and short-term deferred tax assets, less
37
the sum of trade payables, other current liabilities, income tax payables, short-term provisions and short-term deferred tax liabilities.6
APPENDICES
• Undisputed #1 in the United States in busways for data centers
• Solutions that have long been known for their quality as well as their ease of installation
and use, and that are sold under the Starline brand – a true benchmark for the market
• Annual sales of around $175 million
• More than 450 employees
• Legrand is pursuing its development in the buoyant digital • The Group is strengthening its leading positions in offerings
infrastructures market, sustained by the ongoing increase in for datacenters in the United States (including PDUs,
data flows around the world pre-terminated solutions and cable management)
386
APPENDICES
• Chinese leader in connected hotel-room management solutions (lighting,
air temperature, etc.)
• Located in Huizhou
• Annual sales of over €10 million
• Around 250 employees
Jobo Smartech’s ranges ideally round out those of Legrand in China’s dynamic hotel segment
396
APPENDICES
• Innovative US company specializing in over-floor power and data distribution
• Solutions for new construction and renovation of commercial buildings
• Based in Dallas (Texas)
• Annual sales of around $20 million
• Around 75 employees
Strengthens Legrand’s world leadership in cable management
406
APPENDICES
Breakdown of change in 2019 net sales by destination (€m)
+10.4%
North Total
Rest of
Europe & Central
the World
America
+2.2% +5.3%(1)
+2.6% FX Scope of
2018 Organic growth consolidation 2019
1. Due to the consolidation of Modulan, Gemnet, Shenzhen Clever Electronic, Kenall, Debflex, Netatmo, Trical and Universal Electric Corporation. 416
APPENDICES
Total Scope of Like-for-Like
In € millions 2018 2019 Currency Effect
Change Consolidation Growth
Europe 2,466.3 2,639.3 7.0% 3.7% 3.3% -0.2%
North and Central America 2,175.1 2,559.2 17.7% 9.0% 2.5% 5.4%
Rest of the World 1,355.8 1,423.8 5.0% 2.3% 1.4% 1.2%
Total 5,997.2 6,622.3 10.4% 5.3% 2.6% 2.2%
42
1. Market where sales are recorded.6
APPENDICES
Total Scope of Like-for-Like
In € millions Q1 2018 Q1 2019 Currency Effect
Change Consolidation Growth
Europe 643.0 652.3 1.4% 0.4% 2.3% -1.2%
North and Central America 493.6 567.1 14.9% 4.0% 2.4% 8.0%
Rest of the World 308.6 330.6 7.1% 1.8% 4.9% 0.3%
Total 1,445.2 1,550.0 7.3% 1.9% 2.9% 2.3%
43
1. Market where sales are recorded.6
APPENDICES
Total Scope of Like-for-Like
In € millions Q2 2018 Q2 2019 Currency Effect
Change Consolidation Growth
Europe 648.6 701.4 8.1% 6.1% 2.4% -0.4%
North and Central America 552.4 625.7 13.3% 4.4% 2.3% 6.1%
Rest of the World 340.6 349.7 2.7% 3.4% -1.4% 0.7%
Total 1,541.6 1,676.8 8.8% 4.9% 1.5% 2.1%
44
1. Market where sales are recorded.6
APPENDICES
Total Scope of Like-for-Like
In € millions Q3 2018 Q3 2019 Currency Effect
Change Consolidation Growth
Europe 556.0 599.8 7.9% 3.5% 3.6% 0.6%
North and Central America 568.7 711.2 25.1% 15.9% 3.0% 4.7%
Rest of the World 325.9 351.1 7.7% 4.9% 0.3% 2.4%
Total 1,450.6 1,662.1 14.6% 8.7% 2.6% 2.7%
45
1. Market where sales are recorded.6
APPENDICES
Total Scope of Like-for-Like
In € millions Q4 2018 Q4 2019 Currency Effect
Change Consolidation Growth
Europe 618.7 685.8 10.8% 5.0% 5.1% 0.5%
North and Central America 560.4 655.2 16.9% 10.7% 2.3% 3.2%
Rest of the World 380.7 392.4 3.1% -0.4% 2.3% 1.2%
Total 1,559.8 1,733.4 11.1% 5.7% 3.4% 1.7%
46
1. Market where sales are recorded.6
APPENDICES
Total Scope of Like-for-Like
In € millions 2018 2019 Currency Effect
Change Consolidation Growth
Europe 2,589.5 2,758.0 6.5% 3.6% 3.0% -0.2%
North and Central America 2,223.2 2,602.9 17.1% 9.1% 1.9% 5.4%
Rest of the World 1,184.5 1,261.4 6.5% 2.0% 3.1% 1.2%
Total 5,997.2 6,622.3 10.4% 5.3% 2.6% 2.2%
47
1. Zone of origin of the product sold.6
APPENDICES
Total Scope of Like-for-Like
In € millions Q1 2018 Q1 2019 Currency Effect
Change Consolidation Growth
Europe 669.3 677.0 1.2% 0.2% 2.2% -1.3%
North and Central America 504.6 578.0 14.5% 3.8% 2.2% 8.0%
Rest of the World 271.3 295.0 8.7% 2.5% 5.8% 0.3%
Total 1,445.2 1,550.0 7.3% 1.9% 2.9% 2.3%
48
1. Zone of origin of the product sold.6
APPENDICES
Total Scope of Like-for-Like
In € millions Q2 2018 Q2 2019 Currency Effect
Change Consolidation Growth
Europe 680.5 731.4 7.5% 5.8% 2.1% -0.5%
North and Central America 565.2 633.6 12.1% 4.1% 1.5% 6.1%
Rest of the World 295.9 311.8 5.4% 4.3% 0.3% 0.7%
Total 1,541.6 1,676.8 8.8% 4.9% 1.5% 2.1%
49
1. Zone of origin of the product sold.6
APPENDICES
Total Scope of Like-for-Like
In € millions Q3 2018 Q3 2019 Currency Effect
Change Consolidation Growth
Europe 583.4 625.5 7.2% 3.4% 3.1% 0.6%
North and Central America 580.3 723.4 24.7% 16.7% 2.0% 4.7%
Rest of the World 286.9 313.2 9.2% 3.3% 3.0% 2.6%
Total 1,450.6 1,662.1 14.6% 8.7% 2.6% 2.7%
50
1. Zone of origin of the product sold.6
APPENDICES
Total Scope of Like-for-Like
In € millions Q4 2018 Q4 2019 Currency Effect
Change Consolidation Growth
Europe 656.3 724.1 10.3% 5.0% 4.7% 0.4%
North and Central America 573.1 667.9 16.5% 10.8% 1.9% 3.2%
Rest of the World 330.4 341.4 3.3% -1.5% 3.6% 1.3%
Total 1,559.8 1,733.4 11.1% 5.7% 3.4% 1.7%
51
1. Zone of origin of the product sold.6
APPENDICES
In € millions 2018 2019 % change
Net sales 5,997.2 6,622.3 +10.4%
Gross profit 3,127.5 3,437.8 +9.9%
as % of sales 52.1% 51.9%
Adjusted operating profit(1) 1,212.1 1,326.1 +9.4%
as % of sales 20.2% 20.0%(2)
Amortization & depreciation of revaluation of assets at the time
(73.1) (88.7)
of acquisitions and other P&L impacts relating to acquisitions
Operating profit 1,139.0 1,237.4 +8.6%
as % of sales 19.0% 18.7%
Financial income (costs) (67.1) (79.2)
Exchange gains (losses) 2.2 (2.0)
Income tax expense (301.3) (318.3)
Share of profits (losses) of equity-accounted entities (0.4) (1.8)
Profit 772.4 836.1 +8.2%
Net profit attributable to the Group 771.7 834.8 +8.2%
1. Operating profit adjusted for amortization and depreciation of revaluation of assets at the time of acquisitions and for other P&L impacts relating to acquisitions (€73.1 million in
2018 and €88.7 million in 2019) and, where applicable, for impairment of goodwill (€0 in 2018 and 2019). 52
2. 20.4% excluding acquisitions (at 2018 scope of consolidation).6
APPENDICES
In € millions Q1 2018 Q1 2019 % change
Net sales 1,445.2 1,550.0 +7.3%
Gross profit 767.9 804.3 +4.7%
as % of sales 53.1% 51.9%
Adjusted operating profit(1) 290.4 305.2 +5.1%
as % of sales 20.1% 19.7%(2)
Amortization & depreciation of revaluation of assets at the time
(18.8) (19.3)
of acquisitions and other P&L impacts relating to acquisitions
Operating profit 271.6 285.9 +5.3%
as % of sales 18.8% 18.4%
Financial income (costs) (18.7) (18.8)
Exchange gains (losses) (1.2) (0.8)
Income tax expense (75.6) (75.2)
Share of profits (losses) of equity-accounted entities (0.2) (0.3)
Profit 175.9 190.8 +8.5%
Net profit attributable to the Group 175.3 190.4 +8.6%
1. Operating profit adjusted for amortization and depreciation of revaluation of assets at the time of acquisitions and for other P&L impacts relating to acquisitions (€18.8 million in
Q1 2018 and €19.3 million in Q1 2019) and, where applicable, for impairment of goodwill (€0 in Q1 2018 and Q1 2019). 53
2. 19.8% excluding acquisitions (at 2018 scope of consolidation).6
APPENDICES
In € millions Q2 2018 Q2 2019 % change
Net sales 1,541.6 1,676.8 +8.8%
Gross profit 813.3 879.1 +8.1%
as % of sales 52.8% 52.4%
Adjusted operating profit(1) 334.7 357.4 +6.8%
as % of sales 21.7% 21.3%(2)
Amortization & depreciation of revaluation of assets at the time
(16.9) (23.7)
of acquisitions and other P&L impacts relating to acquisitions
Operating profit 317.8 333.7 +5.0%
as % of sales 20.6% 19.9%
Financial income (costs) (16.5) (19.5)
Exchange gains (losses) 4.5 0.5
Income tax expense (91.7) (88.8)
Share of profits (losses) of equity-accounted entities 0.1 (0.6)
Profit 214.2 225.3 +5.2%
Net profit attributable to the Group 214.7 224.9 +4.8%
1. Operating profit adjusted for amortization and depreciation of revaluation of assets at the time of acquisitions and for other P&L impacts relating to acquisitions (€16.9 million in
Q2 2018 and €23.7 million in Q2 2019) and, where applicable, for impairment of goodwill (€0 in Q2 2018 and Q2 2019). 54
2. 22.0% excluding acquisitions (at 2018 scope of consolidation).6
APPENDICES
In € millions Q3 2018 Q3 2019 % change
Net sales 1,450.6 1,662.1 +14.6%
Gross profit 747.9 860.1 +15.0%
as % of sales 51.6% 51.7%
Adjusted operating profit(1) 282.8 335.9 +18.8%
as % of sales 19.5% 20.2%(2)
Amortization & depreciation of revaluation of assets at the time
(17.9) (24.2)
of acquisitions and other P&L impacts relating to acquisitions
Operating profit 264.9 311.7 +17.7%
as % of sales 18.3% 18.8%
Financial income (costs) (15.8) (19.9)
Exchange gains (losses) 3.7 1.2
Income tax expense (67.7) (82.9)
Share of profits (losses) of equity-accounted entities (0.2) (0.4)
Profit 184.9 209.7 +13.4%
Net profit attributable to the Group 184.5 209.7 +13.7%
1. Operating profit adjusted for amortization and depreciation of revaluation of assets at the time of acquisitions and for other P&L impacts relating to acquisitions (€17.9 million in
Q3 2018 and €24.2 million in Q3 2019) and, where applicable, for impairment of goodwill (€0 in Q3 2018 and Q3 2019). 55
2. 20.5% excluding acquisitions (at 2018 scope of consolidation).6
APPENDICES
In € millions Q4 2018 Q4 2019 % change
Net sales 1,559.8 1,733.4 +11.1%
Gross profit 798.4 894.3 +12.0%
as % of sales 51.2% 51.6%
Adjusted operating profit(1) 304.2 327.6 +7.7%
as % of sales 19.5% 18.9%(2)
Amortization & depreciation of revaluation of assets at the time
(19.5) (21.5)
of acquisitions and other P&L impacts relating to acquisitions
Operating profit 284.7 306.1 +7.5%
as % of sales 18.3% 17.7%
Financial income (costs) (16.1) (21.0)
Exchange gains (losses) (4.8) (2.9)
Income tax expense (66.3) (71.4)
Share of profits (losses) of equity-accounted entities (0.1) (0.5)
Profit 197.4 210.3 +6.5%
Net profit attributable to the Group 197.2 209.8 +6.4%
1. Operating profit adjusted for amortization and depreciation of revaluation of assets at the time of acquisitions and for other P&L impacts relating to acquisitions (€19.5 million in
Q4 2018 and €21.5 million in Q4 2019) and, where applicable, for impairment of goodwill (€0 in Q4 2018 and Q4 2019). 56
2. 19.5% excluding acquisitions (at 2018 scope of consolidation).6
APPENDICES
North and
2019 Rest of
Europe Central Total
(in € millions) the World
America
Net sales 2,758.0 2,602.9 1,261.4 6,622.3
Cost of sales (1,230.4) (1,254.9) (699.2) (3,184.5)
Administrative and selling expenses, R&D costs (883.5) (860.5) (332.4) (2,076.4)
Reversal of acquisition-related amortization, depreciation, expense and
(12.5) (63.4) (12.8) (88.7)
income accounted for in administrative, selling expenses and R&D costs
Adjusted operating profit before other
656.6 550.9 242.6 1,450.1
operating income (expense)
as % of sales 23.8% 21.2% 19.2% 21.9%
(1)
Other operating income (expense) (71.3) (40.3) (12.4) (124.0)
Reversal of acquisition-related amortization, depreciation, expense and
0.0 0.0 0.0 0.0
income accounted for in other operating income (expense)
Adjusted operating profit 585.3 510.6 230.2 1,326.1
as % of sales 21.2% 19.6% 18.2% 20.0%
57
1. Restructuring (€30.9m) and other miscellaneous items (€93.1m).6
APPENDICES
North and
2018 Rest of
Europe Central Total
(in € millions) the World
America
Net sales 2,589.5 2,223.2 1,184.5 5,997.2
Cost of sales (1,137.1) (1,069.6) (663.0) (2,869.7)
Administrative and selling expenses, R&D costs (822.8) (746.4) (314.1) (1,883.3)
Reversal of acquisition-related amortization, depreciation, expense and
(6.1) (53.6) (11.2) (70.9)
income accounted for in administrative, selling expenses and R&D costs
Adjusted operating profit before other
635.7 460.8 218.6 1,315.1
operating income (expense)
as % of sales 24.5% 20.7% 18.5% 21.9%
(1)
Other operating income (expense) (40.6) (29.5) (35.1) (105.2)
Reversal of acquisition-related amortization, depreciation, expense and
(2.2) 0.0 0.0 (2.2)
income accounted for in other operating income (expense)
Adjusted operating profit 597.3 431.3 183.5 1,212.1
as % of sales 23.1% 19.4% 15.5% 20.2%
58
1. Restructuring (€27.9m) and other miscellaneous items (€77.3m).6
APPENDICES
North and
Q1 2019 Rest of
Europe Central Total
(in € millions) the World
America
Net sales 677.0 578.0 295.0 1,550.0
Cost of sales (299.8) (278.7) (167.2) (745.7)
Administrative and selling expenses, R&D costs (220.7) (199.1) (77.3) (497.1)
Reversal of acquisition-related amortization, depreciation, expense and
(2.0) (15.0) (2.3) (19.3)
income accounted for in administrative, selling expenses and R&D costs
Adjusted operating profit before other
158.5 115.2 52.8 326.5
operating income (expense)
as % of sales 23.4% 19.9% 17.9% 21.1%
(1)
Other operating income (expense) (7.5) (11.0) (2.8) (21.3)
Reversal of acquisition-related amortization, depreciation, expense and
0.0 0.0 0.0 0.0
income accounted for in other operating income (expense)
Adjusted operating profit 151.0 104.2 50.0 305.2
as % of sales 22.3% 18.0% 16.9% 19.7%
59
1. Restructuring (€3.3m) and other miscellaneous items (€18.0m).6
APPENDICES
North and
Q1 2018 Rest of
Europe Central Total
(in € millions) the World
America
Net sales 669.3 504.6 271.3 1,445.2
Cost of sales (285.3) (244.6) (147.4) (677.3)
Administrative and selling expenses, R&D costs (219.4) (177.0) (74.5) (470.9)
Reversal of acquisition-related amortization, depreciation, expense and
(2.3) (11.7) (2.6) (16.6)
income accounted for in administrative, selling expenses and R&D costs
Adjusted operating profit before other
166.9 94.7 52.0 313.6
operating income (expense)
as % of sales 24.9% 18.8% 19.2% 21.7%
(1)
Other operating income (expense) (14.9) (4.2) (6.3) (25.4)
Reversal of acquisition-related amortization, depreciation, expense and
(2.2) 0.0 0.0 (2.2)
income accounted for in other operating income (expense)
Adjusted operating profit 154.2 90.5 45.7 290.4
as % of sales 23.0% 17.9% 16.8% 20.1%
60
1. Restructuring (€1.5m) and other miscellaneous items (€23.9m).6
APPENDICES
North and
Q2 2019 Rest of
Europe Central Total
(in € millions) the World
America
Net sales 731.4 633.6 311.8 1,676.8
Cost of sales (319.9) (304.4) (173.4) (797.7)
Administrative and selling expenses, R&D costs (229.3) (208.5) (84.8) (522.6)
Reversal of acquisition-related amortization, depreciation, expense and
(4.2) (14.5) (5.0) (23.7)
income accounted for in administrative, selling expenses and R&D costs
Adjusted operating profit before other
186.4 135.2 58.6 380.2
operating income (expense)
as % of sales 25.5% 21.3% 18.8% 22.7%
(1)
Other operating income (expense) (8.5) (9.3) (5.0) (22.8)
Reversal of acquisition-related amortization, depreciation, expense and
0.0 0.0 0.0 0.0
income accounted for in other operating income (expense)
Adjusted operating profit 177.9 125.9 53.6 357.4
as % of sales 24.3% 19.9% 17.2% 21.3%
61
1. Restructuring (€7.5m) and other miscellaneous items (€15.3m).6
APPENDICES
North and
Q2 2018 Rest of
Europe Central Total
(in € millions) the World
America
Net sales 680.5 565.2 295.9 1,541.6
Cost of sales (293.7) (268.7) (165.9) (728.3)
Administrative and selling expenses, R&D costs (207.4) (191.9) (78.9) (478.2)
Reversal of acquisition-related amortization, depreciation, expense and
(0.6) (13.8) (2.5) (16.9)
income accounted for in administrative, selling expenses and R&D costs
Adjusted operating profit before other
180.0 118.4 53.6 352.0
operating income (expense)
as % of sales 26.5% 20.9% 18.1% 22.8%
(1)
Other operating income (expense) (2.6) (5.5) (9.2) (17.3)
Reversal of acquisition-related amortization, depreciation, expense and
0.0 0.0 0.0 0.0
income accounted for in other operating income (expense)
Adjusted operating profit 177.4 112.9 44.4 334.7
as % of sales 26.1% 20.0% 15.0% 21.7%
62
1. Restructuring (€2.6m) and other miscellaneous items (€14.7m).6
APPENDICES
North and
Q3 2019 Rest of
Europe Central Total
(in € millions) the World
America
Net sales 625.5 723.4 313.2 1,662.1
Cost of sales (277.0) (350.2) (174.8) (802.0)
Administrative and selling expenses, R&D costs (210.3) (232.6) (84.2) (527.1)
Reversal of acquisition-related amortization, depreciation, expense and
(3.8) (17.9) (2.5) (24.2)
income accounted for in administrative, selling expenses and R&D costs
Adjusted operating profit before other
142.0 158.5 56.7 357.2
operating income (expense)
as % of sales 22.7% 21.9% 18.1% 21.5%
(1)
Other operating income (expense) (11.2) (10.0) (0.1) (21.3)
Reversal of acquisition-related amortization, depreciation, expense and
0.0 0.0 0.0 0.0
income accounted for in other operating income (expense)
Adjusted operating profit 130.8 148.5 56.6 335.9
as % of sales 20.9% 20.5% 18.1% 20.2%
63
1. Restructuring (€7.1m) and other miscellaneous items (€14.2m).6
APPENDICES
North and
Q3 2018 Rest of
Europe Central Total
(in € millions) the World
America
Net sales 583.4 580.3 286.9 1,450.6
Cost of sales (258.6) (282.8) (161.3) (702.7)
Administrative and selling expenses, R&D costs (192.3) (188.8) (77.6) (458.7)
Reversal of acquisition-related amortization, depreciation, expense and
(1.8) (13.6) (2.5) (17.9)
income accounted for in administrative, selling expenses and R&D costs
Adjusted operating profit before other
134.3 122.3 50.5 307.1
operating income (expense)
as % of sales 23.0% 21.1% 17.6% 21.2%
(1)
Other operating income (expense) (13.1) (7.2) (4.0) (24.3)
Reversal of acquisition-related amortization, depreciation, expense and
0.0 0.0 0.0 0.0
income accounted for in other operating income (expense)
Adjusted operating profit 121.2 115.1 46.5 282.8
as % of sales 20.8% 19.8% 16.2% 19.5%
64
1. Restructuring (€4.3m) and other miscellaneous items (€20.0m).6
APPENDICES
North and
Q4 2019 Rest of
Europe Central Total
(in € millions) the World
America
Net sales 724.1 667.9 341.4 1,733.4
Cost of sales (333.7) (321.6) (183.8) (839.1)
Administrative and selling expenses, R&D costs (223.2) (220.3) (86.1) (529.6)
Reversal of acquisition-related amortization, depreciation, expense and
(2.5) (16.0) (3.0) (21.5)
income accounted for in administrative, selling expenses and R&D costs
Adjusted operating profit before other
169.7 142.0 74.5 386.2
operating income (expense)
as % of sales 23.4% 21.3% 21.8% 22.3%
(1)
Other operating income (expense) (44.1) (10.0) (4.5) (58.6)
Reversal of acquisition-related amortization, depreciation, expense and
0.0 0.0 0.0 0.0
income accounted for in other operating income (expense)
Adjusted operating profit 125.6 132.0 70.0 327.6
as % of sales 17.3% 19.8% 20.5% 18.9%
65
1. Restructuring (€13.0m) and other miscellaneous items (€45.6m).6
APPENDICES
North and
Q4 2018 Rest of
Europe Central Total
(in € millions) the World
America
Net sales 656.3 573.1 330.4 1,559.8
Cost of sales (299.5) (273.5) (188.4) (761.4)
Administrative and selling expenses, R&D costs (203.7) (188.7) (83.1) (475.5)
Reversal of acquisition-related amortization, depreciation, expense and
(1.4) (14.5) (3.6) (19.5)
income accounted for in administrative, selling expenses and R&D costs
Adjusted operating profit before other
154.5 125.4 62.5 342.4
operating income (expense)
as % of sales 23.5% 21.9% 18.9% 22.0%
(1)
Other operating income (expense) (10.0) (12.6) (15.6) (38.2)
Reversal of acquisition-related amortization, depreciation, expense and
0.0 0.0 0.0 0.0
income accounted for in other operating income (expense)
Adjusted operating profit 144.5 112.8 46.9 304.2
as % of sales 22.0% 19.7% 14.2% 19.5%
66
1. Restructuring (€19.5m) and other miscellaneous items (€18.7m).6
APPENDICES
In € millions 2018 2019
Profit 772.4 836.1
Depreciation, amortization and impairment 209.7 309.4
Changes in other non-current assets and liabilities and long-term deferred taxes 105.8 64.6
Unrealized exchange (gains)/losses 6.3 5.1
(Gains)/losses on sales of assets, net 5.1 5.0
Other adjustments 1.2 1.5
Cash flow from operations 1,100.5 1,221.7
676
APPENDICES
In € millions 2018 2019 % change
Cash flow from operations(1) 1,100.5 1,221.7 +11.0%
as % of sales 18.4% 18.4%
Decrease (Increase) in working capital requirement (175.2) 17.7
Net cash provided from operating activities 925.3 1,239.4 +33.9%
as % of sales 15.4% 18.7%
Capital expenditure (including capitalized development costs) (184.3) (202.2)
Net proceeds from sales of fixed and financial assets 5.3 7.1
Free cash flow 746.3 1,044.3 +39.9%
as % of sales 12.4% 15.8%
Increase (Decrease) in working capital requirement 175.2 (17.7)
(Increase) Decrease in normalized working capital requirement (28.0) (16.8)
Normalized(2) free cash flow 893.5 1,009.8 +13.0%
as % of sales 14.9% 15.2%
1. Cash flow from operations is defined as net cash from operating activities excluding changes in working capital requirement. 68
2. Based on a working capital requirement representing 10% of the last 12 months’ sales, at constant scope of consolidation and exchange rates.6
APPENDICES
2018 Q1 H1 9M FY
Full consolidation method
Modulan Balance sheet only Balance sheet only 6 months 9 months
Gemnet Balance sheet only Balance sheet only 7 months
Shenzhen Clever Electronic Balance sheet only 6 months
Debflex Balance sheet only
Netatmo Balance sheet only
Kenall Balance sheet only
Trical Balance sheet only
696
APPENDICES
2019 Q1 H1 9M FY
Full consolidation method
Modulan 3 months 6 months 9 months 12 months
Gemnet 3 months 6 months 9 months 12 months
Shenzhen Clever Electronic 3 months 6 months 9 months 12 months
Debflex Balance sheet only 6 months 9 months 12 months
Netatmo Balance sheet only 6 months 9 months 12 months
Kenall 3 months 6 months 9 months 12 months
Trical Balance sheet only 6 months 9 months 12 months
Universal Electric Corporation Balance sheet only 6 months 9 months
Connectrac Balance sheet only
Jobo Smartech Balance sheet only
706
APPENDICES
INVESTOR RELATIONS
LEGRAND
Ronan MARC
Tel: +33 (0)1 49 72 53 53
ronan.marc@legrand.fr
PRESS RELATIONS
PUBLICIS CONSULTANTS
Vilizara LAZAROVA
Tel: +33 (0)1 44 82 46 34
Mob: +33 (0)6 26 72 57 14
vilizara.lazarova@consultants.publicis.fr
71The information contained in this presentation has not been independently verified and no representation or warranty expressed or
implied is made as to, and no reliance should be placed on, the fairness, accuracy, completeness or correctness of the information or
opinions contained herein.
This presentation contains information about Legrand’s markets and its competitive position therein. Legrand is not aware of any
authoritative industry or market reports that cover or address its market. Legrand assembles information on its markets through its
subsidiaries, which in turn compile information on its local markets annually from formal and informal contacts with industry
professionals, electrical-product distributors, building statistics, and macroeconomic data. Legrand estimates its position in its markets
based on market data referred to above and on its actual sales in the relevant market for the same period.
This document may contain estimates and/or forward-looking statements. Such statements do not constitute forecasts regarding
Legrand’s results or any other performance indicator, but rather trends or targets, as the case may be. These statements are by their
nature subject to risks and uncertainties, many of which are outside Legrand’s control, including, but not limited to the risks described in
Legrand’s reference document available on its Internet website (www.legrandgroup.com). These statements do not reflect future
performance of Legrand, which may materially differ. Legrand does not undertake to provide updates of these statements to reflect
events that occur or circumstances that arise after the date of this document.
This document does not constitute an offer to sell, or a solicitation of an offer to buy Legrand shares in any jurisdiction.
Unsponsored ADRs
Legrand does not sponsor an American Depositary Receipt (ADR) facility in respect of its shares. Any ADR facility currently in
existence is “unsponsored” and has no ties whatsoever to Legrand. Legrand disclaims any liability in respect of any such facility.
72You can also read