Real implications of Quantitative Easing in the euro area: a complex-network perspective
←
→
Page content transcription
If your browser does not render page correctly, please read the page content below
Real implications of Quantitative Easing in the euro area: a
                                                               complex-network perspective

                                                                          Chiara Perilloa,∗, Stefano Battistona
                                                     a
                                                         University of Zurich, Department of Banking and Finance, Zurich, Switzerland
arXiv:2004.09418v1 [econ.GN] 2 Apr 2020

                                          Abstract
                                              The long-lasting socio-economic impact of the global financial crisis has questioned the
                                          adequacy of traditional tools in explaining periods of financial distress, as well as the ade-
                                          quacy of the existing policy response. In particular, the effect of complex interconnections
                                          among financial institutions on financial stability has been widely recognized. A recent
                                          debate focused on the effects of unconventional policies aimed at achieving both price and
                                          financial stability. In particular, Quantitative Easing (QE, i.e., the large-scale asset pur-
                                          chase programme conducted by a central bank upon the creation of new money) has been
                                          recently implemented by the European Central Bank (ECB). In this context, two ques-
                                          tions deserve more attention in the literature. First, to what extent, by injecting liquidity,
                                          the QE may alter the bank-firm lending level and stimulate the real economy. Second, to
                                          what extent the QE may also alter the pattern of intra-financial exposures among finan-
                                          cial actors (including banks, investment funds, insurance corporations, and pension funds)
                                          and what are the implications in terms of financial stability. Here, we address these two
                                          questions by developing a methodology to map the macro-network of financial exposures
                                          among institutional sectors across financial instruments (e.g., equity, bonds, and loans) and
                                          we illustrate our approach on recently available data (i.e., data on loans and private and
                                          public securities purchased within the QE). We then test the effect of the implementation
                                          of ECB’s QE on the time evolution of the financial linkages in the macro-network of the
                                          euro area, as well as the effect on macroeconomic variables, such as output and prices.
                                          Keywords: Unconventional monetary policy, Expanded Asset Purchase Programme,
                                          Quantitative Easing, real economy, financial stability, macro-network, financial networks.

                                            ∗
                                              Corresponding author
                                              Email addresses: chiara.perillo@bf.uzh.ch (Chiara Perillo), stefano.battiston@bf.uzh.ch
                                          (Stefano Battiston)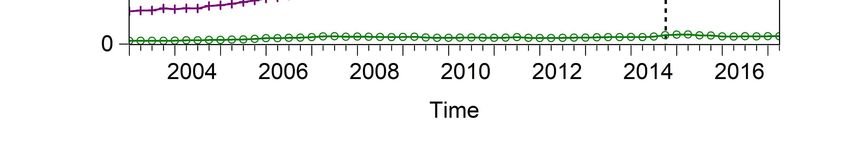
1. Introduction

    In the wake of the last wave of globalization, associated with the process of liberal-
ization and financial integration, the last decades have witnessed the increase of financial
interactions among the different actors of the global economy through different financial
instruments. A large part of these interactions is intra-financial [1], i.e., a great portion of
banks’ financial contracts has as a counterparty another bank or, more in general, another
financial institution (e.g., investment funds, insurance corporations, and pension funds).
As a consequence, before and during the global financial crisis, a large fraction of bank as-
sets was intra-financial and this situation has continued after the crisis [2]. The 2007-2008
crisis has shown that these intra-financial linkages represent a mechanism for the propa-
gation of financial distress and they may lead to the amplification of small shocks [3, 4].
Consequently, intra-financial interconnectedness is nowadays recognized as one of the key
elements of potential financial instability or systemic risk (i.e., the risk of default of a large
portion of the financial system) [5, 6].
    This fact, along with the long-lasting socio-economic impact of the financial crisis,
has constituted the main impetus for a conversation about the adequacy of the existing
tools in explaining and predicting periods of financial distress, as well as the adequacy
of the existing policy response. In particular, a recent debate focused on the adoption,
implementation, and effectiveness of unconventional policy tools, aimed at achieving both
price and financial stability [7, 8, 9, 10]. Among these unconventional policy tools, the
expanded Asset Purchase Programme (APP) has been recently implemented by the Eu-
ropean Central Bank (ECB). This large-scale purchase programme encompasses the set
of measures that are commonly known as Quantitative Easing (QE). Indeed, the APP
includes all purchase programmes under which private and public sector securities are pur-
chased by the Eurosystem in an attempt to sustain inflation [11]. In particular, the APP,
announced on January 2015, encompasses the existing i) third covered bond purchase pro-
gramme (CBPP3) (started on 20 October 2014), and ii) asset-backed securities purchase
programme (ABSPP) (started on 21 November 2014), combining them with the new iii)
public sector purchase programme (PSPP) (started on 9 March 2015), and iv) corporate
sector purchase programme (CSPP) (started on 8 June 2016) [12]. Monthly net purchases
of public and private sector securities amount to 60 billion euros on average and they are
intended to be carried out until the end of 2017, conditionally to a sustained adjustment in
below, but close to, 2% over the medium term [11]. The large majority of these purchases
is made under the PSPP, which consists in the massive net acquisition of public sector
securities by the Eurosystem from the banking system on the secondary market against
central bank money [13].
    The large-scale purchases imply the increase in the prices of the purchased assets and
the provision of liquidity to the banking system. As a consequence, a wide range of interest
rates fall and loans become cheaper [14]. Therefore, on the loans’ demand side, firms and
households may be able to borrow more and spend less to repay their debts, while, on the

                                                2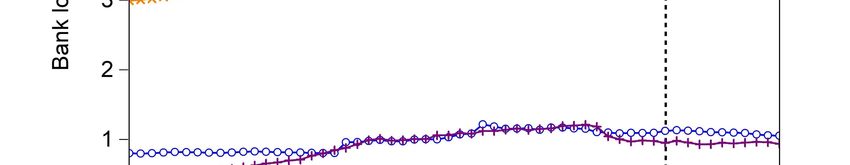
supply side, the availability of new liquidity may stimulate bank lending activity. Conse-
quently, the QE may generate the increase in bank loans to the real economy. However,
the QE does not necessarily imply that the money received by banks is going to be lent
to the real economy. In fact, on the one hand, businesses and households could be not
willing or able to borrow more from banks. On the other hand, banks could either decide
to i) keep the money in the form of deposits at the Eurosystem (with low or even negative
remuneration rate, but risk-free), or ii) invest it in the stock market (whose returns may
be more appealing compared to the decreased returns of the securities purchased under
the APP), as well as iii) increase the intra-financial interactions via different financial in-
struments (e.g., by increasing intra-financial loans). This may lead to the alteration of the
pattern of intra-financial exposures among financial actors (including banks, investment
funds, insurance corporations, and pension funds) with potential implications in terms of
financial stability.
    Despite there having been some efforts in the recent macro-econometric literature to
investigate the effects of unconventional monetary measures, the exploration of the real
implications of the recently implemented QE from a complex-network perspective would be
of great importance. In particular, a financial network analysis would allow to account for
the complex intra-financial interconnections and their potential effect on financial stability,
neglected by traditional tools. Network theory has been widely applied in the financial
domain to provide useful insights and predictions on the interconnectivity of the financial
system and on the propagation of shocks, especially with reference to the banking sector
[15, 16, 17, 18, 19]. However, less attention has been devoted to the study of the interplay
between monetary policy, macroeconomic variables, and network of financial exposures,
able to take into account both the interactions between the real and financial sector and
intra-financial interconnectedness. In particular, in the light of the above context, two
fundamental questions deserve more attention in the literature:

  1. To what extent, by injecting liquidity, does the QE alter the bank-firm lending level
     and stimulate the real economy?

  2. To what extent, does the QE also alter the pattern of intra-financial exposures among
     financial actors and what are the implications in terms of financial stability?

    Here, we address these two questions and investigate the real implications of ECB’s
QE, by taking a complex-network perspective to unconventional monetary policy. In par-
ticular, first, we develop a methodology to map the macro-network of financial exposures
among the different institutional sectors operating in the euro area (i.e., Monetary Fi-
nancial Institutions, Insurance Corporations and Pension Funds, Financial Corporations
excluding Monetary Financial Institutions and Insurance Corporations and Pension Funds,
Households and Non-Profit Institutions Serving Households, Non-Financial Corporations,
and General Governments). This macro-network can be regarded as a multiplex weighted
network in which multiple types of links correspond to different financial instruments (e.g.,

                                              3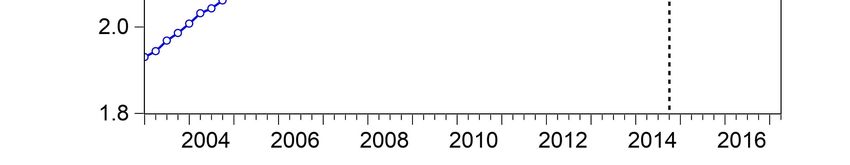
equity holdings, corporate and sovereign bonds, and loans). Second, we illustrate our ap-
proach on recently available data, with a particular focus on i) loans granted by banks
to the institutional sectors operating in the euro area and ii) private and public securities
purchased by the Eurosystem from euro area banks within the APP. Third, we investi-
gate the time evolution of the financial linkages in the macro-network of the euro area,
as well as the time evolution of macroeconomic variables, such as output and prices, since
the implementation of ECB’s QE. In particular, in an attempt to assess the transmission
of this unconventional monetary measure to the real economy through the bank-lending
channel (which focuses on the quantity of loans supplied by banks), we estimate the time
evolution of the exposure of the banking system to the real economy through loans. Fur-
ther, we investigate the intra-financial interactions in the euro area, by focusing on the
estimate of the time evolution of the banking system’s exposure to the financial sector via
loans, since the initiation of the APP. Finally, we assess the effects of QE on the time
evolution of Gross Domestic Product (GDP) and Harmonised Index of Consumer Prices
(HICP). The combination of network variables (i.e., time series of financial exposures) and
macroeconomic variables allows us to shed light on the implications of QE both in terms
of stimulation of the real economy and intra-financial interconnectedness. This approach
represents a tangible step ahead in the comprehensive analysis of the effects of unconven-
tional monetary policy that until now involved macroeconomic implications or the impact
on financial markets, neglecting network effects and their interplay with macroeconomic
variables.
    The remainder of this paper is organized as follows. In Section 2, we introduce the
methodology that we developed to map the macro-network of financial exposures among
the different institutional sectors operating in the euro area and we illustrate the employed
data and sources. In Section 3, we illustrate the exploratory results both from a static and
a dynamic perspective. Finally, Section 4 concludes the paper.

2. Methodology and data

2.1. Institutional sectors
    We consider the euro area economy as composed by three main macro sectors: i)
the financial sector, ii) the non-financial private sector (or the real sector), and iii) the
non-financial public sector. The financial sector includes the following institutional sec-
tors: i) Monetary Financial Institutions (MFI), ii) Insurance Corporations and Pension
Funds (IC&PF), iii) Financial Corporations excluding MFI and IC&PF (FC excl. MFI
and IC&PF). More specifically, Monetary Financial Institutions encompass i) the Eu-
rosystem, i.e., the European Central Bank and the National Central Banks (ECB&NCB)
of the nineteen countries that have adopted the euro in stage three of Economic and Mon-

                                             4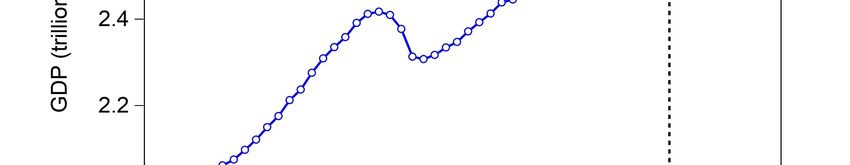
Table 1: The euro area macro sectors and their breakdown by institutional sector

  Macro sectors                    Institutional sectors             Acronym
  Financial sector                 Monetary Financial In-            MFI (ECB&NCB + MFI
                                   stitutions     (Eurosystem        excl. ECB&NCB)
                                   + Monetary Financial
                                   Institutions excluding the
                                   Eurosystem)
                                   Insurance      Corporations       IC&PF
                                   and Pension Funds
                                   Financial Corporations ex-        FC excl. MFI and IC&PF
                                   cluding MFI and IC&PF
  Non-financial private sec-       Households and Non-Profit         HH&NPISH
  tor (or real sector)             Institutions Serving House-
                                   holds
                                   Non-Financial      Corpora-       NFC
                                   tions
  Non-financial public sector      General Governments               GG

etary Union (EMU)1 , and ii) Monetary Financial Institutions excluding the Eurosystem
(MFI excl. ECB&NCB), broadly equivalent to banks and money market funds. Further,
Financial Corporations excluding MFI and IC&PF include i) investment banks other than
money market funds, ii) other financial intermediaries different from IC&PF, iii) financial
auxiliaries, and iv) captive financial institutions and money lenders. As regards the real
sector, it encompasses the institutional sectors i) Households and Non-Profit Institutions
Serving Households (HH&NPISH), and ii) Non-Financial Corporations (NFC). Finally,
the non-financial public sector could be identified with General Governments (GG), which
comprise central, state (regional) and local government and social security funds [20]. The
macro sectors considered in our study and their breakdown by institutional sector with
relative acronyms are summarized in Table 1.

2.2. Methodology
    We regard the euro area economy as a macro-network of financial exposures, where
nodes are the aforementioned institutional sectors (summarized in Table 1). Despite the
fact that every node of the macro-network is represented at an aggregate level, it is worth

  1
    The European Union’s Member States that have adopted the euro in stage three of EMU are Austria,
Belgium, Cyprus, Estonia, Finland, France, Germany, Greece, Ireland, Italy, Latvia, Lithuania, Luxem-
bourg, Malta, Netherlands, Portugal, Slovakia, Slovenia, and Spain.

                                                  5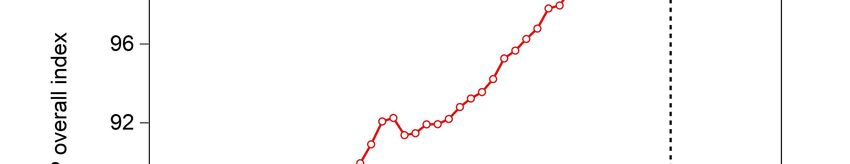
mentioning that each node is the result of an aggregation on two dimensions: by country
and by sector. More specifically, the euro area macro-network of financial exposures in-
cludes the nineteen macro-networks of financial exposures among the institutional sectors
operating in the nineteen European Union’s Member States belonging to the Eurozone and
their mutual interactions. Further, every node of the macro-network should be regarded
as a network of micro-based granular financial exposures among the different institutions
operating within every institutional sector. The euro area macro-network of financial ex-
posures can be regarded as a multiplex weighted network in which multiple types of links
correspond to different financial instruments (e.g., loans, corporate and sovereign bonds,
and equity). Links follow the direction of the money and weights correspond to the balance
sheet outstanding amount at the end of the period (stocks) of the financial exposures ex-
isting among the different institutional sectors through the different financial instruments.

2.3. Variables
    The empirical analysis has been conducted with regard to the period spanning from
the first quarter of 2003 to the second quarter of 2017 (2003Q1-2017Q2, both quarters
included), considering six institutional sectors operating in the euro area (i.e., Monetary
Financial Institutions (MFI), composed by Eurosystem (ECB&NCB) and Monetary Fi-
nancial Institutions excluding the Eurosystem (MFI excl. ECB&NCB), Insurance Corpo-
rations and Pension Funds (IC&PF), Financial Corporations excluding MFI and IC&PF
(FC excl. MFI and IC&PF), Households and Non-Profit Institutions Serving Households
(HH&NPISH), Non-Financial Corporations (NFC), and General Governments (GG)). Our
study focuses on two categories of variables: i) network variables and ii) macroeconomic
variables. We define network variables as the time series of financial exposures through
which institutional sectors are tied to each other. In particular, our work focuses on the
time evolution of the financial link between the Eurosystem and the banking system via
APP securities, existing as a consequence of the APP purchases of public and private se-
curities that imply an injection of money into the banking system. Furthermore, we focus
on the time series of the financial dependencies via loans between the euro area bank-
ing sector and financial sector (Loans from MFI excl. ECB&NCB to MFI, Loans from
MFI excl. ECB&NCB to IC&PF, Loans from MFI excl. ECB&NCB to FC excl. MFI
and IC&PF), real sector (Loans from MFI excl. ECB&NCB to HH&NPISH, Loans from
MFI excl. ECB&NCB to NFC), and public sector (Loans from MFI excl. ECB&NCB to
GG). As regards the macroeconomic variables, our study focuses on the time evolution of
the euro area Gross Domestic Product (GDP) and Harmonised Index of Consumer Prices
(HICP).
    Regarding the variable APP securities, we consider the quarterly data derived as end-of-
the quarter monthly data of the Eurosystem APP holdings and a breakdown in the different
programmes included in the APP: i) third covered bond purchase programme (CBPP3),
ii) asset-backed securities purchase programme (ABSPP), iii) public sector purchase pro-
gramme (PSPP), and iv) corporate sector purchase programme (CSPP). The time series of

                                             6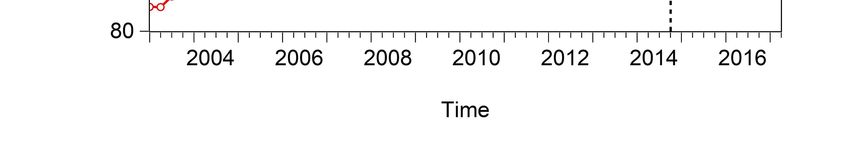
the cumulative purchase breakdowns under the APP have been obtained from [11]2 . The
APP holdings refer to private and public sector securities purchased by the Eurosystem
within the APP in order to address the risk of a too prolonged period of low inflation
[11]. In particular, the purchased securities include: i) covered bonds (purchased under
the CBPP3), ii) asset-backed securities (purchased under the ABSPP), iii) nominal and
inflation-linked central government bonds (purchased under the PSPP), iv) bonds issued
by recognized agencies, regional and local governments, international organizations, and
multilateral development banks located in the euro area (purchased under the PSPP), and
v) corporate sector bonds (purchased under the CSPP) [11]. These purchases increase the
Eurosystem holdings of the aforementioned marketable debt instruments and particularly
the purchases made within the CBPP3, ABSPP, and PSPP imply an injection of liquidity
into the banking system [11].
    As regards the loans from the banking sector to the financial sector, the real sector
and the public sector, the time series of the variables Loans from MFI excl. ECB&NCB
to MFI, Loans from MFI excl. ECB&NCB to IC&PF, Loans from MFI excl. ECB&NCB
to FC excl. MFI and IC&PF, Loans from MFI excl. ECB&NCB to HH&NPISH3 , Loans
from MFI excl. ECB&NCB to NFC, and Loans from MFI excl. ECB&NCB to GG have
been obtained from ECB Statistical Data Warehouse [21]. The aforementioned variables
are derived as end-of-quarter monthly data of the balance sheet outstanding amounts of
loans granted by MFI excl. ECB&NCB to the different institutional sectors operating in
the euro area and the resulting series have been seasonally and working day adjusted.
    Finally, regarding the macroeconomic variables, Gross Domestic Product (GDP) at
market prices and Harmonised Consumer Price Index (HICP) (2015=100) have been ob-
tained from [21]. According to the European System of National and Regional Accounts
(ESA 2010), the GDP at market prices can be defined as the final result of the production
activity of resident producer units [22], while the HICP is a “Laspeyres-type price index”,
defined in terms of household final monetary consumption expenditure [23]. The GDP
series is chain-linked volume and the HICP variable is derived as end-of-quarter monthly
data. Both GDP and HICP time series are working day and seasonally adjusted.

3. Exploratory results

    In an attempt to investigate i) to what extent the QE may alter the bank-firm lending
level and stimulate the real economy and ii) to what extent it may also alter the intra-
financial interactions, for example, via the increase of intra-financial loans, first, we map
the euro area macro-network of financial exposures. Figure 1 illustrates the macro-network

   2
    Please note that all data sources in this paper have been last accessed on 19 July 2017.
   3
    Loans from MFI excl. ECB&NCB to households include: i) credit for consumption, ii) lending for house
purchase, and iii) other lending. The time series of the breakdowns of loans into the three aforementioned
categories can be taken from [21].

                                                    7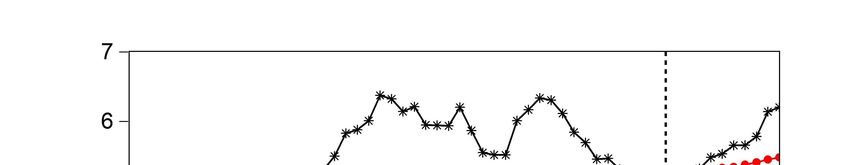
of financial exposures among the different institutional sectors operating in the euro area,
with reference to the second quarter of 2017. In particular, our main focus is on two
financial instruments: i) the private and public securities purchased by the Eurosystem
from the banking system within the APP (represented with a blue arrow) and ii) the loans
granted from the banking sector to the institutional sectors operating in the euro area
(represented with red arrows). As it can be seen from Figure 1, the arrows follow the
direction of the money. The numbers correspond to the balance sheet outstanding amount
at the end of the period (stocks) of i) APP holdings of the Eurosystem related to the asset
purchases made within the CBPP3, ABSPP, and PSPP and ii) loans granted by the euro
area MFI excl. ECB&NCB. Moreover, in order to give a clearer idea of the weight of every
link in terms of asset size of the banking system, we also express loan and APP exposures
as a percentage of total assets of the euro area banking system.
    As shown in Figure 1, the injection of money by the Eurosystem to the banking sector
(blue arrow) corresponds to 6% of the total assets of the euro area MFI excl. ECB&NCB.
As regards loans (red links), it is worth mentioning that, at the end of June 2017, 20%
of the euro area banks’ assets were bank-to-bank loans, while around 18% were loans to
households, followed by bank-firm loans, corresponding approximatively to 14% of banks’
assets. Therefore, from the macro-network analysis we can notice that, despite the fact
that a large fraction of loans is intra-financial (i.e., 23.38% of banks’ total assets), a relevant
fraction of loans is granted by the banking sector to the real sector (corresponding to 31.56%
of banks’ total assets). However, the macro-network methodology provides us only with a
static picture of the financial dependencies existing between the euro area banking sector
and the other euro area institutional sectors. For this reason, we decided to investigate
the time evolution of the financial linkages in the macro-network of the euro area, as well
as the time evolution of the macroeconomic variables output (GDP) and prices (HICP),
since the implementation of ECB’s QE, able to provide us with further insights.
    In particular, Figure 2 represents the time evolution of loans granted by banks to
the different institutional sectors operating in the euro area, over the reference period
2003Q1-2017Q2. As it can be seen from Figure 2, the time series of bank-to-bank loans
is represented in black, while the time series of loans granted from the banking sector
to households is represented in red, and the time series of bank-firm loans is represented
in orange. Further, the time series of loans granted by the banking sector to General
Governments, Financial Corporations excl. MFI and IC&PF, and Insurance Corporations
and Pension Funds are represented in blue, purple, and green, respectively. The vertical
dashed line corresponds to the beginning of the first purchase programme included in
the APP, started on 20 October 2014. On the right-hand side of Figure 2 we reported
our estimate of the growth rate of loans granted by banks to the different institutional
sectors of the euro area, since the initiation of QE. Regarding the loans’ growth rates, it
is worth mentioning that, since QE has been initiated, bank-to-bank loans have increased
by 19.19%, while loans to households have grown by 5.48%, and bank-firm loans only by
0.27%. Consequently, the empirical evidence provided by data on loans allows us to state

                                                8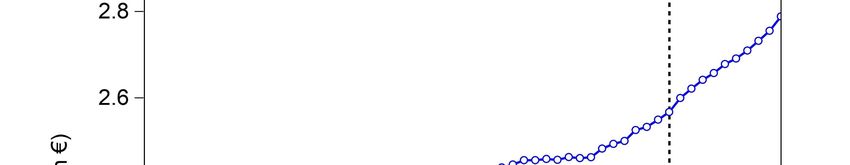
Eurosystem
            Financial
                                             (ECB&NCB)                                               General
          Corporations                                                                             Governments
       excluding MFI and
                                         Monetary Financial                          1.86 T
                                                                                      6%              (GG)
              IC&PF                        Institutions
        (FC excl. MFI and                     (MFI)
             IC&PF)             6.21 T
                                 20 %      Monetary Financial                             1.05 T
                                                                                          3.39 %
                                         Institutions excluding                                        Non-Financial
                                               Eurosystem                                              Corporations
                                0.94 T
                                3.02 %    (MFI excl. ECB&NCB)                          4.31 T             (NFC)
                                             TOTAL ASSETS: 31.03 T                    13.89 %

           Insurance                                                 5.48 T
         Corporations       0.11 T                                   17.67 %    Households and
                            0.36 %
           & Pension                                                                Non-Profit
         Funds (IC&PF)                                                         Insitutions Serving
                                                                                   Households                 Loans
                                                                                                              APP securities
                                                                                  (HH&NPISH)

Figure 1: The macro-network of financial exposures in the euro area - June 2017. Macro-network of
financial exposures among the different institutional sectors operating in the euro area (i.e., Monetary
Financial Institutions (MFI), composed by Eurosystem (ECB&NCB) and Monetary Financial Institutions
excluding the Eurosystem (MFI excl. ECB&NCB), Insurance Corporations and Pension Funds (IC&PF),
Financial Corporations excluding MFI and IC&PF (FC excl. MFI and IC&PF), Households and Non-
Profit Institutions Serving Households (HH&NPISH), Non-Financial Corporations (NFC), and General
Governments (GG)), via i) private and public securities purchased by the Eurosystem from the banking
system within the APP (blue link) and ii) loans granted from the banking sector to the institutional sectors
operating in the euro area (red links), with reference to the second quarter of 2017. Data source: [21].

that, since QE, there has been an increase in bank lending activity at an aggregate level,
but mostly addressed to the banking system itself.

                                                           9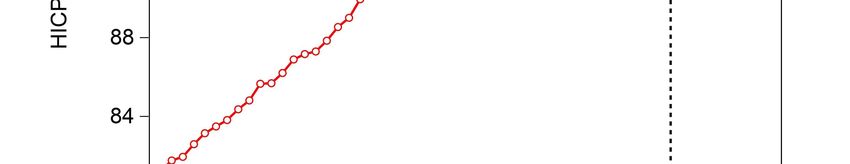
+ 19.19 %
+ 5.48 %
+ 0.27 %
On 20th October 2014, the first
purchase programme included
in the APP started
- 3.91 %
- 4.12 %
+ 4.75 %
Figure 2: Euro area bank loans - breakdown by institutional sector. Time series over the reference period
2003Q1-2017Q2 of the breakdown of loans granted by euro area banks to: i) Monetary Financial Institutions
(MFI, in black), ii) Households and Non-Profit Institutions Serving Households (HH&NPISH, in red),
iii) Non-Financial Corporations (NFC, in orange), iv) General Governments (GG, in blue), v) Insurance
Corporations and Pension Funds (IC&PF, in green), and vi) Financial Corporations excluding MFI and
IC&PF (FC excl. MFI and IC&PF, in purple). The vertical dashed line corresponds to the beginning
of the first purchase programme (third covered bond purchase programme, CBPP3) included in the APP,
started on 20 October 2014, while the percentages on the right-hand side of the graph correspond to our
estimate of the growth rates of loans granted by banks to the different institutional sectors of the euro area,
since the initiation of QE. Data source: [21].
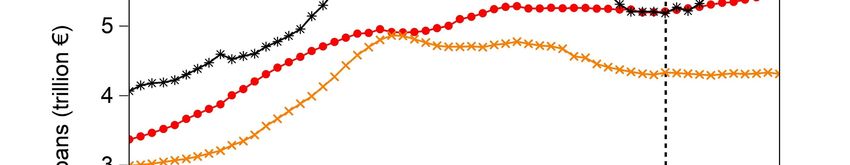
Further, Figures 3 and 4 represent the time evolution of the euro area macroeconomic
variables Gross Domestic Product (GDP) at market prices and Harmonised Consumer
Price Index (HICP), respectively, over the reference period 2003Q1-2017Q2. As it can be
seen from Figures 3 and 4, the time series of GDP is represented in blue, while the time
series of HICP is represented in red. The vertical dashed line corresponds to the beginning
of the first purchase programme included in the APP, started on 20 October 2014. On the
10right-hand side of Figures 3 and 4 we reported our estimate of the growth rate of both
GDP and HICP, since the initiation of QE. In this regard, it is worth noting that, since
the APP programme has been implemented, both GDP and inflation have increased. In
particular, the GDP has grown by 9.38%, while the HICP has increased by 1.44%.
+ 9.38 %
On 20th October 2014, the first
purchase programme included
in the APP started
Figure 3: Euro area GDP. Time series of the euro area Gross Domestic Product (GDP) at market prices,
over the reference period 2003Q1-2017Q2. The vertical dashed line corresponds to the beginning of the first
purchase programme (third covered bond purchase programme, CBPP3) included in the APP, started on
20 October 2014, while the percentage on the right-hand side of the graph corresponds to our estimate of
the growth rate of the euro area GDP, since the initiation of QE. Data source: [21].
11+ 1.44 %
On 20th October 2014, the first
purchase programme included
in the APP started
Figure 4: Euro area HICP. Time series of the Harmonised Consumer Price Index (HICP), over the refer-
ence period 2003Q1-2017Q2. The vertical dashed line corresponds to the beginning of the first purchase
programme (third covered bond purchase programme, CBPP3) included in the APP, started on 20 October
2014, while the percentage on the right-hand side of the graph corresponds to our estimate of the growth
rate of the euro area HICP, since the initiation of QE. Data source: [21].
4. Conclusions
In this paper, we have conducted an empirical explorative analysis to study the real
implications of ECB’s QE in an attempt to investigate i) to what extent the QE may alter
the bank-firm lending level and stimulate the real economy and ii) to what extent it may
also alter the intra-financial interactions, for example, via the increase of intra-financial
loans. Our empirical results constitute a contribution to the debate on the effectiveness of
unconventional policy tools, aimed at achieving both price and financial stability, as they
reveal two important findings. First, since the implementation of QE, there has been an
increase in bank lending activity. Second, this increase in bank loans is mostly due to the
increase in the bank-to-bank lending level, rather than the bank-firm lending level. This
fact is consistent with the process of progressive financialization of the economy that has
been experienced in the last decades. This process, along with the evolution of markets
12as “markets for intermediaries rather than individuals or firms” [24], has implied that a
large portion of financial interactions (via financial instruments) is intra-financial and only
a small fraction of them is between financial system and real economy. This constitutes a
particular concern in Europe, where the productive structure is mainly based on unlisted
small and medium enterprises, which rely on the banking system, rather than on markets,
to obtain funding. However, as in most serious debates, the truth lies somewhere in the
middle. In fact, our explorative analysis also reveals that, since the implementation of
APP, there has been an increase in both GDP and inflation. In a nutshell, our research has
brought to light some important facts with regard to the effects of Quantitative Easing in
the euro area. On the one hand, since the beginning of QE, there has not been a significant
increase in bank-firm lending level, while, on the other hand, the overall euro area economy
is experiencing growth and addressing the risk of deflation.
Acknowledgement
This work has been supported by the research project BigDataFinance. BigDataFi-
nance project has received funding from the European Union’s Horizon 2020 research and
innovation programme under the Marie Sklodowska-Curie grant agreement No 675044.
References
[1] M. D’Errico and T. Roukny, “Compressing over-the-counter markets.” Available at
SSRN: https://ssrn.com/abstract=2962575, 2017.
[2] M. Allahrakha, P. Glasserman, H. P. Young, et al., Systemic importance indicators
for 33 US bank holding companies: an overview of recent data. Office of Financial
Research, 2015.
[3] M. Bardoscia, S. Battiston, F. Caccioli, and G. Caldarelli, “DebtRank: A microscopic
foundation for shock propagation,” PloS one, vol. 10, no. 6, p. e0130406, 2015.
[4] S. Battiston, M. D’Errico, and G. Visentin, “Rethinking financial contagion,” Preprint
at http://ssrn.com/abstract=2831143, 2016.
[5] S. Battiston, G. Caldarelli, and M. D’Errico, “The financial system as a nexus of
interconnected networks,” in Interconnected networks, pp. 195–229, Springer, 2016.
[6] T. Roukny, S. Battiston, and J. E. Stiglitz, “Interconnectedness as a source of uncer-
tainty in systemic risk,” Journal of Financial Stability, 2016.
[7] L. Balasubramanyan and D. D. VanHoose, “Bank balance sheet dynamics under a
regulatory liquidity-coverage-ratio constraint,” Journal of Macroeconomics, vol. 37,
pp. 53–67, 2013.
13[8] S. Claessens, S. R. Ghosh, and R. Mihet, “Macro-prudential policies to mitigate fi-
nancial system vulnerabilities,” Journal of International Money and Finance, vol. 39,
pp. 153–185, 2013.
[9] S. Aiyar, C. W. Calomiris, and T. Wieladek, “Does Macro-Prudential Regulation
Leak? Evidence from a UK Policy Experiment,” Journal of Money, Credit and Bank-
ing, vol. 46, no. s1, pp. 181–214, 2014.
[10] L. Popoyan, M. Napoletano, and A. Roventini, “Taming macroeconomic instability:
Monetary and macro-prudential policy interactions in an agent-based model,” Journal
of Economic Behavior & Organization, vol. 134, pp. 117–140, 2017.
[11] European Central Bank, “Asset purchase programmes.” http://www.ecb.europa.eu/
mopo/implement/omt/html/index.en.html, 2017.
[12] L. Gambetti and A. Musso, “The macroeconomic impact of the ECB’s expanded asset
purchase programme (APP),” ECB Working Paper, 2017.
[13] European Central Bank, “Press release - ECB announces expanded as-
set purchase programme.” https://www.ecb.europa.eu/press/pr/date/2015/html/
pr150122 1.en.html, January 2015.
[14] European Central Bank, “How quantitative easing works.” https://
www.ecb.europa.eu/explainers/show-me/html/app infographic.en.html, 2017.
[15] L. Eisenberg and T. H. Noe, “Systemic risk in financial systems,” Management Science,
vol. 47, no. 2, pp. 236–249, 2001.
[16] H. Elsinger, A. Lehar, and M. Summer, “Risk assessment for banking systems,” Man-
agement science, vol. 52, no. 9, pp. 1301–1314, 2006.
[17] S. Battiston, M. Puliga, R. Kaushik, P. Tasca, and G. Caldarelli, “Debtrank: Too
central to fail? financial networks, the fed and systemic risk,” Scientific reports, vol. 2,
p. srep00541, 2012.
[18] T. Roukny, H. Bersini, H. Pirotte, G. Caldarelli, and S. Battiston, “Default cascades
in complex networks: Topology and systemic risk,” Scientific reports, vol. 3, 2013.
[19] S. Battiston, G. Caldarelli, M. D’Errico, and S. Gurciullo, “Leveraging the network:
a stress-test framework based on DebtRank,” Statistics & Risk Modeling, vol. 33,
no. 3-4, pp. 117–138, 2016.
[20] European Commission (ESA2010, “Institutional sectors.” http://ec.europa.eu/
eurostat/web/sector-accounts/concepts/institutional-sectors, 2017.
14[21] European Central Bank, “ECB Statistical Data Warehouse.” http:
//sdw.ecb.europa.eu/, 2017.
[22] Eurostat, “Gross domestic product, volumes.” http://ec.europa.eu/eurostat/en/
web/products-datasets/-/TEINA011, 2017.
[23] European Commission, Eurostat, “Harmonized Indices of Consumer Prices
(HICPs), A Short Guide for Users.” http://ec.europa.eu/eurostat/
documents/3859598/5884877/KS-BE-04-001-EN.PDF/0051a64b-490c-4fd7-8bf1-
1dcae31f4970?version=1.0, 2004. [last updated date: March 2004].
[24] F. Allen and A. M. Santomero, “What do financial intermediaries do?,” Journal of
Banking & Finance, vol. 25, no. 2, pp. 271–294, 2001.
15You can also read