DAMAGE TO CONCRETE STRUCTURES FROM THE 2010 DARFIELD (CANTERBURY, NZ) EARTHQUAKE
←
→
Page content transcription
If your browser does not render page correctly, please read the page content below
DAMAGE TO CONCRETE STRUCTURES FROM THE 2010 DARFIELD (CANTERBURY, NZ)
                               EARTHQUAKE
                                      Jason Ingham*, Liam Wotherspoon**, Lucas Hogan*** and Bilel Ragued***

                                                                       ABSTRACT
The 2010 M7.1 Darfield earthquake was the largest natural disaster to occur in New Zealand since the 1931 Hawke’s Bay earthquake and
caused extensive liquefaction and ground spreading, which led to damage to a large number of residential buildings. This damage was
particularly significant because of the number of families that had to evacuate their homes, and because of the extensive cost of remediation
to these homes. Underground concrete water and wastewater services were significantly damaged, and concerns were raised that water
supplies were contaminated, such that bottled water was necessary. Extensive damage occurred to many unreinforced masonry buildings,
but damage to concrete buildings was minor, and was attributed to poor seismic detailing. Damage to concrete bridges was primarily
associated with spreading of bridge abutments and damage to bridge approaches, and only eight vehicle bridges were closed. Damage to
the concrete wharfs at Lyttelton Port was also primarily attributable to ground spreading, and whilst remediation will be expensive, the port
was able to remain fully operational. Overall, concrete structures performed very well in the earthquake.

1.       Introduction

At 4.35 am on the morning of Saturday the 4th of September 2010 a magnitude
7.1 earthquake occurred approximately 40 km west of the city of Christchurch,
New Zealand (see Fig. 1) at a depth of about 10 km (GNS 2010), having an
epicentre located near the town of Darfield. The main shock was followed by
numerous aftershocks throughout the Canterbury region (see Fig. 2), with at
least one shallow aftershock located near Christchurch city causing further
damage to several buildings. The earthquake ground motion had a peak
ground acceleration of about 0.25g and a spectral acceleration in the plateau
region of about 0.75g that corresponds well with the design spectra for a site
class D soil site in Christchurch for spectral periods greater than 0.2 seconds.
In general, the earthquake represented 67-100% of the design level event,
depending upon the spectral period being considered (see Fig. 3), with most of
Canterbury reporting damage consistent with MM8 on the Modified Mercalli
intensity scale. Hence, significant damage to earthquake prone buildings and
to non-structural components might have been expected, with associated
                                                                                                      Figure 1. Earthquake epicenter (USGS)
fatalities and major casualties. Instead, the single most striking statistic was
that there were no fatalities directly associated with the earthquake (although
there was one heart attack fatality and one person hospitalised due to a falling
chimney (NZ Herald 2010a)), and the overall impression is that damage in the
central business district (CBD) was reasonably contained, restricted primarily
to unreinforced masonry (URM) buildings and damage to windows in taller
steel and concrete structures. The absence of fatalities and more extensive
damage is attributed to the comparatively high level of seismic design
capability in New Zealand, and the fact that the CBD was almost completely
unoccupied at 4.35 am.

                                                                                                  Figure 2. Distribution of aftershocks (GeoNet)

*
    Associate Professor, Dept. of Civil and Environmental Engineering, The University of Auckland, New Zealand; j.ingham@auckland.ac.nz.
**
     Research Fellow, Dept. of Civil and Environmental Engineering, The University of Auckland, New Zealand.
***
      Doctoral researcher, Dept. of Civil and Environmental Engineering, The University of Auckland, New Zealand.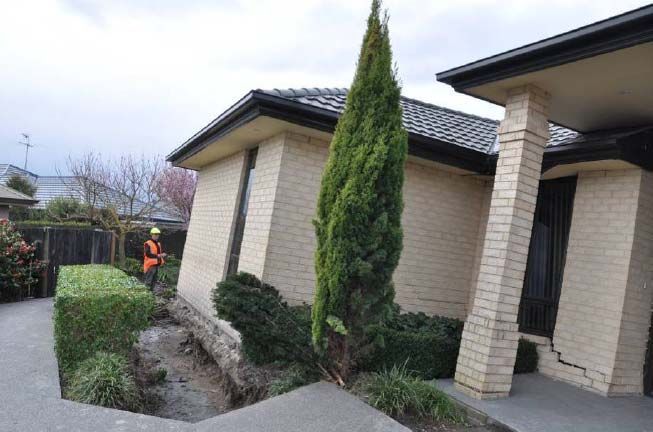
N26W component – Cathedral College site
1.0
0.30
Acceleration(g)
NZS1170 Class D Deep or Soft Soil
Median of Soft Soil Sites
N26W
0.15
Botanical Gardens CBGS-H1
5% damped Response Spectrum
0.8 Botanical Gardens CBGS-H2 0
Cathedral Collage CCCC-H1
Cathedral Collage CCCC-H2 -0.15
Hospital CHHC-H1
0.6 Hospital CHHC-H2 -0.30
0 10 20 30 40 50 60
Acceleration (g)
Time(s)
0.4 N64E component – Cathedral College site
0.30
Acceleration(g)
0.2 N64E
0.15
0
0 -0.15
0 1 2 3 4 5
Period T(s) -0.30
0 10 20 30 40 50 60
Time(s)
(a) Acceleration spectra (b) Acceleration time-history record
Figure 3. Details of earthquake ground motion (GeoNet)
The soil conditions in Christchurch have three separate material types: river outwash gravels, sands, and marshy ground in former swamp
areas, with the central city built mainly on gravels, although there are pockets of sand and soft soil in former marsh deposits. The
earthquake ground motion characteristics shown in Figure 3 reflect the underlying soil condition, with the long period nature of the motion
resulting from the soft soils upon which Christchurch is founded. These soft soils effectively act as a filter and remove high frequency
ground motion (leading to smaller PGA values than on rock sites) but amplify long period motion, resulting in significantly larger longer
period motion at about 2.5 seconds. As can be seen in Figure 3(b), strong ground shaking in the CBD had a duration of approximately 15
seconds with similar amplitudes in the two orthogonal recording directions.
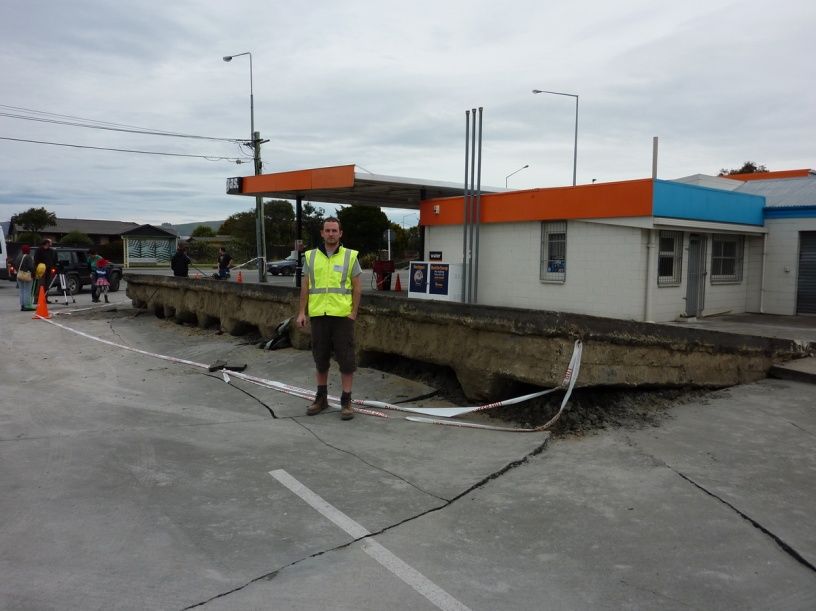
Figure 4. Floated petrol storage tanks in Bexley. Figure 5. Lateral spreading of the northern
stopbank of the Kaiapoi River
2. Liquifaction and ground spreading
Widespread liquefaction and lateral spreading occurred in Christchurch City and the surrounding region. The most prevalent damage
resulting from this liquefaction was to residential structures and water/wastewater networks. In Figure 4, petrol storage tanks floated due to
liquefaction of the surrounding soil, with the soil no longer providing any resistance to the buoyancy of these tanks. Tanks were topped
with concrete covered steel I beams, which gives the ridged base of the slab seen in the figure. In Kaiapoi, large lateral spread cracks up to
2 m deep and 1 m wide opened up in stopbanks adjacent to the river (see Fig. 5). These spread cracks developed along the stopbanks on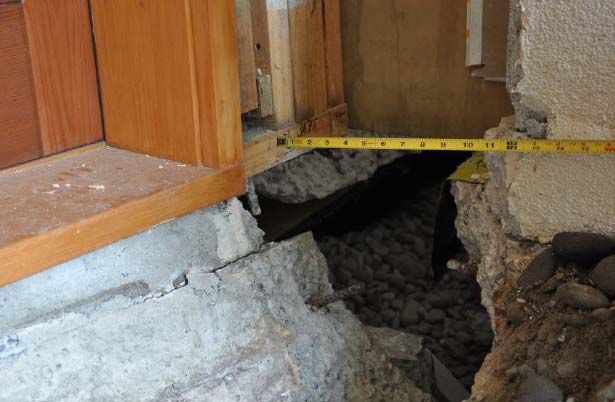
both sides of the river. Close to the river, no liquefaction ejecta was present in the cracks, while further from the river cracking had
evidence of ejecta. Figure 6 shows an aerial view of the extensive liquefaction that occurred in Porritt Park in the suburb of Wainoni.
This park is bordered on one side by the Avon River, with the remainder enclosed by a stream that follows the old path of the Avon. The
large area of sand boils is clearly evident in the image, with the linear nature of some of these sand boils indicating the lateral spreading that
also developed.

2.1   Lateral Spreading and Residential Structures
Lateral spreading resulted in significant damage to a number of residential structures in the region, splitting ground slabs and creating
separation in structures. A provisional government-commissioned report documenting geotechnical land damage reported that four weeks
after the earthquake, 6855 surveyed properties had land damage ranging between minor and very severe (Tonkin and Taylor 2010). In
areas with liquefaction and no lateral spreading, the typical slab foundations were able to accommodate the settlement that developed
without significant structural damage resulting.

Figure 6. Aerial view of sand boils and lateral spreading in Porritt Park      Figure 7. Effects of lateral spreading on residential structures in
                                                                               Kaiapoi

Figure 8. Cracking through floor slab of residential                   Figure 9. Separation of residential home due to lateral spreading
structure

In south Kaiapoi a large number of residential properties in Courtenay Dr were damaged as a result of significant lateral spreading, such as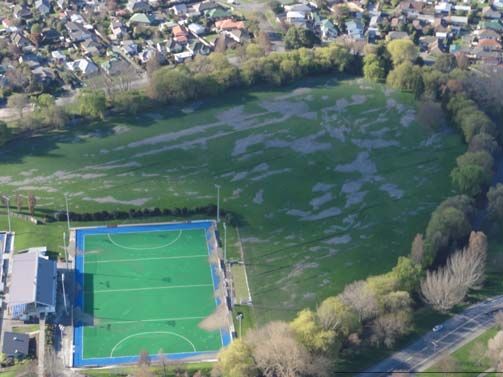
the structure shown in Figure 7. Large cracks up to 1.5 m wide ran through the area, cutting through the properties and the houses
themselves. One and two storey structures were severely damaged because of this movement, resulting in tilting, foundation tension
cracks and settlement. Even with this large movement and severe structural damage, none of the houses collapsed under their own gravity
loads following the event. Figure 8 shows a long crack that developed in the floor slab of a single storey residential structure in Bexley as a
result of lateral spreading. The slab was 100 mm thick and this crack was approximately 50 mm wide, developing parallel to the adjacent
wetland area, with other cracks developing in external paving areas surrounding the structure. From inspection it was clear that no
reinforcement was present in the slab of this structure. Figure 9 provides a close up view of ruptured floor slabs of structures in
Spencerville. Lateral spreading of the ground parallel to the Styx River caused severe damage to multiple large single storey homes in the
area. Long lateral spread features developed and extended across multiple properties and structures. The perimeter beam of the
foundation was reinforced with two D16 reinforcing bars, while there appeared to be no reinforcement present in the slab. Cracking
extended from the ground up into the walls and roof of the structure, however none of the structures collapsed.

2.2   Water/Waste water network
Damage to pipe networks as a result of liquefaction occurred extensively across the region as a result of ground movement and floating of
manholes. Between Spencerville and Brooklands on Lower Styx Rd, liquefaction caused ground subsidence and uplifting of 25 manholes
up to 450 mm above the road level. An example of this is shown in Figure 10.

Figure 10. Manhole uplift on Lower Styx Rd                               Figure 11.     Damage to anchorage detail in low rise concrete
                                                                         building

3.    Concrete building damage

Concrete buildings in the earthquake affected area can be categorized into three broad groups:
      •    Low-rise concrete buildings are typically offices or residential buildings, and are constructed of either reinforced concrete block
           masonry or of tilt-up concrete construction.
      •    Medium-rise concrete buildings are generally commercial or office buildings, and can be further classified as older non-ductile
           concrete buildings or more recently constructed buildings with shear walls and moment frames.
     •     High-rise concrete buildings are generally built post-1965 and exhibit ductile response.
In general, most concrete buildings performed well, with the majority of damage being associated with irregular or older non-ductile
structures. Hairline cracking was observed in some reinforced concrete masonry buildings, and there was damage to bolted anchorage
details between roofs and walls, as shown in Figure 11.

Damage to medium rise concrete buildings was attributable to poor load paths for the transmission of upper storey seismic loads to the
ground (see Fig. 12), cracking in older non-ductile concrete buildings (see Fig. 13), and pounding damage between precast concrete panels
(see Fig. 14). In taller buildings there was minor evidence of movement between structural elements, but perhaps the most significant
damage was due to rupture of cold drawn wire mesh in precast floor toppings (see Fig. 15). The limited ductility of cold drawn wire mesh
had been well documented previously (DBH 2005), but this was the first observed damage in a New Zealand earthquake that was
attributable to the lack of ductility of cold drawn wire mesh.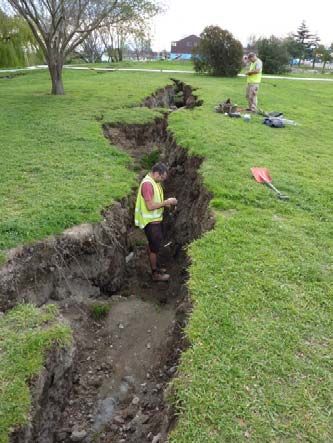
Figure 12. Diagonal shear cracking due to reduced area of shear         Figure 13.     Diagonal cracking in older non-ductile concrete
wall                                                                    building

Figure 14. Pounding damage to exterior precast                     Figure 15. Fracture of cold drawn wire mesh in topping slab
concrete panels

Recognising that the damage to concrete buildings was relatively minor, it is important to appreciate that the earthquake did cause
considerable damage to unreinforced masonry (URM) buildings. A review of this damage to URM buildings has been reported elsewhere
(Ingham and Griffith 2010).

4.     Bridge damage overview

In the days following the earthquake, visual inspections of fifty-five highway and pedestrian bridges were conducted by the Natural Hazards
Platform Bridge Research Group. Overall, bridge structures performed very well and only five pedestrian and eight road bridges suffered
damage that warranted closure. Of the closed road bridges, only five remained so for more than five days and only one bridge suffered
major damage to the superstructure. The pedestrian bridges however, suffered major damage and will likely be replaced. Details of the
most common damage modes detected during inspections are reported.
4.1    Superstructure and deck

The only road bridge to sustain any significant damage to the superstructure was an unreinforced masonry arch bridge on Sabys Road (see
Fig. 16(a)). The bridge crossed a small stream and during the earthquake both banks failed due to lateral spreading. The added
compressive force from the bank movement caused the arch to crack and the road to buckle. The only other superstructure damage
observed was pounding between the deck and abutment on the Bridge St. Bridge in South Brighton (see Fig. 16(b)).

                  (a) Failure of masonry arch bridge at Sabys Road                                   (b) Pounding of Bridge St. Bridge deck

                                                 Figure 16. Examples of damage to bridge superstructure

4.2    Bridge piers

A small number of road bridges exhibited flexural cracking of the
piers (see Fig. 17). While this cracking allows the bridge to
perform satisfactorily structurally, it represents a potential threat to
the lifespan of the bridge. Due to the proximity to the ocean and
the salt content in the air, this cracking provides an accelerated
pathway for chloride ingress. With the increased rate of chloride
ingress, the reinforcement steel will corrode at a much faster rate,
significantly reducing the serviceable life of the bridge.

                                                                                          Figure 17. Flexural cracking of piers on Bridge St. Bridge

4.3    Abutments

Abutment damage observed included cracking and/or the rotation of the entire abutment in two cases, these being Bridge St. Bridge in South
Brighton and Williams St. Bridge in Kaiapoi. This abutment damage was caused by lateral spreading of the approach slopes in areas
suffering from liquefaction. This effect was seen only on bridges with deep abutments, or closely spaced abutment piles. Cracking was
observed on the river side of the piles and the bottom of the abutment rotated towards the river suggesting plastic hinging in the piles, as was
previously observed in the 1987 Edgecome Earthquake (Berrill et al. 2001).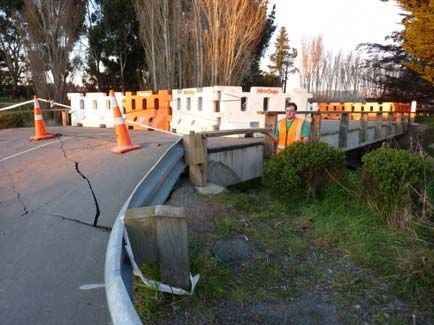
(a) Rotation of abutments due to lateral spreading: (b) Bridge St. South Brighton
Figure 18. Damage to bridge abutments
4.4 Approaches
Seven of the eight closed road bridges were closed due to damage to the approach. In all cases closure was caused by lateral spreading of
the approach towards the river. As the abutments were generally supported on piers, the bridge itself remained relatively unmoved. This
phenomenon has been observed in previous earthquakes (Ashford and Kawmata 2006; Buckle et al. 2000). This differential movement
led to the formation of vertical settlement between the bridge deck and the approach of up to 500 mm in River Road Bridge., causing
settlement from its original perfectly horizontal alignment (see Fig. 19(a)). Cracks in the approaches parallel to the axis of the bridge
provide evidence of the resistance against lateral spreading provided by this short monolithic span, as observed at the Gayhurst Road Bridge
(see Fig. 19(b)).
(a) River Road Bridge, South Lincoln (b) Gayhurst St. Bridge, Dalington
Figure 19. Approach Settlement
4.5 Pedestrian bridges
Almost all pedestrian bridges that were closed due to the earthquake suffered extensive damage to the superstructure. The bridge failures
occurred in regions that exhibited extensive liquefaction, and had associated lateral spreading of the riverbanks. While most road bridges
with integral abutments had the necessary strength and stiffness to resist the added compression from the approach slopes, the pedestrian
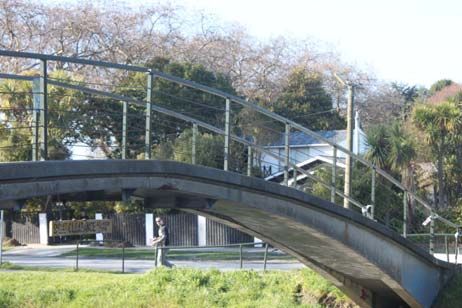
bridges did not. Therefore the bridges developed plastic mechanisms as observed at the Avon Park arch bridge (see Fig. 20(a)) where
hinging formed at the apex of the arch. Plastic mechanisms were also observed at the Porritt Park footbridge where the prestressed beams
were subjected to large compression loads and rotations (see Fig. 20(b)).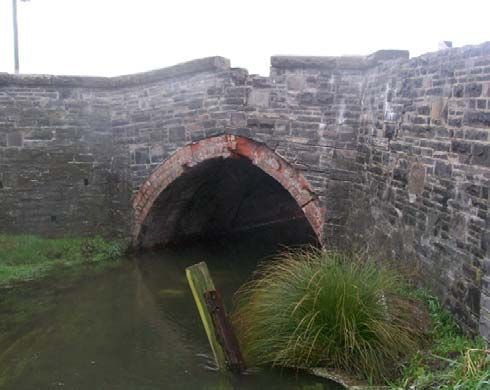
(a) Avon Park                                                              (b) Porritt Park
                                            Figure 20. Plastic Mechanisms in concrete footbridges

5.    Lyttelton Port

The only port located within the area affected by the 2010 Darfield Earthquake is the Lyttelton Port of Christchurch (LPC). The port is
located at the end of a natural deep water harbour and primarily serves the city of Christchurch, but overall facilitates the transfer of over two
thirds of cargo from the South Island and is the third largest in New Zealand. The port has specialised facilities for the transfer of
containerised cargo, coal, fishery products, forestry products and petrochemical products (LPC 2010). The general layout of LPC is shown
in Figure 21, with all the wharf structures being concrete decked but only two wharf elements being founded on pre-stressed concrete piles.
Most of the wharf is located on reclaimed land (LPC, 2005).

                                                       Figure 21. Layout Plan of LPC

The overall port structure sufficiently resisted the forces induced by the earthquake, resulting in no structural collapses. However, ground
deformations induced by the earthquake did cause serviceability damage, which is consistent with what has been observed in similar sized
earthquakes in other countries (Mahoney, Francis and Kennard, 2008). The primary lateral resistance mechanism is a series of tie backs
running underneath the large yard behind the wharfs and anchored in large concrete ‘dead men’ installed adjacent to the cliff face, which
prevented the wharfs from completely detaching into the sea. However, the reclaimed land underneath the yard displaced towards the sea,
which caused cracking in the concrete pavement as evident in Figure 22.

An important feature of this earthquake was that operations at the port were not significantly interrupted. Within a few hours core services
at the port were reinstated and within 48 hours the port was operational (LPC, 2010). Initial damage estimates reported by the media have
fluctuated between 50 and 100 million New Zealand dollars (McNeilly 2010), which correlated with approximately 40% damage to the
wharf structures (NZPA, 2010).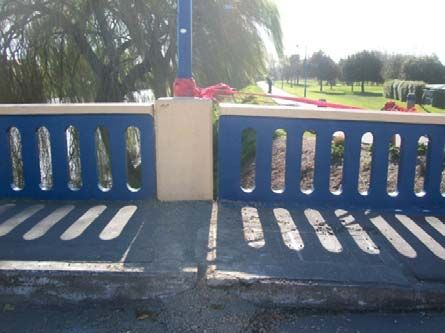
(a)      Settlement induced cracks in quay                                    (b) Large crack in concrete wharf deck

              (c) Differential settlement (McNeilly, 2010)                                        (d) Lateral spreading
                                              Figure 22. Earthquake damage to Lyttleton Port.

6.    Insured losses

Because of the comparatively light damage to concrete buildings as reported herein, it is possible that the full economic impact of the 2010
Darfield earthquake may be under-estimated. As detailed in section 2.1, over 6800 residential buildings were damaged due to ground
spreading and liquefaction, and as reported elsewhere (Ingham and Griffith 2010) there was also extensive damage to URM buildings. It
has been estimated that the 2010 Darfield earthquake is the 5th most expensive earthquake of all time for insurers, after inflation adjustment,
following behind the 1994 Northridge (CA, USA) earthquake, the 2010 Chilean earthquake, and the 1923 Tokyo and 1995 Kobe
earthquakes in Japan (NZ Herald 2010b).

7.    Conclusions

The 2010 Darfield earthquake corresponded to between 67-100% of the design level earthquake, depending upon fundamental period, but
caused no direct fatalities. Significant damage to residential buildings was caused by liquefaction and ground spreading, resulting in a
major impact to many home owners. Numerous examples of failed concrete slabs in residential buildings were reported. Water and
waste water services were significantly damaged due to ground deformations. Damage in concrete buildings was minor, being primarily
attributed to poor load paths or older non-ductile concrete detailing. The poor ductile performance of cold drawn wire mesh was observed.
Damage to concrete bridges was almost exclusively attributed to abutment and approach ground deformations, but the majority of bridges
remained serviceable. At Lyttleton Port there was notable damage, but not sufficient to cause port closure.

Overall, concrete structures performed very well during the earthquake. This good performance was attributed to the generally high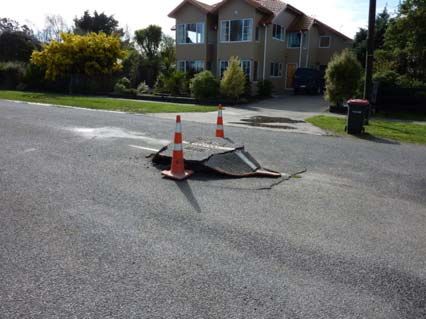
standard of structural seismic design and construction quality that has prevailed in New Zealand for many decades.

8.    Acknowledgements

The contents of this article are partly based upon information presented on Friday October 8 2010 at a special session convened by the New
Zealand Concrete Society to report on the performance of concrete structures during the 2010 Darfield earthquake. In particular, the
information on concrete buildings presented by John Hare of Holmes Consulting is gratefully acknowledged. The Port of Lyttleton is
thanked for permitting site access.

9.    References

1.    Ashford, S. A. and Kawmata, Y. (2006). ‘Performance of Transportation Systems during the 2004 Niigata Ken Chuetsu, Japan,
      Earthquake’. Earthquake Spectra, 22(1): pp. S111-S132.
2.    Berrill, J.B, Christensen, S.A., Keenan, R.P., Okada, W & Pettinga, J.R. (2001). ‘Case study of lateral spreading forces on a piled
      foundation’, Geotechnique, 51(6): pp. 501-517.
3.    Buckle, I. G., Chang, K., and Hwang, J., (2000). ‘Performace of Highway Bridges, in The Chi-Chi, Taiwan Earthquake of September
      21, 1999 Reconnaissance Report’. University of Buffalo, State University of New York: Buffalo New York. pp. 65 - 86.
4.    Department of Building and Housing (2005). ‘Practice Advisory 3: Beware of limitation – Cold drawn wire mesh’,
      http://www.dbh.govt.nz/UserFiles/File/Publications/Building/guidance-information/pdf/practice-advisory-03.pdf; June 2005;
      Retrieved October 23, 2010.
5.    GNS (2010). ‘Darfield earthquake damages Canterbury’,
      http://www.geonet.org.nz/news/article-sep-4-2010-christchurch-earthquake.html, 16 Sept 2010; Retrieved 16 Sept 2010.
6.    Ingham, J. M., and Griffith, M. C. (2010). ‘Performance of unreinforced masonry buildings during the 2010 Darfield (Canterbury,
      NZ) earthquake, Ausytralian Journal of Structural Engineering, In Press.
7.    Lyttelton Port of Chrictchurch. (2005). Berth Facilities. In Lyttelton Port of Christchurch. http://www.lpc.co.nz/Home.jasc. Retrieved
      October 21, 2010.
8.    Lyttelton Port of Christchurch. (2010). Annual Report.
      http://www.lpc.co.nz/TempFiles/TempDocuments/Annual%20Reports/LPC_AnnualReport2010_Web.pdf; Retrieved October 23,
      2010.
9.    Mahoney, M., Francis, M. and Kennard, D. (2008). ‘Performance of the Kawaihae Harbor Port Facility Resulting From the October
      2006 Earthquake’, Proceedings, Solutions to Coastal Disasters Congress, pp. 925-938.
10.   McNeilly, H. (2010, September 10). ‘Port damage may be $50m’. In Otago Daily Times.
      http://www.odt.co.nz/news/national/125612/port-damage-may-be-50m; Retrieved October 21, 2010.
11.   NZ Herald (2010a). ‘Christchurch earthquake victim: 'I was pinned to the ground'’, New Zealand Herald,
      http://www.nzherald.co.nz/nz/news/article.cfm?c_id=1&objectid=10673369; 14 Sept 2010; Retrieved 20 Sept 2010.
12.   NZ       Herald     (2010b).     ‘Chrisstchurch     quake      5th    most      expensive      ever’,    New       Zealand      Herald,
      http://www.nzherald.co.nz/business/news/article.cfm?c_id=3&objectid=10673931; Sept 16 2010; Retrieved October 26 2010.
13.   NZPA. (2010). ‘Lyttelton Port lists earthquake damage – but is doing more business’. In The National Business Review.
      http://www.nbr.co.nz/article/lyttelton-port-details-ongoing-response-earthquake-131252, October 8 2010; Retrieved October 21,
      2010.
14.   Standards New Zealand. (2004). "NZS 1170.5:2004, Structural Design Actions Part 5:Earthquake actions – New Zealand."
      Wellington, New Zealand.
15.   Tonkin and Taylor (2010). ‘Darfield Earthquake 4 September 2010 Geotechnical Land Damage Assessment & Reinstatement
      Report – Stage 1’, Report prepared by Tonkin & Taylor Limited for the Earthquake Commission, October.
You can also read