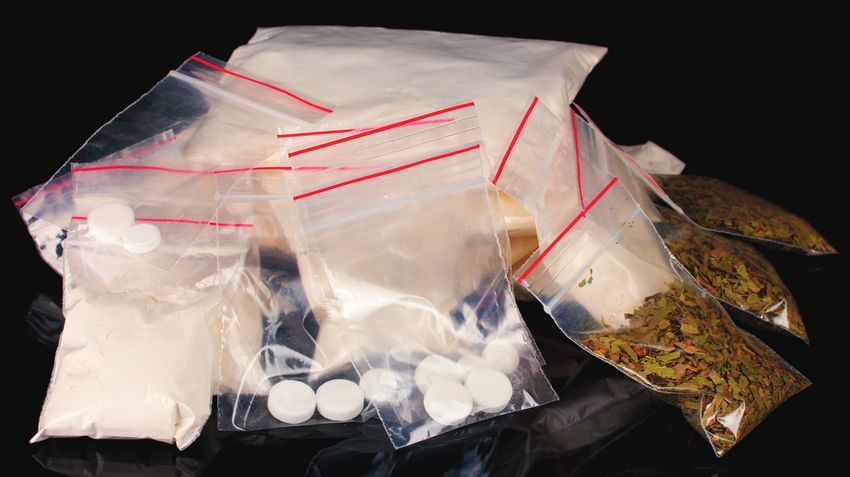
Bath Salts and Cannabinoids Analyzed by GC-IR
←
→
Page content transcription
If your browser does not render page correctly, please read the page content below
Appli cat i on N ote 5 2 4 1 8
                  Bath Salts and Cannabinoids
                  Analyzed by GC-IR
                  Glenn Everett, William Stanton, Tennessee Bureau of Investigation, Nashville, TN, USA
                  Michael Bradley, Ph.D., Thermo Fisher Scientific, Madison, WI, USA

Key Words
GC-IR, FT-IR, Bath Salts, Cannabinoids, Cathinones,
Methcathinone, Forensics

                  Introduction
                  Drug case criminal prosecution relies upon laws
                  specifying what is and what is not legal. Underground
                  chemists try to avoid prosecution by modifying illegal
                  materials to produce synthetic “designer drugs” which
                  may slip through legal loopholes. Recent designer
                  drug targets include cathinones and cannabinoids.
                  Cathinones and related drugs are found on the street
                                                                                     Cannabinoids commonly appear in small packages filled
                  labeled as “Bath Salts” (due to a resemblance to
                                                                                     with dried plant matter, similar to potpourri. Outlets
                  commercial bath salts, though completely unrelated;
                                                                                     like gas stations or small cigar shops provide users with
                  methcathinone is a common example). Synthetic
                                                                                     easy access; co-location of pipes and potpourri can be a
                  cannabinoids have an affinity for the cannabinoid
                                                                                     trigger for suspicion. To make the product, the cannabi-
                  receptor in the brain, providing a “high” similar to
                                                                                     noid dissolved in a solvent is sprayed or soaked on to the
                  marijuana. Marijuana itself contains over 50 different
                                                                                     plant matter, which is then dried. For example, one
                  cannabinoids. The Tennessee Bureau of Investigation
                                                                                     production facility filled a small swimming pool with
                  (TBI) laboratory has considerable experience analyzing
                                                                                     the mixture and stirred with a wooden paddle. The pool
                  street samples of both cathinones and cannabinoids.
                                                                                     and paddle were not cleaned between batches, so the
                  Crystalline cathinones tend to be sold in single-dose              resulting product contained multiple cannabinoids.
                  capsules, labeled either as bath salts or plant food
                                                                                     The synthesis of these compounds began through a
                  (though never used in either capacity) and bearing a
                                                                                     legitimate search for therapeutic drugs in the 1940’s.
                  disclaimer of “not intended for human consumption.”
                                                                                     Street sources of both bath salts and synthetic cannabi-
                  The capsules often contain relatively pure cathinones in
                                                                                     noids have become more prevalent since 2009 as the
                  amounts above an effective dosage, leading to toxicity
                                                                                     skills and sophistication of the producers have improved,
                  effects ranging from headaches and nausea to death.
                                                                                     making them a current hot topic in law enforcement
                                                                                     circles. Unfortunately, media attention increased the
                                                                                     visibility of the drugs and created interest in experimen-
                                                                                     tation. With these driving forces and the current legal
                                                                                     landscape, forensic analysts require rapid, efficient
                                                                                     analysis leading to chemical identification.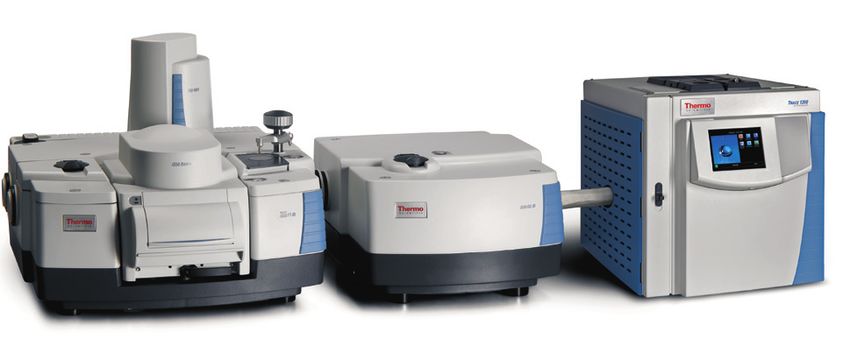
Figure 1 shows the chemical structure of some synthetic                This legal landscape has led to a surge of interest in gas
cathinones and cannabinoids, including those to be                     chromatography-infrared (GC-IR) analysis. In GC-MS
discussed below. The subtle differences highlight the                  (mass spectrometry), the molecule is broken down into
legal issue – by moving one chemical group on the                      component pieces for mass analysis, giving excellent
regulated “A” compound to another location, the                        sensitivity. However, with the molecule “shattered,” the
chemist may produce unregulated “B” which maintains                    isomeric information is lost (“A” and “B” look the
or increases the potency yet avoids prosecution through                same). GC-IR investigates the molecule while still intact,
a legal loophole. Some regions try to fill this hole with              enabling “A” and “B” to be distinguished. This paper
broad statements such as “A and analogs,” but this is                  focuses on separation of the compounds and the
not always successful: what defines an analog?                         subsequent analysis including aspects like overlapped
                                                                       peaks and isomeric synthetic drugs.
 Compounds                               Structures                    Experimental
                                                                       Typical samples of cathinones arrive at the TBI
                                                                       laboratory as capsules or loose powder. The drug is
 Cathinone (Bath Salt)                                                 converted to a base by mixing with 0.5 M NaOH to
                                                                       improve the chromatography. The solution is then
                                                                       separated with chloroform for injection. Cannabinoids
                                                                       arrive in bags containing plant matter and visibly
                                                                       resembling potpourri (flaked leaves). A portion of the
 MDPV (Bath Salt)                                                      sample is soaked in methanol. Minimal methanol is
                                                                       added, just wetting the plant material and leaving a
                                                                       small amount – a drop, ideally – of extra liquid. If an
                                                                       excessive amount of methanol is present, the sample may
                                                                       need to be dried down to concentrate the drug. A GC
                                                                       syringe is used to uptake 2 microliters of the liquid; no
 JWH-019
                                                                       other preparation is needed.

                                                                       Standards of the cannabinoids and bath salts (Cayman
                                                                       Chemical®) were mixed with methanol to obtain 1 mg/mL
                                                                       solutions. These were injected in the same manner as the
                                                                       evidence samples. The resulting reference spectra were
 JWH-122
                                                                       stored in the TBI Gas Phase Library, which can be
                                                                       obtained at no charge by qualified Forensics Laboratories
                                                                       through Thermo Fisher Scientific™.

                                                                       The Thermo Scientific Nicolet™ iS™50 FT-IR spectrom-
                                                                       eter equipped with the iS50 GC-IR module is ideally
                                                                       suited for this analysis. Figure 2 shows the system using
 JWH-210                                                               a Thermo Scientific TRACE™ 1310 Gas Chromatograph
                                                                       coupled via a heated transfer line to the spectrometer.
                                                                       The GC module contains a liquid nitrogen cooled
                                                                       MCT-A detector for high sensitivity. For this work, the
                                                                       Thermo Scientific OMNIC ™ Series software collected
                                                                       more than one spectrum per second consisting of 4 scans
                                                                       at 8 cm-1 resolution (0.7 second acquisition time). As
                                                                       seen below, this yielded excellent signal-to-noise. Further
 AM-2201                                                               signal-to-noise improvement resulted from co-addition
                                                                       of spectra around the peak maximum.

 MAM-2201

                                                                       Figure 2: The Nicolet iS50 FT-IR Spectrometer with iS50 GC-IR module. Also
                                                                       shown is the TRACE 1310 GC and the iS50 ATR and iS50 Raman modules in
Figure 1: Structures of some of the Bath Salts and Cannabinoids seen
                                                                       the main spectrometer.
periodically by the TBI Laboratory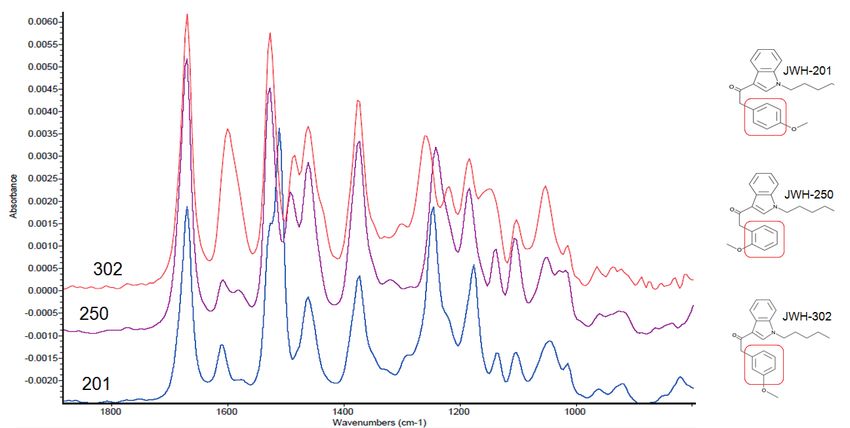
The column used in this work was a 5 meter silica
capillary of 0.30 mm cross section and coated with
bonded poly(1% diphenyl/99% dimethylsiloxane).
Columns with 5% diphenyl and several others would
be suitable as well. The short column (5 meters) is
necessary as the cannabinoids have a very low volatility
leading to prohibitively long retention times otherwise.
The separation for cathinones can sometimes be
improved with longer columns (30 meter); all figures
here use the 5 meter column except as noted.

Two microliters of sample were injected, with a 3:1 to
5:1 split ratio. The temperature program held 90 °C for       Figure 3: GC-IR data from a typical cannabinoid sample. The multiple peaks at short retention time are
1 minute (driving off the methanol), ramped 70 °C per         impurities from the synthesis and sample preparation; the two longest retention time peaks are the drugs.
minute to a final temperature of 270 °C and held there
for 20 minutes (different ramps are applied as needed to
effect optimal separations). This combination of conditions
yielded retention times between 5 and 20 minutes for
most of the compounds investigated and provided
adequate separation for courtroom-ready identification.
The transfer line and heated cell of the GC module were
set to 270 °C and held steady throughout. Implementing
GC-FID-IR is straightforward with the iS50 GC-IR
module, though not done here.

Figure 3 shows the output from a typical cannabinoid
sample GC-IR run. The Gram-Schmidt (GS) profile in
the top pane reports the total IR signal change over
the run – the IR representation of the chromatogram.
The lower pane shows the spectrum at the time point
indicated by the cross hairs. The complexity of this
sample, from a real case in the TBI laboratory, is clear
from the number of peaks. The largest peak, at short          Figure 4: Simple search results for the two cannabinoid peaks in Figure 3
time, is the solvent elution. The rising edge of that peak
occurs around 5 seconds after the injection – a result of
the short column used. The last fraction, due to a
cannabinoid, fully elutes in under 7 minutes.

Discussion
GC-IR has been used at the TBI laboratory for some
time to analyze cannabinoids and bath salts. The
laboratory aggressively seeks out new examples, often
adding them into the TBI Gas Phase Library before they
appear on the street. This experience enables the
analysts to direct their attention to the pertinent peaks
in working with data such as shown in Figure 3. Much
of the content is immaterial, due to poor quality control
by the producers (cleaning between batches) or variance
in the synthesis and the plant matter.

The last two peaks in Figure 3 contain the information        Figure 5: GS Profile for a less well separated sample, showing the co-add region for the first component.
                                                              The inset shows the search result for this component.
about the drug mixture. The spectra from across each
peak are co-added (summing spectra under the chro-
matographic peak to improve signal to noise) and then
searched against the library. The search results are          the side chain. MAM-2201 is a modification of the
shown in Figure 4. The high match value leads to a            regulated JWH-122; the JWH-122 remaining is likely
positive identification; visual comparison of the top hits    due to low yield synthesis of the MAM drug.
with secondary hits reinforces this.
                                                              Figure 5 shows another cannabinoid blend, with the GS
The two compounds here are JWH-122 and MAM-                   profile expanded around the drug peak. The separation
2201. Close examination of the structures (Figure 1)          does not show two well separated peaks, but there are
reveals the only difference is the terminal fluorine on       several options for complete analysis.
First, regions near the opposite edges of the two peaks
are co-added for analysis. The shaded region in Figure 5
was co-added and searched. The results appear in the
inset. Figure 6 shows the region selected and the results
for the second peak. The simplicity of this approach
requires some skill to select the regions and to recognize
when further processing, such as spectral subtraction,
may be needed.
This manual analysis can be slightly improved by
removing the residual signals from the second compo-
nent from the first spectrum via subtraction (and vice
versa). Figure 7 shows the search result after the spectra
from Figures 5 and 6 were subtracted. This eliminates
the small signal from JWH-210 present under the
Figure 6: Same GS profile as in Figure 5, but focusing on the second peak. The inset again shows the spectrum of the AM-2201. Manual analysis provides
search result for this component. maximum control over the results but requires some
skill on the part of the user.
As a semi-automated alternative, the entire peak shown
can be co-added, resulting in a single spectrum combin-
ing the two components. Exporting this to the Thermo
Scientific OMNIC Specta™ software permits use of the
multi-component search algorithm, with the result
Figure 7: Search result for the spectrum derived by subtracting the co-add from Figure 6 from that in shown in Figure 8. The bottom pane shows two spectra
Figure 5. The improvement in the search metric is apparent. identified as comprising the co-added spectrum, while
the upper pane compares the co-added spectrum to a
composite made with those spectra. Excellent agreement
was obtained with no subtraction or other processing,
and the results align with the previous work. The big
advantage of this approach lies with consistency, since
the MCS algorithm provides the same results to any
user, regardless of skill. Further, OMNIC Specta works
even with 100% co-eluting signals, unlike any of the
other methods outlined here.
The two drugs found in this sample were AM-2201
and JWH-210, which have several distinct features.
The ethylene on naphthyl ring and the difference in the
long side chain are apparent. It is likely this resulted
from poor quality control in the cleaning process
between batches.
Figure 8: Output from OMNIC Specta’s Multi-component Analysis routine operating on the co-added The Thermo Scientific Mercury GC analysis software
spectrum from the entire peak profile shown in Figures 5 and 6. permits one click to produce a full report. Figure 9
shows the analysis of a methylone bath salt sample
(run on a 30 meter column) using Mercury GC. The
algorithm identifies the peaks in the GC profile, co-adds
spectra around the peak to improve the signal-to-noise
and then performs a search against the chosen libraries.
The advantage of this fully automated process is the
removal of subjectivity with a complete analysis of all
peaks in the GS-profile. Low match results may indicate
the presence of mixtures requiring deeper analysis.
The inset shows the structure of methylone; comparison
to the MDPV structure shows the similarity and
relationship to cathinone. Originally sold under the
Figure 9: Output from the OMNIC Mercury GC analysis of the entire GS profile for a methylone sample. name “Explosion”, methylone is now a Schedule 1 drug
This bath salt sample was run using a longer (30 meter) column. in many states.Another example of an overlapped elution is shown in
Figure 10. The spectra were co-added and then fed into
OMNIC Specta. Once again, the clear resolution of the
two components and excellent agreement of the composite
with the original spectrum reveals the power of this
analytical tool. This sample contained MAM-2201
(as did the first sample) and JWH-019.
The example in Figure 11 shows an extreme chromato-
graphic overlap case for a bath salt sample, where there
is only a small region of the GS profile where the drug
elutes clear of interference (inset). A simple search of a
co-added region around the third hump shows moderate
quality matches to caffeine (match value of 80) and
MDPV (the second hit listed at 78). The latter is the
suspected ingredient, but the results would not be
satisfactory in court. Co-adding a wide region and then
searching with OMNIC Specta yields a perfect match
and clear identification. MDPV (Methylenedioxypyrova-
lerone) is a heavily modified cathinone (bath salt) which Figure 10: Another example of OMNIC Specta’s MCS routing applied to the data from the heavily
is a stimulant, an effect increased through the addition overlapped GS profile shown in the inset. The clear identification and high level of confidence in the
of the caffeine. result is apparent.
Figure 12 compares three closely analogous compounds
to illustrate the ability to distinguish the materials.
There are significant differences between the three
spectra, sufficient for the searching routine to select out
the correct isomer from data sets. The three drugs,
differing only in the location of the side chain on the ring
(small boxes) show both the complexity of the problem
with these drugs and the power of GC-IR. The drugs
could slip through the legal net unless the legislation
was specific, and the isomer-specific identification would
be essential to prosecution of the case. The combination
of proper laws and specific tools for the identification
is required.
Figure 11: Analysis of a Bath Salt (MDPV) heavily dosed with caffeine. The inset shows the severity of
the overlap caused by the short GC column; OMNIC Specta handles this with no difficulty. The resulting
composite profile is stunningly identical to the co-added spectrum from OMNIC Series.
Figure 12: Comparison of the
spectra obtained for several closely
related cannabinoid compounds;
the structures are also shown.Appli cat i on N ote 5 2 4 1 8 Conclusion Synthetic cannabinoids and bath salts are increasingly important to law enforcement. The subtle changes imposed by underground chemists provide a nightmare scenario to the analyst, requiring a simple, fast and specific solution. GC-IR provides that solution, with GC separating the materials for analysis and the FT-IR probing the intact molecules leading to definitive identification. The long retention times necessitate a short column, leading to incomplete separation. The OMNIC Suite of tools permits the disentangling of this information, either using subtraction or the automated OMNIC Specta multi-component analysis routine. The latter adds consistency regardless of skill level to the mix, greatly improving the chances for correct, court- room ready identification. Further, the Nicolet iS50 spectrometer enables the user to add FT-Raman and ATR spectroscopy to their tool set, rather than depending upon a dedicated system. Both Raman and infrared are listed as Class A methods in the SWGDRUG guidelines, so the fully outfitted system is a powerful tool for use in the forensics laboratory. www.thermoscientific.com ©2012 Thermo Fisher Scientific Inc. All rights reserved. All trademarks are the property of Thermo Fisher Scientific Inc. and its subsidiaries. This information is presented as an example of the capabilities of Thermo Fisher Scientific Inc. products. It is not intended to encourage use of these products in any manners that might infringe the intellectual property rights of others. Specifications, terms and pricing are subject to change. Not all products are available in all countries. Please consult your local sales representative for details. Africa +27 11 822 4120 Denmark +45 70 23 62 60 India +91 22 6742 9434 New Zealand +64 9 980 6700 Australia +61 3 9757 4300 Europe-Other +43 1 333 50 34 0 Italy +39 02 950 591 Russia/CIS +43 1 333 50 34 0 Austria +43 1 333 50 34 0 Finland/Norway/Sweden Japan +81 45 453 9100 Spain +34 914 845 965 Belgium +32 53 73 42 41 +46 8 556 468 00 Latin America +1 561 688 8700 Switzerland +41 61 716 77 00 Canada +1 800 530 8447 France +33 1 60 92 48 00 Middle East +43 1 333 50 34 0 UK +44 1442 233555 China +86 10 8419 3588 Germany +49 6103 408 1014 Netherlands +31 76 579 55 55 USA +1 800 532 4752 AN52418_E 12/12M
You can also read