Vodacom Group Limited - September 2016

Page created by Ben Klein
 
CONTINUE READING
Vodacom Group Limited - September 2016
Vodacom
                                                             Group
                                                            Limited

                                                           September 2016

Vodacom Group Limited IR presentation | 5 September 2016
Vodacom Group Limited - September 2016
Disclaimer
The following presentation is being made only to, and is only directed at, persons to whom such presentations may lawfully be
communicated (‘relevant persons’). Any person who is not a relevant person should not act or rely on this presentation or any of its
contents.
Information in the following presentation relating to the price at which relevant investments have been bought or sold in the past or the yield
on such investments cannot be relied upon as a guide to the future performance of such investments. This presentation does not constitute
an offering of securities or otherwise constitute an invitation or inducement to any person to underwrite, subscribe for or otherwise acquire
securities in any company within the Group.
Promotional material used in this presentation that is based on pricing or service offering may no longer be applicable.
This presentation contains certain non-GAAP financial information which has not been reviewed or reported on by the Group’s auditors. The
Group’s management believes these measures provide valuable additional information in understanding the performance of the Group or
the Group’s businesses because they provide measures used by the Group to assess performance. However, this additional information
presented is not uniformly defined by all companies, including those in the Group’s industry. Accordingly, it may not be comparable with
similarly titled measures and disclosures by other companies. Additionally, although these measures are important in the management of
the business, they should not be viewed in isolation or as replacements for or alternatives to, but rather as complementary to, the
comparable GAAP measures.
This presentation also contains forward-looking statements which are subject to risks and uncertainties because they relate to future events.
These forward-looking statements include, without limitation, statements in relation to the Group’s projected financial results. Some of the
factors which may cause actual results to differ from these forward-looking statements are discussed on slide 23 of this presentation.
Vodafone, the Vodafone logo, Vodafone Mobile Broadband, Vodafone WebBox, Vodafone WebBook, Vodafone Smart tab, Vodafone 858
Smartphone, Vodafone Passport, Vodafone live!, Power to You, Vodacom, Vodacom M-Pesa, Vodacom Millionaires, Vodacom 4 Less and
Vodacom Change the World are trademarks of Vodafone Group Plc (or have applications pending). Other product and company names
mentioned herein may be trademarks of their respective owners.

Vodacom Group Limited IR presentation | 5 September 2016                 2
Vodacom Group Limited - September 2016
A leading African mobile communication company providing
                                                                                                  a wide range of communication services including mobile
                                                                                                  voice, messaging, data and converged services to over
                                                                                                  61 million customers.
             Vodacom DRC
             Licenced 2002
             Population 71 million                  Vodacom Tanzania                              Vodacom is majority owned by Vodafone Plc (65%) and we
                                                    Licenced 1999
                                                                                                  are listed on the JSE Limited.
                                                    Population 55 million

                                                                                                  Market capitalisation of R231.3 billion#.
                                                                                                  Group revenue of R80.1 billion.
           Vodacom Mozambique
           Licenced 2003
           Population 29 million                                                                 Head office in Midrand, South Africa

                                         Vodacom Lesotho
Vodacom South Africa                     Licenced 1995                        History – consistent track record of innovation
Licenced 1993
                                         Population 2 million
Population 55 million
                                                                                         1996                2004          2008          2009              2011              2012             2016

                                                                                                                                                           Vodacom
                                                                                      First to launch        Vodacom                                                                        LTE-Advanced
 All information in presentation is as at 31 March 2016, unless otherwise stated.                                          Vodacom    Vodacom listed    rebrands from     First to launch
                                                                                     prepaid services     launches a 3G                                                                       launched
 #Market capitalisation value as at 5 September 2016.                                                                      Business     on the JSE     “Green and Blue”        4G in
                                                                                    in the world on IN   HSDPA network
                                                                                                                           launches      (18 May)        to Vodafone       South Africa
                                                                                         platforms       in South Africa
                                                                                                                                                             RED

    Vodacom Group Limited IR presentation | 5 September 2016                                               3
Vodacom Group Limited - September 2016
Share information

As at 5 September 2016                                                          Institutional shareholding
JSE Ticker symbol                                                       VOD
ADR code                                                            VDMCY
                                                                                                           PIC = 49.9%
Stock exchange                                                  JSE Limited                   4%4%
                                                                                         7%
Shares in issue                                                1 487 954 000                                South Africa

Freefloat                                                               35%                                 United States

52 week low and high                                            R132 – R172        19%                      United Kingdom
                                                                                                            Rest of Europe
Market capitalisation                                          R231.3 billion
                                                                                                     66%    Rest of world
Debt rating                                    Long term scaling zaAAA (S&P)
Transfer agent                                               ComputerShare
                                                   FTSE/JSE Top 40 Index
Indices                                     JSE Socially Responsible Index
                                    Nedbank BGreen Exchange Traded Fund

Vodacom Group Limited IR presentation | 5 September 2016                4
Vodacom Group Limited - September 2016
Five reasons to own Vodacom shares

                                                           1             Market leadership

                                                                          2      Focus areas of growth potential

                                                                           3       Scale benefits driving efficiencies

                                                                     4         Experienced, diverse management team

                                                           5       Track record of delivering shareholder returns

Vodacom Group Limited IR presentation | 5 September 2016       5
                                                                                                                         5
Vodacom Group Limited - September 2016
#1 | Market leadership

                                                  #     1        mobile operator in all markets

     61.3 million customers in                                                    > 18 000 base stations, > 80% 3G
     5 countries in Sub-Saharan Africa                                             1st   to launch 4G in South Africa, Lesotho and
     R14 billion enterprise revenue from                                           Tanzania

     30 countries in Africa

                                   R13 billion
                                   investment per annum to maintain our leading network quality

All information is as at 31 March 2016

 Vodacom Group Limited IR presentation | 5 September 2016                6
Vodacom Group Limited - September 2016
#2 | Focus areas of growth potential
                                                               FY14: +33%                                                       FY14: +24%
                                                               FY15: +25%                                                       FY15: +10%
    Data (32% of Group service revenue)                        FY16: +29%
                                                                                International (27% of Group service revenue)    FY16: +17%

    • Group: 29 million active data customers; 57% of total base                • 27% of Group service revenue
    • SA: 14 million active smart devices; 37% of active                        • Data revenue growth +32%
      customers                                                                 • Active customers 27 million
    • SA: 572MB per smart device growing 23%                                        o Active customers now 44% of Group active customers

                                                               FY14: +37%
                                                               FY15: +13%
    Enterprise (21% of Group service revenue)                  FY16: +19%
                                                                                New services (SA) (4.2% of Group service revenue)

    • Enterprise contributes 21% to Group service revenue                       • Insurance revenue +19%
    • SA fixed and managed services revenue +27%                                    o Expanding portfolio: life, funeral, device, cover

       o Pan African MPLS network                                               • Capture Internet of Things opportunity
       o Fibre to the business/home                                             • Fibre to home +25 000 homes and businesses passed

.
    Vodacom Group Limited IR presentation | 5 September 2016                7
                                                                                                                 7
Vodacom Group Limited - September 2016
#3 | Scale benefits driving efficiencies

Focussed savings programmes – Fit 4 Growth

• Reduced transmission rentals through self-provisioning
• Cost optimisation through sharing, outsourcing and supply
  chain management
• Improved return on investment in customer acquisition
  spend
• Reduced support costs offsetting inflationary pressures

Benefits from being part of the Vodafone Group

•   Global technology and product roadmap
•   Better pricing through Vodafone Procurement Company
•   Benefits from best practice sharing and benchmarking
•   Talent and skills sharing

Vodacom Group Limited IR presentation | 5 September 2016      8
                                                                  8
Vodacom Group Limited - September 2016
#4 | Experienced, diverse management team

     4
                                                       CEO: Shameel Aziz Joosub (45)               CFO: Till Streichert (41)

                                                       20 years industry experience                15 years industry experience
                                                       Previously CEO of Vodafone Spain            Previously CFO of Vodafone Romania
                                                       IT Person of the year 2015                  European and emerging market experience

                                                             Executive Committee (12 members)

                                                                          Female
                                                                                                                                Intern-
                                                                          17%                                                   ational
                                                                                          Black   White                         25%
                                                                                          58%     42%                 South
                                                                                                                      African
                                                                   Male
                                                                                                                       75%
                                                                 83%

Vodacom Group Limited IR presentation | 5 September 2016                      9
Vodacom Group Limited - September 2016
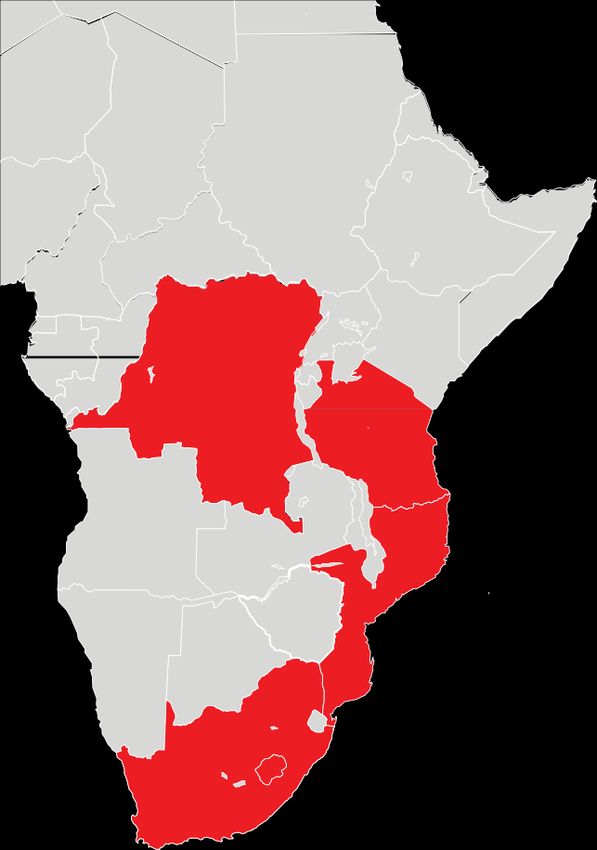
#5 | Consistently delivering shareholder returns
Relative share price performance1                                                 Dividend per share
                                                                                  Cents per share

                                                                                             825                                        795
                                                                                                                       775

                                                                                            430                        400              400

TSR ZAR YTD (for 12 months ending 5 September 2016)
  Vodacom                                                   13.0%
                                                                                            395                        375              395
     Telkom                                                   3.8%
      Bharti                            -7.1%                                               FY14                       FY15            FY16
    Millicom                                -18.1%
                                                                                                    Interim dividend          Final dividend
       MTN                       -31.5%
           -35.0%       -25.0%     -15.0%       -5.0%       5.0%     15.0%

1. As at 5 September 2016.
 Vodacom Group Limited IR presentation | 5 September 2016                    10
Targets | Group three-year targets

Low to mid single-digit
 Service revenue growth

Mid to high single-digit
 EBITDA growth

12% to 14%
 Capex intensity

Vodacom Group Limited IR presentation | 5 September 2016   11
                                                           11
Continuing to deliver returns

    Best network                         Diversify         Deliver cost      Best talent           Transform
  ---------------------                 revenue to         and process    ---------------------   society and
     Best value                        deliver growth       efficiency      Best practice             build
  ---------------------                                                                           stakeholder
    Best service                                                                                      trust

Vodacom Group Limited IR presentation | 5 September 2016      12
Customer | Best network, Best value, Best service
Best network                                                   Best value                                                  Best service

•    Network customer satisfaction #1 in all                    •         Personalised pricing and offers                  •        Connectivity
     markets but one                                            •         Driving pricing transformation                   •        Always in control
•    4G coverage in SA at 58%                                   •         Reducing communication costs                     •        Rewarding loyalty
•    International sites +17%                                   •         Stimulating bundle adoption                      •        Easy access
•    SA dropped call rate @ 0.41%
•    1st in SA with commercial mobile LTE-A

Average download speeds in SA                               Total prepaid bundle sales in SA                          SA Consumer NPS points differentiation
Source: MyBroadband (March 2016) (Mbps)                     Million                                                   %

                                                                                                                          +6 ppts
                                                                                                                                                                         +15 ppts
                                                                                                   86          189

    23             18            17             10                  314          387               383         369

                                                                1H15            2H15           1H16           2H16                   FY15                         FY16
    Vodacom SA    Operator A   Operator B   Operator C                                                                              Vodacom        Competitor A          Competitor B
                                                                      Total prepaid bundle sales         Just 4 You

 Vodacom Group Limited IR presentation | 5 September 2016                              13
Growth | Diversifying revenue to deliver growth
Data contribution                                                             International contribution

                 FY16                        • Growth +28.5%                                  FY16                    • Growth +17%
                                             • Average usage per smart                                                • EBITDA contribution
                 FY14                          device - 572MB                                  FY14
                                                                                                              26.6%     17.7% (FY14: 15.6%)
                                31.9%        • 2G to 3G; 3G to 4G
                        21.4%                                                                         24.6%
                                                                                                                      • M-Pesa revenue +19%
                                               ARPU uplift +20%

Contribution to Group service revenue                                         Contribution to Group service revenue

Enterprise contribution                                                       New services contribution (SA)
                                             • Enterprise service                              FY16                   • Device insurance
                    FY16                                                                                  4.2%
                                               revenue +20%                                                             policies +25%
                                             • R3.2bn fixed-line & BMS                         FY14
                    FY14           20.5%                                                           3.5%               • IoT connections +28%
                           15.1%               revenue
                                                                                                                      • Wholesale partnership
                                                                                                                        agreements for fibre
                                                                                                                      • GDSP platform delivery

Contribution to Group service revenue                                         Contribution to SA service revenue

Vodacom Group Limited IR presentation | 5 September 2016                 14
                                                                                                                                                 14
Operations | Fit for growth SA
                                                                                 30.5% of SR                      6.6% of SR
                                                           Number                 (FY15: 31.6%)                    (FY15: 6.7%)
                                                           of sites
                                                             +9%            Direct expenses1                Staff expenses2
                                                                            •   Channel efficiencies        •   Hire in key growth areas
                                                                            •   Sophisticated IBRO          •   Attract and retain talent
                                                                                management
 Actively managing costs                                    Energy          •   Credit management
                                                           inflation
     • Sharing and outsourcing to realise scale             +13%

     • Incentives – volume vs revenue
     • Digitisation – self care and empowering
       customers                                           Inflation              2.5% of SR                     14.4% of SR
     • Cost consciousness at an individual level             +6%                   (FY15: 2.7%)                   (FY15: 14.1%)
                                                                            Publicity expenses              Other operating expenses3
                                                                            •   Consolidated agency spend   •   Reduced network cost per site
                                   Innovate                  Wage
                                                                            •   Improved production cost    •   Improved digitisation and App
                                                                                efficiency                      penetration
                                                           inflation
                                                                            •   Increased digital/social
                                                             +6%                                            •   Leverage scale through
                                                                                platform spend
                                                                                                                sharing and outsourcing
                                                                            •   Increased share of voice
1.     Excluding equipment expenses.
2.     Excluding BEE charge.
3.     Excluding trading foreign exchange.

Vodacom Group Limited IR presentation | 5 September 2016               15
                                                                                                                                                15
People | Attracting and retaining the best talent
                                                     Driving people transformation through

         Enhancing diversity                                     Growing talent                   Developing skills

  • 73% black and 39% female                               • 123 graduates in 2015           • R103 million spent on skills
    staff                                                    Graduate programme                development
  • 55% of EXCO black                                      • International Graduate          • Capability build and
  • Vodacom Women in Red                                     programme in all our              succession programmes
    Awards                                                   markets
                                                           • International assignee
                                                             programme

Vodacom Group Limited IR presentation | 5 September 2016                 16
Reputation | Mobile for good

         R106m                                 +600k                  Vodacom

         spent by                              TZN                    eSchool
         Vodacom                               subscribers:           free education
         Foundation on                         Healthy                portal 105k
         CSI projects                          pregnancy              registered
                                               Healthy baby           learners

                20                             24 hour                3 087
         volunteers for                        call center for        schools
         annual Change                         victims of             connected -
         the World                             gender-based           Universal
         programme                             violence               Service
                                                                      obligations

Vodacom Group Limited IR presentation | 5 September 2016         17
                                                                                       17
Reputation | BEE Level 2 contributor

                                                           R841m             R218m           R112m
                                                           spent on          spent on        spent on skills
                                                           developing        uplifting       development
                                                           SMME ICT          communities
                                                           businesses
               98.25
           Most empowered
               telco in                                                                                        18
             South Africa
                                                           R7.2bn            R5bn            R26bn
                                                           to >51% black-    to >30% black   weighted spend
                                                           owned             women-owned     on BEE-status
                                                           suppliers         suppliers       suppliers

Vodacom Group Limited IR presentation | 5 September 2016                18
Additional
                                                           information

Vodacom Group Limited IR presentation | 5 September 2016
Country data

                                                                     South Africa                       Tanzania                           DRC         Mozambique                          Lesotho
 PopulationŦ (million)                                                                  55                          55                         71                          29                           2
 GDP per capitaŦ (USD)                                                             4 770                          855                        495                         456                        887
 GDP growth estimateŦ 2016 (%)                                                         0.7                         6.5                        5.0                         4.8                        2.0
 Ownership (%)                                                                    93.75#                         82.2                          51                          85                         80
 License expiry period                                                              2029                        2031             2028/2032µ                  2018/2026µ                           2036
 Active customers (thousand)                                                     35 112                      12 060                       8 486                       4 817                      1 359
 ARPU (rand per month)                                                                109                          40                          58                          56                         62
 ARPU (local currency per month)                                                      109                      5 876                          3.9                        207                          62
 Minutes of use per month                                                             134                        158                           50                        109                          79

Key indicators for the quarter ended 30 June 2016.
Ŧ The Economist Intelligence Unit.

# 6.25% held indirectly through special purpose entities which are consolidated in terms of SIC 12: Consolidation – Special Purpose Entities as part of the broad-based black economic empowerment transaction.

µ 2028/2018 relates to the 2G license and 2032/2026 relates to the 3G licence.

                                                                                                   20
Vodacom Group Limited IR presentation | 5 September 2016                                           20
Latest results | Q1 results for the quarter ended 30 June 2016
 Sustained robust service revenue growth                                                   R million         Jun 2016   Jun 2015   YoY % Δ
 •  Group service revenue up 7.3% (4.6%*)                                                  Group
 •      SA service revenue growth of 5.6% to R12 426 million                               Service revenue     16 806     15 660       7.3

 •      SA added just under 1 million customers in the quarter                             Revenue             19 902     18 806       5.8
                                                                                           Data revenue         5 786      4 846      19.4
                                                                                           Customers (m)       61 834     63 502      (3.3)
 Strong demand for data services
                                                                                           South Africa
 •      Group data revenue up 19.4%, 34.4% of service revenue
                                                                                           Service revenue     12 426     11 762       5.6
 •      SA active data customers up 6.1% to 18.8 million                                   Revenue             15 443     14 845       4.0
 •      3.1 million LTE/4G customers in South Africa                                       Data revenue         4 691      3 975      18.0
                                                                                           Customers (m)       35 112     33 309       5.4
 International impacted by customer registration                                           International
 •      Service revenue up 13.5% (2.8%*); contributed 26.7% to                             Service revenue      4 479      3 945      13.5
        Group service revenue                                                              Revenue              4 620      4 095      12.8
 •      M-Pesa revenue +47.5%; 10.6 million active customers                               Data revenue         1 095       871       25.7
                                                                                           Customers (m)       26 722     30 193     (11.5)

* Normalised growth adjusted at a constant currency using current year as the base.

 Vodacom Group Limited IR presentation | 5 September 2016                             21
Annual results for the year ending 31 March 2016
 Improved revenue growth and margins                                                                              R million                                       Mar 2016   Mar 2015   YoY % Δ
 •  Group service revenue up 7.4% (5.8%*)                                                                         Service revenue                                   66 763     62 167         7.4
 •      Group EBITDA up 12.8% (10.2%*)                                                                            Revenue                                           80 077     74 500         7.5

 •      Headline earnings per share up 2.7%                                                                       EBITDA                                            30 345     26 905        12.8
                                                                                                                  Operating profit                                  21 059     19 516         9.5
 •      400 cents final dividend per share
                                                                                                                  Operating free cash flow                          17 054     14 003        21.8
                                                                                                                  Free cash flow                                     9 807      7 763        26.3
 Strong demand for data services                                                                                  Capital expenditure                               12 875     13 305        (3.2)
 •      Group data revenue up 28.5%. 31.9% of service                                                             Net debt                                          21 287     16 760        27.0
        revenue                                                                                                   Headline earnings per share
                                                                                                                                                                      883        860          2.7
 •      Group active data customers up 8.6% to 28.8 million                                                       (cents)
                                                                                                                  Dividend per share (cents)                          795        775          2.6
 •      14 million active smart devices in South Africa
                                                                                                                  EBITDA margin (%)                                   37.9      .36.1    1.8 ppts
                                                                                                                  Effective tax rate (%)                              31.5       29.9    1.6 ppts
 Excellent International performance                                                                              Net debt/EBITDA (times)                              0.7        0.6   0.1 times
 •      Service revenue up 16.2% (9.6%*), contributed 26.6% to                                                    Capex intensity (%)                                 16.1       17.9   (1.8 ppts)
        Group service revenue
 •      M-Pesa revenue +19.3%; 9.2 million active customers

* Normalised growth adjusted for trading foreign exchange gains/losses and at a constant currency using current year as base (collectively ‘foreign exchange’).

 Vodacom Group Limited IR presentation | 5 September 2016                                              22
Five-year financials for the year ended 31 March
R million                                             2016        2015          2014     2013     2012    16/15 % Δ    5-year CAGR

Service revenue                                     66 763       62 617        62 047   59 261   58 125         7.4            3.8
Revenue                                             80 077       74 500        73 219   67 781   65 700         7.5            5.1
EBITDA                                              30 345       26 905        27 314   25 253   22 763       12.8             7.5
Operating profit                                    21 059       19 235        20 394   18 897   16 617         9.5            6.1
Operating free cash flow                            17 054       14 003        19 410   18 158   16 934       21.8             0.2
Free cash flow                                       9 807        7 763        13 185   12 136   10 921        26.3           (2.7)
Capital expenditure                                 12 875       13 305        10 779    9 456    8 662        (3.2)          10.4
Net debt                                            21 287       16 760         8 052    8 007    7 667        27.0           15.4
Headline earnings per share (cents)                    883         860           896      872      709          2.7            7.0
Dividend per share (cents)                             795         775           825      785      710          2.6           13.9
EBITDA margin (%)                                      37.9        36.1          37.3     37.3     34.6
Effective tax rate (%)                                 31.5        29.9          30.2     28.3     36.0
Net debt/EBITDA (times)                                    0.7      0.6           0.3      0.3      0.3
Capex intensity (%)                                    16.1        17.9          14.7     14.0     13.2
Return on capital employed (%)                         48.2        50.1          62.1     62.8     63.2

Vodacom Group Limited IR presentation | 5 September 2016                  23
Dividend policy and payment history
 Current dividend payout is 90% of headline earnings per share
The Company intends to pay out as much of its after tax profits as will be available after retaining such sums and repaying s uch
borrowings owing to third parties as shall be necessary to meet the requirements reflected in the budget and business plan, t aking into
account monies required for investment opportunities. There is no fixed date on which entitlement to dividends, arises and th e date of
payment will be determined by the Board or shareholders at the time of declaration, subject to the JSE Listings Requirements.

 Dividend number                             Ex-dividend date    Payment date    Cents per share   Policy payout (%)    Actual payout (%)
 Interim dividend number 1                        30 Nov 2009      7 Dec 2009               110                  40                   50
 Final dividend number 2                           28 Jun 2010      5 Jul 2010              175                  40                   60
 Interim dividend number 3                        29 Nov 2010      6 Dec 2010               180                  60                   60
 Final dividend number 4                           27 Jun 2011      4 Jul 2011              280                  70                   79
 Interim dividend number 5                        28 Nov 2011      5 Dec 2011               260                  70                   80
 Final dividend number 6                           18 Jun 2012    25 Jun 2012               450                  90                  117
 Interim dividend number 7                        26 Nov 2012      3 Dec 2012               355                  90                   90
 Final dividend number 8                           24 Jun 2013      1 Jul 2013              430                  90                   90
 Interim dividend number 9                        25 Nov 2013      2 Dec 2013               395                  90                   90
 Final dividend number 10                          23 Jun 2014    30 Jun 2014               430                  90                   94
 Interim dividend number 11                       24 Nov 2014      1 Dec 2014               375                  90                   90
 Final dividend number 12                          22 Jun 2015    29 Jun 2015               400                  90                   90
 Interim dividend number 13                       30 Nov 2015      7 Dec 2015               395                  90                   90
 Final dividend number 14                          20 Jun 2016    27 Jun 2016               400                  90                   90

Vodacom Group Limited IR presentation | 5 September 2016               24
Investor relations | 2016 Calendar

                     Reporting dates                                           Roadshows/conferences
Date                  Event                            Location        Date              Event                    Location

14 November           H1 2017 results released         Vodacom/        26-27 September   RMB Big 5 conference     Cape Town
                                                       Website
                                                                       10 October        UBS TMT conference       Johannesburg

                                                                       Mid-November      Interims 2017 roadshow   JHB/CT/UK/USA

Vodacom Group Limited IR presentation | 5 September 2016          25
Thank you

Vodacom Group Limited IR presentation | 5 September 2016
Definitions
 Active customers               Active customers are based on the total number of mobile customers using any service during the last three months. This includes
                                customers paying a monthly fee that entitles them to use the service even if they do not actually use the service and those customers who
                                are active whilst roaming.
 Active data customers          Number of unique users generating billable data traffic during the month. Also included are users on integrated tariff plans, or who have
                                access to corporate APNs, and users who have been allocated a revenue generating data bundle during the month. A user is defined as
                                being active if they are paying a contractual monthly fee for this service or have used the service during the reported month.
 ARPU                           Total ARPU is calculated by dividing the average monthly service revenue by the average monthly active customers during the period.

 Contribution margin            Revenue less direct expenses as a percentage of revenue.
 EBITDA                         Earnings before interest, taxation, depreciation and amortisation, impairment losses, profit/loss on disposal of investments, property, plant
                                and equipment, and intangible assets, profit/loss from associate and joint venture, restructuring cost and BEE income/charge.
 Free cash flow                 Cash generated from operations less additions to property, plant and equipment and intangible assets, proceeds on disposal of property,
                                plant and equipment and intangible assets, tax paid, net finance charges paid and net dividends received/paid to minority shareholders.

 HEPS                           Headline earnings per share.
 International                  International comprises the segment information relating to the non-South African-based cellular networks in Tanzania, the Democratic
                                Republic of Congo, Mozambique and Lesotho as well as the operations of Vodacom International Limited and Vodacom Business Africa
                                Group (Pty) Limited and its subsidiaries.
 MOU                            Minutes of use per month is calculated by dividing the average monthly minutes (traffic) during the period by the average monthly active
                                customers during the period.
 Normalised growth (*)          Adjusted for trading foreign exchange gains/losses and at a constant currency (using current year as base) (collectively ‘foreign exchange’).
 Operating free cash flow       Cash generated from operations less additions to property, plant and equipment and intangible assets other than licence and spectrum
                                payments and purchases of customer bases, net of proceeds on disposal of property, plant and equipment and intangible assets, other than
                                license and spectrum payments and disposals of customer bases.
 South Africa                   Vodacom (Pty) Limited, a private limited liability company duly incorporated in accordance with the laws of South Africa and its subsidiaries,
                                joint ventures and SPV’s.
 Traffic                        Traffic comprises total traffic registered on Vodacom’s mobile network, including bundled minutes, promotional minutes and outgoing
                                international roaming calls, but excluding national roaming calls, incoming international roaming calls and calls to free services.

Vodacom Group Limited IR presentation | 5 September 2016                              27
More information
Visit our website for more information
                                                           Follow us on social media

                                                              @vodacom
                                                              Facebook.com/vodacom

                                                           Contact us
                                                           VodacomIR@vodacom.co.za
                                                           +27 11 653 5055

http://www.vodacom.com/about-us/investors/investors-home

Vodacom Group Limited IR presentation | 5 September 2016
You can also read