Lawrence Flynn, CEO February 2019 - Artificial Solutions
←
→
Page content transcription
If your browser does not render page correctly, please read the page content below
Lawrence Flynn, CEO February 2019
TODAY’S PRESENTERS

 Lawrence Flynn      Chris Bushnell   Andreas Wieweg
      CEO                 CFO              CTO
AGENDA 1. Introduction to Conversational AI 2. About Artificial Solutions 3. Conversational AI Market Opportunity 4. Teneo Conversational AI platform 5. Scalable & Profitable Model 6. Growth 7. Financial overview 8. Experienced Management 9. Summary & Close 10. Appendix
Conversational AI
“By 2020, 500m+ consumers
will use voice-enabled
Conversational AI to
purchase on digital
commerce platforms”

        Gartner: Top Strategic Predictions for 2018 and Beyond (Published: 29 September 2017 ID: G00340316)
“By 2020, 25% of
customer service and
support operations will
integrate virtual customer
assistant technology”
Gartner Trend Insight Report “Predicts 2019: Leadership Means Expanding Options, Not Limiting Them”“Conversational platforms
will drive a paradigm shift
in which the burden of
translating intent shifts
from user to computer”
Gartner: Top Strategic Predictions for 2018 and Beyond (Published: 29 September 2017 ID: G00340316About Artificial Solutions
A CONVERSATIONAL AI PIONEER
▪ The world’s most advanced, conversational AI platform – Teneo.
▪ Supports 35 languages, delivering millions of conversations annually.
▪ 104 staff1 (inc. 52 AI, ML and linguistic experts).
▪ HQ in Stockholm, offices in 7 countries.
▪ Patents valued at $96m2; further patents pending.

                                        Global Blue-Chip Clients

                                           Strategic Partners

                                                                   ¹Artificial Solutions had at the end period ending 31 December 2018, 104 full time employees
                                                                                                                  ² IP portfolio valued by Oxfirst Ltd January 2016
Conversational AI platform for enterprises that allows non-specialists to rapidly develop, deploy and analyze artificially intelligent conversational applications
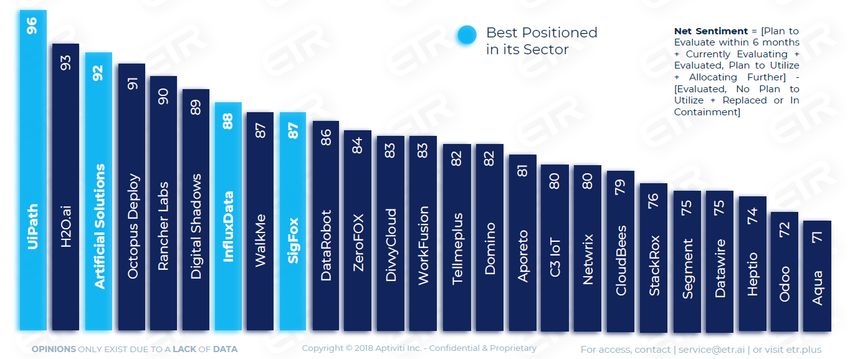
LEADING TECHNOLOGY COMPANIES TO WATCH

                                                     - In the recent
                                                    independent “Emerging
                                                    Technology Study” by
                                                    research group ETR,
                                                    Artificial Solutions
                                                    was listed as a “company
                                                    to keep an eye on”.

                                https://etr.plus/products/the-state-of-emerging-technology-in-the-enterprise-ets
HISTORIC RECORD & FUTURE VISION
Investment Transformation Commercialization Growth
▪ Scope invests in ▪ Lawrence Flynn joins ▪ Expansion into US ▪ New customers with
Artificial Solutions. as CEO. with new office in ‘2nd generation’
▪ Huge ‘data-lake’ of ▪ Company pivots to Silicon Valley. projects for
human-machine product-led ▪ Strong focus on early- conversational
language data built. conversational AI adopters in global systems secured.
▪ European and Nordic software business. enterprises. ▪ Global partner network
heritage from start – ▪ Teneo developed by ▪ Addition of new-name, endorse technology &
key differentiator & some of the best flagship accounts to deliver scalability
core to multilingual computational the portfolio.
approach. linguistic talent in 2019-
Europe.
2015-18
2010-14
2008Conversational AI Market Opportunity
MARKET OPPORTUNITY FOR CONVERSATIONAL AI

                           Artificial intelligence revenue, world markets
 70
                                         2016-2025 (USDbn)1
 60

 50

 40

 30

 20

 10

 0
      2016   2017   2018     2019       2020       2021       2022          2023   2024                   2025

                                                                                     1Tractica   “Artificial Intelligence Market Forecasts” Q3, 2018
“Overall global intelligent
virtual assistants market set
to reach $22.3bn by 2025 , 1
with 38.8% CAGR 2017-23 ” 2
1Tractica Natural Language Processing Q3 2017
² Markets&MarketsDEMAND DRIVERS
Customer expectations are changing.
Increasingly, they demand conversational understanding.
Data is the new oil.
Conversational data is the king of all data.
Amazon Echo & Google Home remove hurdles to user acceptance.
Not designed as enterprise strength platforms; they do not easily deliver
cross-device capabilities and data ownership is a major concern.BENEFITS
Counter the Customer Reduce cost and Improve the Customer
Disconnect optimize resources relationship
Derive actionable Deliver individualized Vital market
insight service to everyone differentiationConversational AI for Enterprise
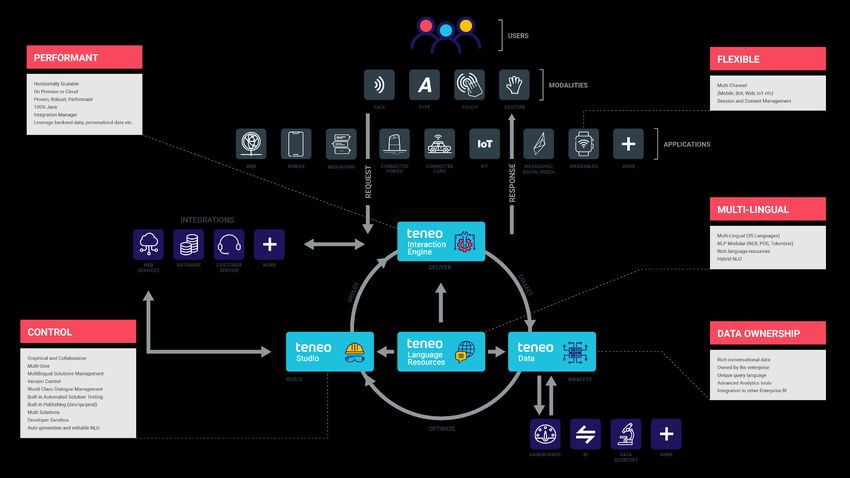
THE TENEO PLATFORM
TENEO ARCHITECTURE
TENEO’S FOUNDATIONS

▪ Easily create               ▪ The ‘humanlike’ brain   ▪ Analytics and            ▪ Multilingual capabilities
   conversational apps for      of the conversational     reporting application       key - 35 languages
   vast range of use cases      application               provides insights into      already supported, with
                                                          customers                   ability to scale

▪ Utilizes unique hybrid      ▪ Uses rules and
   approach to building         advanced linguistics    ▪ Track response and       ▪ Machine learning
   conversational solutions     to decide replies and     behaviour from              combined with expertise
                                actions                   analysing customer          of experienced linguists,
                                                          conversations               used to map out the
                                                                                      structure of languages
TENEO PROTECTED THROUGH IP PORTFOLIO
Five key patents valued at USD96m1 underpin the majority of Artificial Solutions’ product site
Network of Virtual Assistants A system for the operation of a virtual assistant (VA) network, comprising a plurality of VAs and related brokers operating
on network-connected devices, wherein the VAs receive user requests and send these to VA brokers which delegate these
to other VAs for fulfilment.
(Patent nos 9172747; filing 12/11/2014; US)
Teneo: Core The system comprises a dialogue interface module, a natural language engine, a solution data repository per domain and
language, and a plurality of flow elements and rules for managing interactions with users, and an interface software model.
(Patent nos 8346563; filing 30/12/2012; US)
Teneo: Development Conversational AI applications enable users to interact with technology in a humanlike manner. This patent covers the
data, training, automation
system, methods and tools to build, test and optimise such applications in a semiautomatic manner utilising usage data in
the form of transaction log files.
(Patent nos 8892419 & 8903711; filing 04/12/2012; US)
Teneo Data A system for natural language (NL) analytics, comprising a NL application data importer, a NL application data augmenter
(Patent pending)
that enriches the data, and an analytics component which provides a means of querying and analysing structured and
unstructured data.
(Patent pending; filing 13/05/2015; US)
Teneo Hybrid Methodology A system for combining both linguistic and machine learning approaches for developing, optimizing and executing
conversational interaction applications.
(Patent nos 10068174; filing 04/09/2018; US)
1 IP portfolio valued by Oxfirst Ltd January 2016WHAT MAKES TENEO UNIQUE?
Conversational Enterprise Hybrid Data Proven
Delivers a humanlike, Teneo is the only Uses linguistic and Leverage conversational Award winning and
intelligent user platform designed for machine learning for data to achieve a already implemented by
experience enterprise use optimal performance competitive edge enterprises worldwideDATA
Conversational Data Data Privacy and Security is critical.
is the ‘New Oil’ Core feature in TeneoWHY ENTERPRISES USE TENEO ▪ New channel for customer engagement ▪ Adds differentiation ▪ Increases customer satisfaction ▪ Reduces churn ▪ Drives revenues ▪ Reduces costs
Scalable and Profitable Model
POSITIONED FOR RAPID GROWTH
▪   Highly scalable and profitable business model.
                                                                               Professional Services
▪   Utilize partner channel for sales and services to drive fast
    growth.
▪   35 languages differentiates and provides opportunity to                                                                             90% margin

                                                                                   Automotive
    target new geographies.

                                                                     Telecom

                                                                                                Banking

                                                                                                                          Oil and gas

                                                                                                                                          Banking
                                                                                                                Telecom
▪   During 2018-20, revenue will shift to higher gross margin
    license/usage fees.
▪   Usage fees grow as client usage increases.
                                                                                 30 % margin
▪   License and usage fee grow as each client implements new
                                                                                                                           # Customers
    use cases (additional channels, languages, applications).                                                                Platform
                                                                                                                          Device licenses
                                                                                                                           Applications
                                                                                                                            Languages
                                                                                                                              Usage
                                                                   *Industries and companies used as examples
LEVERAGING THE PLATFORM FOR SCALABILITY
▪ The initial installation of the platform is a
High
low gross margin business rolled out with EURk
the help of partners 1,200
▪ After the lower gross margin of the revenue 1,000
decreases, the allocation in skewed towards
the higher margin license and usage fees 800 Low
▪ After the initial investment, companies often 600
add services and products with high
margins 400
▪ Once the Teneo platform and its additional 200
offerings have been implemented, customer
stickiness is achieved 0
Year 1 Year 2 Year 3 Year 4
Margin PS License UsageGrowth
STRONG ORGANIC GROWTH PLAN
▪ Lighthouse accounts secured:
   – Expand within same verticals.
   – Across similar use-cases.
▪ Partner channel of global SIs and digital agencies established.
   – Global sales channel, direct access to C-level contacts in target enterprise accounts.
   – Services delivered through partners providing reliable scalability.
▪ Model underpinned by proven technology.
▪ Majority of R&D costs complete - when revenue grows, dev costs will remain flat.
THE FUTURE AI POWERHOUSE
                                                                              Data-centric enterprise AI platform
▪   Conversational AI is the ‘face of AI’. Teneo is
    already proven in this sector, delivering enterprise-
    strength solutions.
    Conversational AI is critical but only part of the
                                                                                                                           Emotion     Tracking
▪                                                                                Eye
                                                                              tracking
                                                                                          Touch
                                                                                                           Face
                                                                                                        recognition        detection   systems

    story:
     – The next step will be to extend Teneo, turning
       it into a full-stack AI Platform for enterprises
       where AI assets can be seamlessly integrated.
                                                                                                  Enterprise AI Platform

     – This will be achieved through in-house
       development, technology partnerships and
       strategic acquisitions.
▪   Artificial Solutions will become the Nordic-based
    AI powerhouse:
     – Positioning Teneo in the hyper-growth AI
       sector.
▪   Artificial Solutions will differentiate through
    rigorous focus on the enterprise.                        Smart    Autonomous         Connected        Smart             TV &          Health   Many More
                                                            Devices    Vehicles           Homes           Cities            Media
Financial overview
REVENUE MODEL
Professional Services                                                                          Net sales
                                                         Services
▪   Professional Services is priced at the number of                 Professional
                                                                                                (EURk)
                                                                    Services (direct
    days multiplied by the applicable rate(s)                         or through
                                                                       partner)
Licenses                                                 Licenses                                4,951
▪   License fees for a specific term, typically 1 to 3                                                     4,389
                                                                     Annualised
    years, and relates only to the Teneo platform                   Teneo License
                                                                                       3,620
▪   Includes Support and Maintenance service with a
    price of 17% of license fee but does not include                 Annualised
                                                                     Hosting Fee
    hosting support
Success based usage fees                                               Support &
                                                                      Maintenance
▪   Relate to customer’s business – scale as usage is
    driven by successful outcomes with fees driven by     Usage
    “Sessions per annum”                                            Success based
                                                                    usage recurring
                                                                    revenue model

                                                                                       2016      2017      2018
ORDER INTAKE AND BACKLOG
Order intake (EURk)
▪ Order intake includes the value of contractually 5,544 5,410
4,304
committed orders received from customers during the
period 4,047
2,705
― As the number of partner’s grow, the share of order intake
4,003
increases 2,705
CAGR
200%
― The partner share expects to increase in the upcoming years 301
1,497
and due to their reach, the number of received committed 2016 2017 2018
orders will most certainly grow
Partner Other
Order backlog (EURk)
▪ Order backlog includes the value of contractually
committed orders received from contractors which 3,426
have not yet been recognized as revenue
2,303
― Provides a projection for future revenues 1,820
― Preferred measurement that reflects the business’ future
performance
2016 2017 2018INCREASING PROFITABLE REVENUE TYPES
Clear shift towards more profitable revenue types boosting 2016
gross margin YoY Usage
Hosting
6%
5%
Licenses
Share of revenue (%) 30%
EUR
3.6m
52% 2017
Services Support
49% Other Revenue
52% 6%
Hosting 3%
45% 7% Licenses
Usage 31%
14%
EUR
38%
5.0m 2018
37% Hosting
35% Other Revenue
Support 7% 1%
Services 7% Usage
38% 12% Licenses
37%
EUR
2016 2017 2018 4.4m
Licenses and Usage Professional Services
Services
Support
37%
7%CUSTOMER CONCENTRATION
Artificial Solutions catering to customers in several Top 5 largest customers, 2018
industries
Customer 1
20%
Financial Smart homes
Retail Automotive
services & IoT Other
Customer 2
9%
49%
Customer 3
8%
Customer 4
Customer 5 8%
Energy & Travel & 7%
Telecom Entertainment
Utilities LeisurePARTNER FOCUS BOOSTING GROSS MARGIN
Reasons for increase in gross profit
1 Increasing share of high margin revenue
53%
2 Increasing sales through partners 52%
3,669
45%
▪ The reach and scalability achieved through the partner channel 3,229
drives an increased gross profit and higher margins
2,321
―Lower cost associated to sales through the partner channel
―Possibility to further increase gross profit and gross profit
margin through a larger Partner network, which is in focus
2016 2017 2018
% Gross margin (%) Gross profitPARTNERSHIP VS DIRECT SALES
Partner sales channel Partner share of revenue,
(EURk)
▪ Shifting sales model to partners as a strong CAGR Partner
108%
complement to the traditional direct sales
model
18%
―Artificial solutions ensures scalability by 32%
including partner sales channels
891
―Ensures easy geographical expansion 9%
through global partners at no extra cost 1,404
326
―Quality leading partners validate the
Teneo software
―Direct sales will still support order intake 4,060
going forward 3,294 2,985
Trusted Partners
2016 2017 2018
Direct Partner % Partner % of revenueOPERATING EXPENSES
Comments OPEX (EURk), 2018
▪ An increase in personnel costs due to a change in mix
of staff and new hires
4,785 15,352
▪ The raise in costs of existing and new personnel is a
result of the need of building sales and partner
channels and boost market awareness
▪ New offices in Chicago and Barcelona 1,941
2,325
2,501
3,800
Sales Operations R&D Other Other OPEX
spend Personel operating
costs expensesR&D SPEND
Comments Total spend R&D (EURk)
▪ Majority of R&D costs complete 2,227 2,325
1,896
▪ An increase in investments for R&D operations 2018 to
facilitate the continuing improvement of the Teneo
Platform
▪ Additional investments for 2019 mainly consisting of
R&D financed through funds currently available 2016 2017 2018
▪ Artificial Solutions has its own dedicated organization
Total capitalised R&D (EURk)
for R&D with highly experienced software engineers and
data specialists 1,187
872
636
2016 2017 2018NEGATIVE EQUITY – WHY?
Subsidiaries -
Parent company - Subsidiaries
Group
Owning shares
Parent
Subsidiaries
company
Provides finance Reports current losses
Subsidiaries Group Group Equity
No current losses
reported
Parent
Subsidiaries
company Current losses from
subsidiaries has a negative
Impairment test is
impact on the Group’s
carried out in
equity
transactions that
may affect equity in
parent company
The Group’s total losses > Parent company’s
reported losses → Current equity situationDEBT STRUCTURE POST RTO
Total debt post RTO (EURk)
Repayment
Repayment
July 2020
June 2020
Not all amount
utilized 108
Repayment
June 2020 7,250
Repayment
June 2020
1,050
17,264
Repayment
May 2020 8,200
Repayment
overdue
491
165
Maranelle bond Bond Leman venture debt Massellaz loan Loan agreement Almi loan Total
1EUR/SEK 10.5916 (22/02/2019)FINANCIAL TARGETS Order intake on medium Gross margin Positive cash flows and long term shall grow above 70 per cent as from operations as in excess of NLP market from 2020 from 2020
Experienced
Management
BOARD OF DIRECTORS
    Åsa Hedin (1962) – Chairman of the Board since 2019.                  Jan Uddenfeldt (1950) – Board Member since 2019.
    Board member since 2019.                                              Within the Group since 2015.
    Chairman and CEO of ASH & Partners AB. Board member of Tobii          Board member of GLO AB. Senior Advisor at Telefonaktiebolaget
    AB, E. Öhman J or Fonder AB, Nolato Aktiebolag, CellaVision AB, C-    LM Ericsson and Sony Corporation America, Inc. Advisory Board
    Rad AB, Immunovia AB (publ), All Tomorrows Parties AB, Fidemso        member of Swift Navigation, Inc, Redshift Networks, Inc., Agnity
    AB, HerMed Group Holding AB, BoardClic AB and Neonode, Inc.           Global, Inc. and Sentons USA, Inc.

    Johan Ekesiöö (1954) – Board member since 2019.
    Chairman of MetaForce AB and T&V Holding AB. Chairman and CEO         Bodil Eriksson (1963) - Board member since 2019.
    of Johan Ekesiöö AB. Board member of Aktiebolaget Svensk              Chairman of Sunfleet Carsharing AB. Board member of Swedbank
    Bilprovning, WTS Positioning Solutions AB, Zenterio AB (publ),        AB. CEO of Volvo Car Mobility AB.
    Ripasso Energy AB (publ) and Lingit AS..

                                                                         Johan Gustavsson (1963) – Board member since 2019.
    Fredrik Oweson (1968) – Board Member since 2019.                     In Artificial Solutions since 2001 (co-founder).
    In Artificial Solutions Holding since 2008.                          Chairman of Aros Bostadsutveckling AB, Vencom AB, Vencom
    Chairman of Mijesi Advisory AB and Mijesi Aktiebolag. Board          Property Partners AB, Vencom Residential AB, Hop Lun International
    member of Scope Capital SA, Zenterio AB (publ) and Woffel SA.        Ltd, Hobbex New Retail AB, Hober Medical AB, Improva Plastikkirurgi
    Co-founder and partner of Scope Capital Advisory AB.                 AB, Lidrup AB, Roslagsterminalen AB, Getängsvägen AB, Bromma
                                                                         Blocks Centrumhandel AB, Trafikflyget 1 i Stockholm AB, Trafikflyget 3
                                                                         i Stockholm AB, Trafikflyget 5 i Stockholm AB, Trafikflyget 7 i
                                                                         Stockholm AB and Trafikflyget 9 i Stockholm AB
PROVEN MANAGEMENT TEAM Lawrence Flynn Chris Bushnell Andreas Wieweg Andy Peart CEO CFO CTO CMO 25+ years experience 25+ years experience 20+ years experience 25+ years experience Peter Roost Darren Ford Gareth Walters Dave Parsin COO VP Global Customer Services VP Innovation & Community VP Strategic Sales 25+ years experience 20+ years experience 20+ years experience 25+ years experience
Summary
SUMMARY
1. Enterprise software company operating in the AI sector, a $59.8 billion market¹ by 2021

2. Patented AI platform that allows people to interact in 35 languages with connected technology
   and devices in an intelligent, humanlike, conversational way

3. Positioned to scale rapidly in a high growth addressable market

4. Success based usage fees on top of license model creates attractive recurring revenue model
5. Technology validated by global blue-chip customers: conversational AI platform of choice for
   global network of system integrators.
6. Highly experienced senior management team with track record of successful IPOs and exits

                                                                            1Tractica   “Artificial Intelligence Market Forecasts” Q3, 2018
Appendix
INCOME STATEMENT
  EUR000
Euro' ‘ 000                           FY
                                       FY2016
                                          2016    FY 2017
                                                  FY 2017    FY 2018
                                                              FY2018

Net Sales                                3,620      4,951      4,389

Capitalised amount for own accounts        636        872      1,187

Other operating income                     901      1,234        517

Total income                             5,158      7,057      6,093

Operating Expenses

Other external costs                    (3,379)    (4,278     (5,022)

Personnel costs                         (7,873)    (9,572)   (10,326)

Depreciation & Amortisation             (2,293)    (2,641)    (2,320)

Other operating expenses                    (2)      (0.3)        (3)

Operating loss                          (8,389)    (9,435)   (11,579)

Interest income and similar items          278        449        366

Interest expenses and similar items     (2,059)    (1,941)    (3,023)

Tax                                         (3)          -        (2)

Net Loss / Profit                      (10,174)   (10,927)   (14,238)
CASH FLOW STATEMENT
EUR000
Euro' ‘ 000 FY
FY2016
2016 FY 2017
FY 2017 FY 2018
FY2018
Operating activities (audited) (audited) (audited)
Operating loss (8,389) (9,435) (11,579)
Adjustments for items excluded from cash flow statement
Depreciation 2,293 2,641 2,320
Other items excluded 1,036 320 30
(5,061) (6,474) (9,229)
Interest received 208 363 298
Interest paid (879) (888) (1,740)
Taxation paid and received (513) 140 0
Cash flow from operating activities before changes in Working capital (6,245) (6,858) (10,671)
Cash flow from changes in working capital
Increase/decrease in receivables 66 359 (1,961)
Increase/decrease in liabilities (435) 360 740
Cash flow from operating activities (6,613) (6,139) (11,810)
Investing activities
Payments to acquire tangible fixed assets (112) (63) (25)
Payments to acquire intangible fixed assets (640) (882) (1,244)
Cash flow from investing activities (752) (945) (1,269)
Financing activities
New share issue 8,267 3,833 12,820
Cost of new share issue (179) (187) (346)
New issues of shares non-registered 1,245 - -
Change in loans (1,304) 3,118 4,678
Cash flow from financing activities 8,029 6,764 17,152
Net change in cash and cash equivalent 664 (320) 4,073
Cash and cash equivalents beginning of the year 147 810 491
Cash and cash equivalents end of the year 810 491 4,564BALANCE SHEET
Euro
EUR' 000
‘ 000 FY2016
FY 2016 FY 2017
FY 2017 FY2018
FY 2018
ASSETS
Fixed assets (audited) (audited) (audited)
Intangible assets
Capitalised expenditure for licences software & content development 3,480 3,107 2,870
Goodwill 2,081 767 0
Tangible assets
Equipment, furniture and fittings 240 227 174
Total fixed assets 5,801 4,100 3,044
Other non-current receivables 380 517 538
Total non-current assets 6,181 4,618 3,581
Current assets
Current receivables
Accounts receivables - trade 734 399 560
Tax receivables 515 369 883
Other receivables 109 88 329
Prepaid expenses and accrued income 609 583 470
Cash and bank balances 810 491 4,564
Total current assets 2,777 1,930 6.804
Total assets 8,958 6,547 10,386BALANCE SHEET
EUR' 000
Euro ‘ 000 FY
FY2016
2016 FY 2017
FY 2017 FY 2018
FY2018
Equity & Liabilities
Equity (audited) (audited) (audited)
Share capital 2,849 3,092 3,646
Share premium reserve 58,128 62,776 75,566
Other Equity including result (62,784) (73,394) (87,638)
Total equity (1,807) (7,526) (8,427)
Long term liabilities
Liabilities to other lenders 4,715 2,537 5,102
Total long-term liabilities 4,715 2,537 5,102
Current liabilities
Liabilities to other lenders 2,609 7,776 9,132
Accounts payable – trade 167 395 364
Income tax liability 11 5 2
Other liabilities 183 241 347
Accrued expenses and deferred income 3,080 3,119 3,866
Total current liabilities 6,050 11,536 13,711
Total equity and liabilities 8,958 6,547 10,386www.artificial-solutions.com
www.nlinews.com
info@artificial-solutions.comYou can also read