HORIZONTAL POSITIONAL ACCURACY OF GOOGLE EARTH'S IMAGERY OVER RURAL AREAS: A STUDY CASE IN TAMAULIPAS, MEXICO
←
→
Page content transcription
If your browser does not render page correctly, please read the page content below
BCG - Boletim de Ciências Geodésicas - On-Line version, ISSN 1982-2170
                                                http://dx.doi.org/10.1590/S1982-21702013000400005

    HORIZONTAL POSITIONAL ACCURACY OF GOOGLE
EARTH’S IMAGERY OVER RURAL AREAS: A STUDY CASE
                             IN TAMAULIPAS, MEXICO

Exactitud posicional horizontal de las imágenes de Google Earth en áreas rurales:
                   Un caso de estudio en Tamaulipas, México.

                      CUTBERTO URIEL PAREDES-HERNÁNDEZ1
                       WILVER ENRIQUE SALINAS-CASTILLO1
                          FRANCISCO GUEVARA-CORTINA2
                        XICOTÉNCATL MARTÍNEZ-BECERRA2
                 1
                  Unidad de Geomática, Instituto de Ingeniería y Ciencias,
                     Universidad Autónoma de Tamaulipas, México
                               2
                                 GeoExpert S.C., México
                                 cparedes@uat.edu.mx

                                   ABSTRACT
Due to the popularity of Google Earth (GE), users commonly assume that it is a
credible and accurate source of information. Consequently, GE’s imagery is
frequently used in scientific and others projects. However, Google states that data
available in their geographic products are only approximations and, therefore, their
accuracy is not officially documented. In this paper, the horizontal positional
accuracy of GE’s imagery is assessed by means of comparing coordinates extracted
from a rural cadastral database against coordinates extracted from well-defined and
inferred check points in GE’s imagery. The results suggest that if a large number of
well-defined points are extracted from areas of high resolution imagery, GE’s
imagery over rural areas meets the horizontal accuracy requirements of the ASPRS
for the production of “Class 1” 1:20,000 maps. Nonetheless, the results also show
that georegistration and large horizontal errors occur in GE’s imagery.
Consequently, despite its overall horizontal positional accuracy, coordinates
extracted from GE’s imagery should be used with caution.
Keywords: Google Earth; Horizontal Positional Accuracy; Horizontal RMSE;
CE95

Bol. Ciênc. Geod., sec. Artigos, Curitiba, v. 19, no 4, p.588-601, out-dez, 2013.
Paredes-Hernández, C. U. et al. 589
RESUMEN
Debido a la popularidad de Google Earth (GE), los usuarios asumen que es una
fuente de información creíble y exacta. En consecuencia, imágenes de GE son
frecuentemente utilizadas en proyectos científicos y de otras índoles. Sin embargo,
Google especifica que los datos disponibles en sus productos geográficos son solo
aproximaciones y, por lo tanto, la precisión de dichos productos no es documentada
oficialmente. En este artículo, la exactitud posicional horizontal de las imágenes de
GE se evalúa por medio de la comparación de coordenadas extraídas de una base de
datos catastral rural contra coordenadas extraídas de puntos de verificación bien
definidos e inferidos en las imágenes de GE. Los resultados sugieren que si se
extrae un gran número de puntos bien definidos de áreas con imágenes de alta
resolución, las imágenes de GE en áreas rurales cumplen con los requisitos de
exactitud horizontal de la ASPRS para la producción de mapas 1:20,000 de “Clase
1”. No obstante, los resultados también muestran que existen errores de
georeferenciación y otros errores horizontales grandes en las imágenes de GE. Por
consiguiente, a pesar de la exactitud posicional horizontal de GE, coordenadas
extraídas de imágenes de GE deben ser usadas con precaución.
Palabras clave: Google Earth; Exactitud Posicional Horizontal; EMC Horizontal;
CE95
1. INTRODUCTION
Google Earth (GE) is the most popular virtual globe that offers free access to
high resolution imagery for most of the planet. Since the launch of the program in
2005 by Google, it has been downloaded more than 1 billion times to desktop and
mobile clients (GOOGLE, 2011). Unfortunately, given the popularity of GE, users
tend to assume that it is an accurate source of information and also tend not to
question its credibility (FLANAGIN; METZGER, 2008). Also, the practice of GE
of reporting coordinates with a precision that does not match its accuracy misleads
users to believe that it is an accurate source of information (GOODCHILD et al.,
2012). Moreover, Benker, Langford and Pavlis (2011) note that Google
representatives state that the coordinates provided by Google are approximations
only and that, therefore, Google makes no claims as to the accuracy of their
geographic information products (GOOGLE, 2008, 2009). However, in 2008,
Google initiated a project called “Ground Truth” in order to increase the accuracy of
their geographic products by means of acquiring data from authoritative sources
(GOOGLE, 2012) such as INEGI (the Mexican National Institute for Geography
and Statistics) and NGA (the USA National Geospatial-Intelligence Agency).
As a result of its popularity, GE is commonly used by the scientific community
in their projects. GE has been used, for example, to collect ground control points
(GCPs) for orthorectification of satellite imagery (YOUSEFZADEH; MOJARADI,
2012), to estimate urban vegetation cover (DUHL; GUENTHER; HELMIG, 2012),
to visualize the output of scientific experiments (WHEATON et al., 2012;
Bol. Ciênc. Geod., sec. Artigos, Curitiba, v. 19, no 4, p.588-601, out-dez, 2013.590 Horizontal positional accuracy of Google Earth’s imagery...
PERISSIN; WANG; LIN, 2012), to map landslides (PERUCCACCI et al., 2012)
and as reference data to evaluate land cover datasets (CHA; PARK, 2007;
NOWAK; GREENFIELD, 2010), among other applications. In most of the
scientific applications listed above, the authors of the papers have exercised some
caution with regards to the accuracy of GE. Therefore, in order to understand and
reduce the uncertainties associated with the use of GE in different applications,
accuracy assessments of GE’s imagery are required (POTERE, 2008; YU; GONG,
2012).
Consequently, a series of accuracy assessments of GE’s imagery have been
undertaken by different researchers. Potere (2008) evaluated the horizontal
positional accuracy of GE’s imagery using control points extracted from the Landsat
GeoCover dataset and estimated a global horizontal root mean squared error
(RMSEr) of 39.7 m. However, the horizontal accuracy of Landsat GeoCover, about
50 m RMSEr (TUCKER; GRANT; DYKSTRA, 2004), is larger than the accuracy
estimated for GE. Therefore, the results should be interpreted conservatively due to
the uncertainty introduced by the dataset used as reference (POTERE, 2008). In a
similar global study, Becek and Ibrahim (2011) estimated GE’s global horizontal
mean error in 113 m, with errors in the range from 10 to 1,500 m, using as reference
runways compiled from multiples sources. Unfortunately, since Becek and Ibrahim
(2011) do not state the estimated accuracy of the dataset they used in their study,
their results should also be handled with caution.
Regarding regional studies, Benker, Langford and Pavlis (2011) used high-
precision field measurements (Paredes-Hernández, C. U. et al. 591
results of the study case and, finally, draw a series of conclusions from the results of
this and other studies.
2. DATASETS AND METHODOLOGY
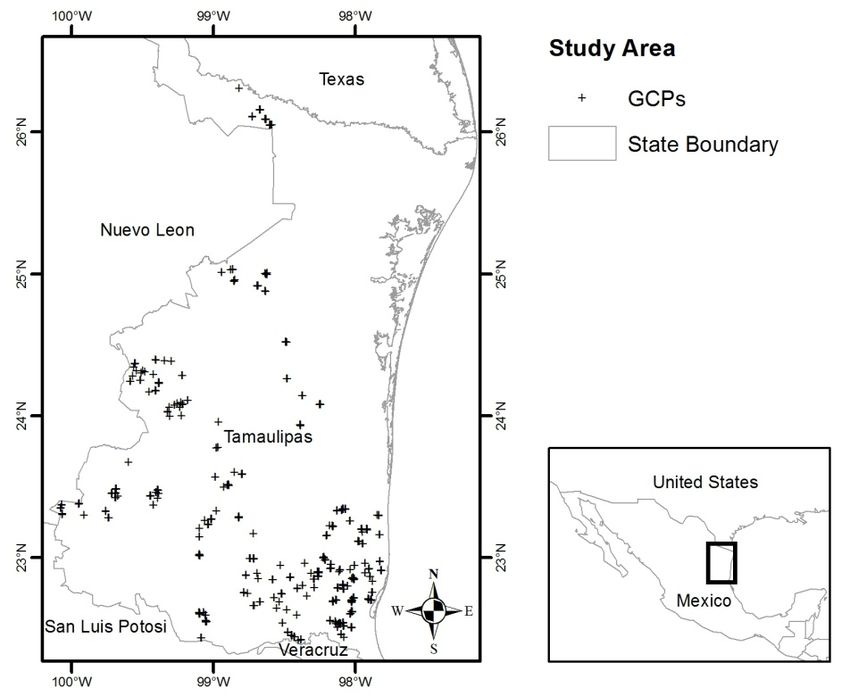
In this study, the horizontal positional accuracy of GE’s imagery is assessed
using as reference 466 parcel vertices (Figure 1) extracted from a rural cadastral
survey undertaken by the Mexican National Institute for Geography and Statistics
(INEGI, 2013). The vertices were extracted from fenced grazing parcels located on
flat terrain in Tamaulipas, Mexico. The description of both datasets GE’s imagery
and the parcels survey by INEGI is presented in the following two subsections.
Figure 1 – Study area and the location of 466 check points (CPs) used to assess the
horizontal positional accuracy of GE’s imagery.
2.1 Google Earth’s Imagery
GE’s imagery is compiled from a variety of sources that include both
commercial and public data providers (GOOGLE, 2013a). Therefore, the spatial
resolution of GE’s imagery is not uniform and areas of high, medium and low
resolution coexist. The provider of most of the high resolution imagery (pixel size
of less than 1 m) for GE is Digital Globe (DG) (POTERE, 2008), a company that
owns QuickBird and WorldView-1 and 2. Digital Globe (2013) claims that
Bol. Ciênc. Geod., sec. Artigos, Curitiba, v. 19, no 4, p.588-601, out-dez, 2013.592 Horizontal positional accuracy of Google Earth’s imagery...
Quickbird imagery has a circular error at the 90% confidence interval (CE90) of 23
m and that WorldView-1 and 2 have a CE90 of 5 m. For the area covered by this
study, some of GE’s imagery is acquired using CNES’ SPOT5, which has a CE90
of 50 m without ground control points (GCPs) (CNES, 2013). Google does not
document the level of processing (e.g. geometric correction, orthorectification)
applied to any of these data sources before adding them to GE.
Since major changes are likely to occur seasonally in agricultural fields and in
order to reduce errors introduced by changing conditions between data and
reference data collection, only vertices from fenced grazing parcels were selected as
CPs, where changes are less prone to occur due to the cost of relocating fences.
Furthermore, in areas where high resolution imagery was available in GE, only
those vertices that where either visible (well-defined points; Figure 2) or could be
inferred from fences (Figure 3) were selected as CPs. In areas of medium resolution,
grazing fields were also used but the location of the vertices was inferred visually
based on changes in land cover. A total of 466 vertices (Figure 1) were visually
identified as suitable to be used as CPs. The x,y coordinates (or Easting and
Northing, respectively) of these vertices were extracted manually from GE, which
was set up to display coordinates using the Universal Transverse Mercator (UTM)
coordinate system with a WGS84 datum (GOOGLE, 2013b). All coordinates
extracted from GE fall within the UTM Zone 14 coordinate range.
Figure 2 – Visible vertex of a fenced grazing parcel used as a well-defined check
point. The center coordinates of the figure are 24.106036° N, 99.177950° W.
© 2013 Google. © 2013 DigitalGlobe.
Bol. Ciênc. Geod., sec. Artigos, Curitiba, v. 19, no 4, p.588-601, out-dez, 2013.Paredes-Hernández, C. U. et al. 593
Figure 3 – The location of the parcel vertex obscured by trees was inferred from
nearby fences and used as a check point. The center coordinates of the figure are
22.690971° N, 98.022363° W. © 2013 Google. © 2013 DigitalGlobe.
2.2 INEGI Parcels (reference dataset)
The dataset used as reference in this study was extracted from a cadastral
survey of the rural social property in Mexico undertaken by INEGI (2013) using
both field measurements and photogrammetric techniques. Field measurements
were collected using dual-band GPS and topographic total stations with an accuracy
of less than 1 m RMSEr. Photogrammetric measurements were collected from high
resolution aerial orthophotos with maximum horizontal errors of 2 m (RAN, 1995).
For this study, the parcels dataset was accessed through INEGI’s web map service
(WMS) and the coordinates (x,y) of the parcel vertices selected as CPs in GE were
extracted manually. The coordinates from the reference dataset were also extracted
in the UTM coordinate system with a WGS84 datum in order to be able to compare
the coordinates of both data sources without the need of coordinate system
transformations.
2.3 Accuracy Assessment (Methodology)
Once the coordinates of the CPs were extracted from both datasets, GE’s
imagery horizontal positional accuracy was assessed in terms of x, y and horizontal
root mean squared error (RMSEx, RMSEy and RMSEr, respectively) (equations
taken from FGDC (1998)):
Bol. Ciênc. Geod., sec. Artigos, Curitiba, v. 19, no 4, p.588-601, out-dez, 2013.594 Horizontal positional accuracy of Google Earth’s imagery...
(1)
∑ , ,
(2)
∑ , ,
(3)
where: xdata,i, ydata,i are the coordinates of the ith point in the evaluated dataset,
xreference,i, yreference,i are the coordinates of the ith point in the independent
reference dataset of higher accuracy,
n is the number of CPs, and
i is an integer that ranges from 1 to n.
Horizontal accuracy at the 95% confidence level (CE95) was computed for
both anisotropic and non-anisotropic accuracies. For anisotropic accuracies, where
RMSEx ≠ RMSEy and the proportion between RMSEmin and RMSEmax is between
0.6 and 1.0, CE95 was computed as (FGDC, 1998):
95~1.2238 (4)
For non-anisotropic accuracies, where RMSEx = RMSEy, CE95 was computed
as (Ibid.):
95 1.7308 (5)
Mean horizontal error and error standard deviation were calculated from the
set of individual horizontal errors:
(6)
, , , ,
RMSEr, RMSEx, RMSEy, CE95, mean horizontal error and horizontal error
standard deviation were computed for the full CP dataset and for relevant CP
subsets such as medium and high resolution, inferred and not inferred CPs from
high resolution imagery, and collected from imagery taken before and after 2008.
The results of these accuracy assessments are presented in the next section.
Bol. Ciênc. Geod., sec. Artigos, Curitiba, v. 19, no 4, p.588-601, out-dez, 2013.P
Paredes-Hernánd
dez, C. U. et al. 595
3 RESULTS
3. S
During thet collection of CPs from GE, large geeoregistration errors (Figuree 4)
w identifieed in GE’s imaagery. Georeggistration errorrs are easily id
were dentified visually
f
from disjoint linear featurees such as roadds and parcel boundaries (P POTERE, 20008).
U
Unfortunately y, these errorss are inheritedd by all locations captured by misregisteered
i
images and, moreover, whenw new im magery is addded, the locaation of featuures
e
extracted fromm misregistereed images “w will be offset by
b any positioonal differencee in
t new registtration” (GOO
the ODCHILD et al., 2012, p. 11089).
1 Conseequently, in arreas
n
nearby, the scientific utility of GE’s im magery archiive is limited
d by these errrors
(
(POTERE, 20008) and coorddinates extraccted from these areas shouldd only be usedd as
a
approximation ns and not as ground
g truth.
Figure 4 – Geeoregistrationn error in Googgle Earth’s im
magery. All loccations extractted
ffrom this areaa inherit the errror introducedd by misregisttration. The ceenter coordinaates
of the figgure are 22.5443894° N, 98.181197° W.
© 20013 Google. © 2013 DigitaalGlobe.
Nevertheeless, the resuults of the horiizontal accuraacy assessmennt of the entiree set
oof CPs and of relevant subsets (Tabbles 1 and 2) 2 show thatt the impactt of
g
georegistratio n errors is reeduced in the overall statisstics by the presence
p of otther
a
accurate locattions. If the accuracy
a is evvaluated usinng all CPs, reegardless of thheir
c
collection method and dataa provider, GE’s imagery horizontal
h positional accurracy
o
over rural areeas is 5.0 m RMSE
R r (Equatiion 3), with mean
m horizonttal error of 4.1 m
a standard deviation
and d (SD
D) of 2.9 m (T Table 1). Therrefore, the horrizontal accurracy
o GE’s imaggery over these areas at thhe 95% confiidence level (CE95)
of ( is 8.66 m
(
(Equation 4). A horizontal accuracy thatt surpasses thee accuracy staated by GE’s data d
Bol. Ciiênc. Geod., sec. Artigos, Curitibaa, v. 19, no 4, p.58
88-601, out-dez, 2013.
2596 Horizontal positional accuracy of Google Earth’s imagery...
providers (CNES, 2013; DIGITAL GLOBE; 2013). Since Google is reluctant to
document the accuracy of their geographic products, it can only be assumed that this
is the result of the Ground Truth program of Google (2012). Unfortunately, even
when the overall horizontal accuracy is better than expected, large horizontal errors
of up to 20.9 m exist in the full dataset of CPs (Table 2).
However, it should be noted that larger horizontal errors are observed in CPs
collected over areas where only medium resolution (SPOT) imagery is available in
GE (Table 2); possibly due to a less accurate location of CPs on coarser resolutions.
Therefore, accuracy assessments were undertaken separately for subsets of CPs
collected over areas of medium (SPOT) and high (DG) resolution imagery. Using
52 CPs collected from SPOT imagery, GE’s imagery horizontal accuracy over rural
areas of medium resolution was calculated in 7.6 m RMSEr (mean: 6.4 m; SD: 4.0
m) and 12.8 m CE95. The distribution of the error vectors of these 52 CPs (Figure
5a), shows that the x-component of horizontal errors is significantly larger than the
y-component in GE’s imagery over these areas of medium resolution (RMSEx: 6.4;
RMSEy: 4.0; Table1); and indicates a horizontal offset towards east in GE’s medium
resolution imagery possibly caused by the presence of uncorrected imagery acquired
using large off-nadir angles. Yet, even when larger errors occur over these areas and
systematic errors are present, the horizontal positional accuracy of GE’s medium
resolution imagery is better than that specified by the data provider when no GCPs
are used to georeference its imagery (CNES, 2013).
Over areas of high resolution in GE, the results show that the horizontal
accuracy estimated using inferred CPs (DG Inf) is slightly lower than the accuracy
estimated using only well-defined CPs (DG Vis) (Tables 1 and 2). However, since
the difference is not statistically significant at the 1% level of significance (t-test),
inferred CPs can be considered as valid as well-defined CPs in this study. Therefore,
GE’s imagery horizontal accuracy over areas of high resolution was assessed using
all CPs collected over areas of high resolution, regardless of their collection method.
Using 414 CPs (DG) collected over rural areas, the positional horizontal accuracy of
GE’s high resolution imagery was estimated in 4.5 m RMSEr (mean: 3.8 m; SD: 2.5
m) and 7.8 m CE 95 (Table 1) with horizontal errors of up to 16.5 m (Table 2). The
distribution of error vectors over these areas (Figure 5b) shows that error vector
orientations are randomly distributed. Likewise, the difference between RMSEx and
RMSEy (Table 1) is not significant. Therefore, systematic errors are not apparent in
GE’s high resolution imagery available in rural areas.
In order to verify the inferred effects of Google’s “Ground Truth” program
(GOOGLE, 2012) on the horizontal positional accuracy of GE’s imagery, separate
accuracy assessments were undertaken for CPs extracted from GE’s imagery
collected before (DG < 2008) and from 2008 onwards (DG >= 2008).
Unfortunately, since imagery date is only available for high resolution areas in GE,
this accuracy assessment was undertaken using only CPs collected from high
resolution imagery. The horizontal positional accuracy of GE’s pre-2008 rural
imagery was estimated in 6.3 m RMSEr (mean: 5.7 m; SD: 2.7 m) and 10.9 m CE95
Bol. Ciênc. Geod., sec. Artigos, Curitiba, v. 19, no 4, p.588-601, out-dez, 2013.Paredes-Hernández, C. U. et al. 597
using 60 CPs extracted from imagery collected before 2008 (Table 1). Meanwhile,
the horizontal positional accuracy for GE’s high resolution rural imagery collected
from 2008 onwards was estimated in 4.2 m RMSEr (mean: 3.4 m; SD: 2.3 m) and
7.2 m CE95 using 354 CPs (Table 1). Regarding the presence of systematic errors,
the distribution of error vectors for theses subsets (Figures 5c and 5d) suggest that
while in imagery collected from 2008 onwards error vectors are randomly
distributed, in imagery collected before 2008 a horizontal offset towards northwest
may be present. Therefore, since the horizontal accuracy of pre-2008 imagery in GE
is significantly lower than that of imagery collected during and after 2008 (tested at
the 1% level of significance using t-test) and larger horizontal errors occur in pre-
2008 imagery (Table 2), the results suggest that, possibly as a result of the “Ground
Truth” program, imagery added after 2008 to GE has a better horizontal positional
accuracy than imagery added before 2008.
Regarding the use of GE’s imagery as a source of information for science and
other projects, the results suggest that the overall horizontal accuracy of GE’s
imagery over rural areas fulfills the 5.0 m RMSEr requirement of the ASPRS (1990)
for the production of “Class 1” 1:20,000 maps. However, this requirement is only
met if a large number of points are collected from features that can be clearly
identified visually in high resolution imagery. If data for a project are extracted from
both GE’s medium and high resolution imagery, a larger number of well-defined
points should be extracted from GE’s high resolution imagery in order to reduce the
effect of inaccuracies introduced by data extracted from medium resolution areas on
accuracy statistics. Unfortunately, if only medium resolution imagery is available in
GE for a rural area of interest, the results suggest that the horizontal accuracy
requirement for “Class 1” 1:20,000 maps is not met. However, the accuracy of GE’s
medium resolution over these areas meets the ASPRS (1990) requirement for “Class
2” 1:20,000 maps (maximum RMSEr of 10 m).
Table 1 – Horizontal positional accuracy of GE’s imagery. SD = Standard deviation.
Units: meters.
Subset CPs RMSEr Mean SD RMSEx RMSEy CE95
GE 466 5.0 4.1 2.9 3.8 3.2 8.6
SPOT 52 7.6 6.4 4.0 6.4 4.0 12.8
DG 414 4.5 3.8 2.5 3.3 3.1 7.8
DG Inf 198 4.6 3.9 2.6 3.3 3.3 8.0
DG Vis 216 4.4 3.7 2.5 3.4 2.9 7.7
DG < 2008 60 6.3 5.7 2.7 4.2 4.8 10.9
DG >= 2008 354 4.2 3.4 2.3 3.2 2.7 7.2
Bol. Ciênc. Geod., sec. Artigos, Curitiba, v. 19, no 4, p.588-601, out-dez, 2013.598 Horizontal positional accuracy of Google Earth’s imagery...
Table 2 – Minimum and maximum horizontal error and x and y error components in
GE’s imagery. Units: meters.
Subset CPs Minr Maxr Minx Maxx Miny Maxy
GE 466 0.1 20.9 -16.4 19.8 -12.5 10.5
SPOT 52 0.2 20.9 -7.2 19.8 -12.5 6.8
DG 414 0.1 16.5 -16.4 11.3 -10.4 10.5
DG Inf 198 0.1 12.5 -9.5 11.3 -8.4 9.2
DG Vis 216 0.2 16.5 -16.4 10.8 -10.4 10.5
DG < 2008 60 0.2 16.5 -16.4 8.0 -7.2 10.5
DG >= 2008 354 0.1 13.4 -9.5 11.3 -10.4 9.2
4. CONCLUSIONS
A series of independent horizontal accuracy assessments have been undertaken
at both global and regional scales. At the global scale, accuracy assessments have
been undertaken using as reference datasets of low (POTERE, 2008) or
undocumented (BECEK; IBRAHIM, 2011) horizontal accuracy. Consequently, the
results of these accuracy assessments should be interpreted with some caution. At
regional scales, high accuracy field measurements (BENKER, LANGFORD;
PAVLIS, 2011) or large scale maps (YOUSEFZADEH, MOJARADI, 2012) have
been used as reference to assess the horizontal accuracy of GE’s imagery . The
results of these studies suggest that the horizontal positional accuracy of GE’s
imagery is better than that estimated in studies at the global scale, possibly due to
the use of more accurate reference datasets.
The results presented in this paper are consistent with this latter finding. Using
accurate field and photogrammetric measurements (extracted from a cadastral
database) as the reference dataset and comparing them against well-defined and
inferred locations (CPs) in GE’s medium and high resolution imagery, the estimated
horizontal positional accuracy of GE’s imagery over rural areas (5.0 m RMSEr) was
found to meet the horizontal accuracy requirements of the ASPRS (1990) for the
production of “Class 1” 1:20,000 maps. However, the results also suggest that this
accuracy requirement might not be met for rural areas if coordinates are extracted
only from GE’s medium resolution imagery or from imagery collected before 2008.
Furthermore, despite the results presented here, GE’s imagery should be used with
caution due to the presence of large georegistration errors in both GE’s medium and
high resolution imagery.
Bol. Ciênc. Geod., sec. Artigos, Curitiba, v. 19, no 4, p.588-601, out-dez, 2013.Paredes-Hernández, C. U. et al. 599
Figure 5 – GE’s imagery horizontal error vectors for (a) 52 SPOT, (b) 414 DG,
(c) 60 DG pre 2008 and (d) 354 DG post 2008 check points.
Units: meters. North: 0°.
ACKNOWLEDGEMENTS
The authors would like to thank Nora E. Macias-Pérez from INEGI for her
orientation on the geographic information products freely available at INEGI. The
authors are also very thankful to two anonymous reviewers whose comments greatly
enhanced the original manuscript. Any remaining mistakes remain our sole
responsibility.
REFERENCES
ASPRS. AMERICAN SOCIETY FOR PHOTOGRAMMETRY AND REMOTE
SENSING. ASPRS accuracy standards for large-scale maps. Photogrammetric
Engineering & Remote Sensing, 56(7), 1068-1070, 1990.
BECEK, K.; IBRAHIM, K. On the positional accuracy of the Googleearth®
imagery. TS05I - Spatial Information Processing Ipaper no. 4947. In: FIG
Working Week 2011, Marrakech, Morocco, 18-22 May 2011.
Bol. Ciênc. Geod., sec. Artigos, Curitiba, v. 19, no 4, p.588-601, out-dez, 2013.600 Horizontal positional accuracy of Google Earth’s imagery...
BENKER, S.C; LANGFORD, R.P.; PAVLIS, T.L. Positional accuracy of the
Google Earth terrain model derived from stratigraphic unconformities in the
Big Bend region, Texas, USA. Geocarto International, 26(4), 291-301, 2011.
CHA, S.; PARK, C. The utilization of Google Earth images as reference data for the
multitemporal land cover classification with MODIS data of North Korea.
Korean Journal of Remote Sensing, 23(5), 483-491, 2007.
CNES. CENTRE NATIONAL D’ÉTUDES SPATIALES (FRANCE). Un Système
opérationnel et performant. Images. Available at: http://spot5.cnes.fr/systeme
/systeme.htm. Accessed: 22 March 2013.
DIGITAL GLOBE. Basic Imagery Data Sheet. Available at: http://www.
digitalglobe.com/downloads/BasicImagery-DS-BASIC-Web.pdf. Accessed: 20
March 2013.
DUHL, T.R.; GUENTHER, A.; HELMIG, D. Estimating urban vegetation cover
fraction using Google Earth® images. Journal of Land Use Science, 7(3), 311-
329, 2012.
FGDC. FEDERAL GEOGRAPHIC DATA COMMITTEE (USA). Geospatial
Positioning Accuracy Standards. Part 3: National Standard for Spatial Data
Accuracy. Reston, Virginia, USA, 1998.
FLANAGIN, A.J; METZGER, M.J. The credibility of volunteered geographic
information. GeoJournal, 72, 137-148, 2008.
GOODCHILD, M.F.; GUO, H.;ANNONI, A.; BIAN, L.; DE BIE, K.;
CAMPBELL, F.; CRAGLIA, M.; EHLERSG, M.; VAN GENDEREN, J.;
JACKSON, D.; LEWIS, A.J.; PESARESI, M.; REMETEY-FÜLÖPP, G;
SIMPSON, R.; SKIDMORE, A.; WANG, C.; WOODGATE, P. Next-
generation Digital Earth. Proceedings of the National Academy of Sciences of
the United States of America, 109 (28), 11088–11094, 2012.
GOOGLE. Source for elevation data. Google Product Forums. 2008. Available at:
https://groups.google.com/forum/?fromgroups=#!topic/earth-
data/KsRTsXULRNk. Accessed: 20 March 2013.
______. Accuracy of Google Earth data satellites. Google Product Forums. 2009.
Available at: http://productforums.google.com/forum/#!category-topic/maps/
maps-water-cooler-off-topic-forum/2qQF6eteanQ. Accessed: 20 March 2013.
______. Google Earth downloaded more than one billion times. Google Official
Blog, 2011. Available at: http://googleblog.blogspot.mx/2011/10/google-earth-
downloaded-more-than-one.html. Accessed: 18 March 2013.
______. Building a better map of Europe. Google Official Blog, 2012. Available at:
http://googleblog.blogspot.com/2012/12/building-better-map-of-europe.html.
Accessed: 26 March 2013.
______. Imagery sources. Google Earth Policies, 2013a. Available at:
http://support.google.com/earth/bin/answer.py?hl=en&answer=21413.
Accessed: 20 March 2013.
Bol. Ciênc. Geod., sec. Artigos, Curitiba, v. 19, no 4, p.588-601, out-dez, 2013.Paredes-Hernández, C. U. et al. 601
______. Google Earth Projection. Google Earth Help. 2013b. Available at:
https://support.google.com/earth/answer/148110?hl=en. Accessed: 18 July
2013.
INEGI. INSTITUTO NACIONAL DE ESTADÍSTICA Y GEOGRAFÍA
(MÉXICO). Catastro de la Propiedad Social. 2013. Available at:
http://www.inegi.org.mx/geo/contenidos/catastro/presentacionpropiedadsocial.
aspx. Accessed: 22 March 2013.
NOWAK, D.J.; GREENFIELD, E.J. Evaluating the national land cover database
tree canopy and impervious cover estimates across the conterminous United
States: A comparison with photo-interpreted estimates. Environmental
Management, 46, 378-390, 2010.
PERISSIN, D.; WANG, Z.; LIN, H. Shanghai subway tunnels and highways
monitoring through Cosmo-SkyMed Persistent Scatterers. ISPRS Journal of
Photogrammetry and Remote Sensing, 73, 58-67, 2012.
POTERE, D. Horizontal positional accuracy of Google Earth’s high-resolution
imagery archive. Sensors, 8, 7973-7981, 2008.
PERUCCACCI, S.; BRUNETTI, M.T.; LUCIANI, S.; VENNARI, C.; GUZZETTI,
F. Lithological and seasonal control on rainfall thresholds for the possible
initiation of landslides in central Italy. Geomorphology, 139-140, 79-90, 2012.
RAN. REGISTRO AGRARIO NACIONAL. Normas técnicas para la delimitación
de las tierras al interior del ejido. Diario Oficial de la Federación, México.
1995.
SALINAS-CASTILLO, W.E.; PAREDES-HERNANDEZ, C.U. Horizontal and
vertical accuracy of Google Earth®: Comment on “Positional accuracy of the
Google Earth terrain model derived from stratigraphic unconformities in the
Big Bend region, Texas, USA” by S.C. Benker, R.P. Langford and T.L. Pavlis.
Geocarto International, In Press. DOI:10.1080/10106049.2013.821176
TUCKER, C.J.; GRANT, D.M.; DYKSTRA, J.D. NASA’s Global Orthorectified
Landsat Data Set. Photogrammetric Engineering & Remote Sensing, 70(3),
313-322, 2004.
WHEATON, J.M.; GARRARD, C.; WHITEHEAD, K.; VOLK, C.J. A simple,
interactive GIS tool for transforming assumed total station surveys to real
world coordinates – the CHaMP transformation tool. Computers &
Geosciences, 42, 28-36, 2012.
YOUSEFZADEH, M.; MOJARADI, B. Combined rigorous-generic direct
orthorectification procedure for IRS-p6 sensors. ISPRS Journal of
Photogrammetry and Remote Sensing, 74, 122-132, 2012.
YU, L.; GONG, P. Google Earth as a virtual globe tool for Earth science
applications at the global scale: progress and perspectives. International
Journal of Remote Sensing, 33(12), 3966-3986, 2012.
(Recebido em abril de 2013. Aceito em setembro de 2013).
Bol. Ciênc. Geod., sec. Artigos, Curitiba, v. 19, no 4, p.588-601, out-dez, 2013.You can also read