Accelerating global actions for a world without poverty: Egypt Experiences
←
→
Page content transcription
If your browser does not render page correctly, please read the page content below
Accelerating global actions for a world without poverty:
                                             Egypt Experiences

                                                          By
                                               Dina M. Armanious
                      Professor of Statistics, Faculty of Economics and Political Science,
                                              Cairo University, Egypt
                                             Darmanious@feps.edu.eg
Abstract:
After years of slow growth after Egyptian revolution in 2011, the Egyptian economy has started to
recover in 2014/2015 and growth rates have exceeded 5% since the year 2017/2018. However, results
of Egyptian Household income, Expenditure and consumption survey (HIECS, 2017/20181) showed
continued increase in poverty rates that jumped from 27.5% in 2015 to 32.5% in 2018. Thus the objective
of this paper is to explain the increase in poverty rates in light of increase in Growth rates and declining
unemployment rates. Additionally, to present the policies to be followed in order to ensure poverty rates
decline in response to the continuous efforts in Egypt.
Results of the study show that 32.5% of people in Egypt are poor in 2018 (32 million people) and there
is a steady increase in Income Poverty Rates from 1999 to 2018. Higher Increase in Prices led to mask
any increase in income between the end of 2015 and mid-2018, which results a decline in the real income
and increase in poverty. Additionally, rapid growth of informal sector (Working outside establishment,
Temporary Jobs and employed with no Employment Contract) and low coverage of Social Insurance
help in increasing Poverty.
On the other hand, Cash transfer directed to poor people, food and energy subsidies, in addition to other
programs launched by the government to provide better housing and health services have great positive
impact on poverty.
Accordingly, Growth is a necessary condition for poverty reduction in Egypt, but it is not sufficient,
Inclusive growth is the most effective. Creation of enough decent jobs that generate incomes that reduce
poverty is required. Financial sustainability of the social protection system is needed, and improve public
services (especially education and health), and housing conditions are also necessary. The role of
government, the private sector, civil society, and the poor themselves must be integrated to achieve the
desired poverty impact. Finally, formulating a national strategy for social protection that integrates with
Egypt's Vision 2030 is required.

1
    The author refer to HIECS 2017/2018 in the paper by HIECS 2018
                                                           1
I-       Introduction
Egypt is the most populous country in North Africa and the Arab world with a population of 99 million
in 2019. Despite being classified as a middle-income country, Egypt faces a set of long-standing
development challenges.
Egypt witnessed a series of successive shocks since January 2011. The first phase of the transition period
2011-2013, was marked by volatile economic circumstances associated with increasing levels of
uncertainty, a drop in private investments, and a deterioration in economic growth (GDP growth
averaged 2%) that was not sufficiently ameliorated by social protection measures to shield the poorest
and most vulnerable from further socioeconomic challenges during that period. While there are multiple
reasons for the economic slowdown and increasing vulnerability to poverty and food insecurity during
this phase, political instability, protest movements and the gap in expectations between the government
and the rest of the society were factors that clearly contributed to this slowdown.
The Government of Egypt (GoE) is fully aware of the critical need to address the root causes of poverty,
food insecurity and social injustice in Egypt. The Strategic Development Strategy “SDS 2030” that was
launched in 2015 is aligned with the global SDG agenda and focuses not only on rapid economic growth
but also on improving social justice. The national investment plan has therefore increased its focus on
investment in social services like education, health, water and sanitation.
This paper attempts to provide a brief of poverty and food security status in Egypt, to guide the Country
Strategic Review and ensure that the GoE and other stakeholders- is addressing the priority needs of the
most vulnerable population and that it’s effectively contributing to decrease poverty in Egypt.

   II-      Data
The analysis below relies mainly on data from the nationally representative Household Income,
Expenditure and Consumption Survey that ended in September 2018 (HIECS 2018), carried out by the
Central Agency for Public Mobilization and Statistics (CAPMAS). HIECS 2015 is also used to do some
trends in the analysis. The ‘money metric’ measure of poverty is used, where households are considered
poor if they cannot afford to consume minimum acceptable basic needs (Poverty line). Extreme poor
households are defined as those who cannot satisfy their basic needs of food.
   III-     Results:
3.1-     Current Situation of Income Poverty in Egypt
Figure 1: Steady Increase in Income Poverty Rates from 1999-2018
                                                           Income poverty increased from 27.8% in
35                                                  32.5   2015, up to 32.5% at 2018, leaving 32
30                                            27.8         million people below the national income
                               25.2    26.3
25                     21.6                                poverty  line. Figure (1) tracks the steady
               19.6
20    16.7                                                 increase in the poverty rate between 1999
15
                                                           and 2018. Additionally, extreme poverty is
                                                           estimated to have reached 6.2% by 2018,
10
                                                           indicating that about 6 million of the
 5
                                                           population cannot satisfy their basic needs
 0                                                         of food and thus they suffer from food
    1999/2000 2004/05 2008/09 2010/11 2012/13 2015 2017/18
                                                           insecurity.
                                                    2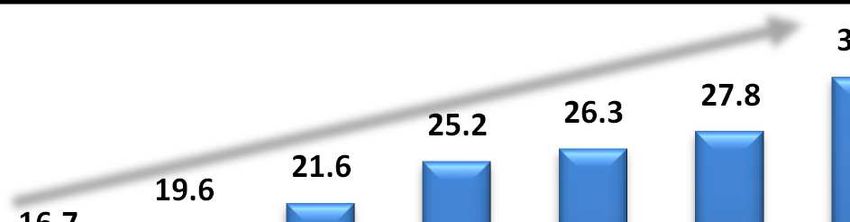
Trends of Poverty by Regions
Poverty rates are generally higher in Egypt’s rural areas in all years. Between 2015 and 2018, poverty
in urban areas increases significantly (from 16.9% to 24.6%), while small increase of poverty was
experienced by residents in rural areas. Accordingly, because of the large increase in the percentage of
poor in urban areas, for the first time, the gap between rural and urban standard of living has decreased.
Table 1: Poverty Rates in 2015-2018 and change in Change in poverty between 2015 and 2018 is
percentage points shown in Table (1). The table shows that the
percentage of poor increased in all regions,
Regions 2015 2018/2017 Change except for rural Upper Egypt.
Total Egypt .278 32.5 4.7 For the first time, the rural area of Upper
Egypt witnessed a decrease in poverty
Metropolitan 15.1 26.7 11.6
indicators, and the difference was 4.8
Urban Lower .97 14.3 4.6 percentage points. Although poverty decrease
in rural Upper Egypt, it is still has the highest
Rural Lower 19.7 27.3 7.6 percentage of poor in both 2015 and 2018.
Urban Upper 27.4 30.0 2.6 Rural Upper Egypt accounts for only 25% of
the population, however, it is home for 40%
Rural Upper 56.7 51.9 -4.8 of the whole poor population in Egypt (12.6
million people), which makes it a priority
region for Government of Egypt (GoE) assistance programmes.
Poverty gap is the average difference between consumption of poor and poverty line relative to poverty
line. Poverty gap increased between 2015 and 2018, which means consumption of the poor moved
further from the poverty line and becomes deeper.
Poverty Map for better targeting
Poverty Map is essential for selecting and designing interventions and better targeting mechanisms.
Aggregated level of poverty on region or governorate level mask sub-governorate variation of poverty
because poverty-reduction interventions face challenges of spatial heterogeneity of poverty in Egypt.
Drawing Poverty Maps becomes an essential component to design efficient programs to eradicate
poverty. Accordingly, Poverty Map is essential to highlighting geographic variations, understanding
poverty determinants, selecting and designing interventions, better targeting mechanisms and monitoring
progress.
3.2 How to explain increase in poverty rates in light of the increase in Growth rate and declining
unemployment rates?
3.2.1 Negative Impacts
In the Financial Year (FY) 2019 (ending June 30th, 2019), Egypt experienced high GDP growth reached
5.6 percent, up from 5.3 percent in FY18. Data for the first nine months of FY19 show that this pickup
is driven by net exports and private investment.
The Government of Egypt (GoE) successfully implemented a first wave of macro-economic and
structural reforms that successfully addressed a number of deep-seated issues and helped to stabilize the
3economy, sustain growth and lay the groundwork for more dynamic private sector participation in the
economy. On the sectoral side, gas extractives, tourism, wholesale and retail trade, real estate and
construction have been the main drivers of growth. Unemployment decreased to 7.5 percent in the fourth
quarter of FY19 (from 9.9 percent a year earlier), although accompanied by shrinking labor force
participation.
Although all these successful structural reform and high growth rate, poverty increased in 2018 to reach
32.5%. There are many conditions affects negatively on the living standards of the poor.
Decline in Real Income and Consumption
Higher increase in prices decreases real income of households. Higher Increase in Prices led to mask
any increase in income between the end of 2015 and mid-2018. Figure 2 shows that the increase in annual
income of households between 2015 and 2018 reached 33%, while in the same time prices increased by
59%. The higher increase in prices affects negatively on the real income of households that makes it
decline and damaged the living standards of the poor. Similar results are observed for urban and rural
areas, where increase in prices are higher than the increase in incomes in all regions that result on
declining the real incomes.
Figure 2: Change in CPI and average annual income of households (thousands LE), 2015-2018
59% 33%
168 44.2
Total Total
267.7 58.9
61% 36%
171.9 38.3
Rural Rural
277.9 52.1
57% 30%
164.8 51.2
Urban Urban
259 66.8
0 100 200 300 0 20 40 60 80
CPI in 2015 CPI in 2018 Average Annual Income 2015 Average Annual Income 2018
Figure 3: Average Annual Income of households in 2018 (using 2018 and 2015 prices) (by thousands
80
Egyptian pounds)
66.8
58.9
60 52.1 Real income decreased using constant prices of
41.2
40 31.3 35.8 2015. The average annual net income of
household in 2017-2018 was 58.9 thousand
20
Egyptian pounds, however, using prices of 2015,
0 this income decreased to reach only 35.8
Urban Rural Total
thousand pounds as shown in Figure (3). The
Current prices 2018 With Constant prices of 2015
impact of inflation on real income among urban
areas is higher than that in rural areas as shown
in the figure. This confirms the negative impact of higher increase in prices on the living standards of
people.
4Regarding the real consumption, the results show that the real per capita consumption decreased between
2015 and 2018 by 5.1% using 2015 prices. Decreases of real consumption in urban areas greater than in
rural areas. Rural Upper Egypt is the only region that real consumption increased, however, it is still has
the highest percentage of poor (52% are poor in rural Upper Egypt in 2018).
Poor Conditions of Employed People
Changes in employment structure and its productivity can influence both determinants of change in
poverty (growth and distribution components). Growth in employment and its productivity can improve
the growth rate of the economy. Although the unemployment rate decreased from 12.8% in 2015 to 7.5%
in 20182, poverty rate as well as poverty gap increased during the same period. Unemployment rate may
decrease because people stop looking for work and thus they are excluded from the labour force.
The majority of employed people in Egypt are wage worker. Data of HIECS 2015 and 2018 show that
the majority of employed people in Egypt are wage worker, and the percentage of wage workers
increased from 2015 to 2018. Almost 69% of employed people in Egypt in 2018 are wage worker, 13%
are employer and 12% are self-employed. As expected, the incidence of wage worker was higher in
urban areas than in rural areas (76% in urban areas versus 63% in rural areas). The question raised is
why people still poor while they are wage workers?
Most of the poor depends on the only asset they have; labour. Even when a poverty reduction strategy
improves the access of the poor to other resources - e.g., land and capital, physical, financial,
infrastructural and human - the process of poverty reduction does not depend on the creation of an
entitlement to rent or annuity for the poor but on the enhancement of opportunities to be employed more
intensively and productively.
Almost 60% of wage worker are with no employment contract and thus with no social insurance. Data
of HIECS 2018 shows that 55% of wage workers do not have any employment contract in addition to
5% have temporary contract (60% are in informal work). The percentage of unavailability of
employment contract increased from 2015 to 2018 by 3 percentage points.
More than three quarters of poor workers with no employment contract. The relationship between
poverty and informal work (no employment contract) is supported by the fact that the majority of wage
worker poor people work in informal jobs. Almost 77% of poor wage worker work with no employment
contract, compared to only 52% for the non-poor.
Additionally, in rural areas, unpaid labour represented about 10.4% of employed people as opposed to
only 2.5% in urban areas.
Almost 32% of employed people in Egypt are working outside establishment. Additionally, higher rates
of poverty could be a consequence of sector of employment and stability of work of poor people. Data
of HIECS 2018 shows that almost one third of employed people work outside establishment, with 45%
among the poor and only 27% among non-poor workers.
2
Data from Ministry of Finance
5One quarter of employed people work in temporary jobs. Regarding stability of work, the data shows
that at the national level, 26% of employed individuals have temporary jobs, seasonal, or have casual
jobs. Of the poor, this figure reached 38% compared to 21% of non-poor individuals in 2018.
Characteristically, temporary workers are more likely to be poor as they do not benefit of any social
insurance and accordingly they are more likely to face economic shocks with any increase in prices or
any personal factors.
Increase in poverty rate among government workers. Overall, there are only 22% of employed people
are working in the government sector. The comparison between 2015 and 2018 shows that the percentage
of poor among workers in government or public business increased from 13% in 2015 to 19% in 2018.
The increase in poverty rate could be interpreted by that the increase in income is less than the increase
in prices during the same period, and thus, real income decreased and their living standard are also
decreased.
Accordingly, unemployment rate may fall, or stop rising, even though there has been no underlying
improvement in the labour market, while people stop looking for work and thus they are excluded
from the labour force.
Non-Participation in Social Insurance
Participation or benefit from social insurance is the first line of defense for social protection and the
ability to overcome shocks that may result from personal factors such as disability, old age or death.
Thus, participants or beneficiaries of social insurance are less likely to become poor if they face one of
these risks. The problem is that all those who work with no employment contract or outside establishment
do not benefit of Social Insurance and thus do not have any social protection.
Figure 4: Percentage benefitted or participated in Social Insurance, 2018
30
25.7 26
24.9 Overall, Only 21% of population
25
in 2018 benefitted or participated
21.3
in social insurance. Poor people,
20
16.8
17.8 females and those in rural areas
(who deserve social insurance) are
15 13.6
less likely to participate or benefit
from social insurance.
10
The data shows that only 14% of
5 the poor benefitted or participated
in Social Insurance, compared to
0 25% among the non-poor.
Poor Non-Poor Males Females Urban Rural
Moreover, 18% of people in rural
Poverty Status Gender Residence Total
areas benefitted or participated in
social insurance, compared to 26% among population in urban areas.
63.2.2 Positive Impacts
Social Protection through Financial Aids (Cash Transfer)
The Government of Egypt has established a rather comprehensive set of social protection programmes
ranging from cash transfer schemes to subsidies, tax exemptions and social services. Ministry of Social
Solidarity (MOSS) has a core role in Egypt’s social protection framework. It administers several cash
transfers for poor and vulnerable categories of individuals and households.
Like most countries from Middle-East and North Africa (MENA), Egypt operates a variety of subsidies
that help to shield the poor and vulnerable from high and volatile prices of basic commodities, such as
food, housing and fuel. However, energy subsidies have been progressively removed since 2012. In
addition, some substantial tax reductions or exemptions are in place, also with a view to protecting low-
income households.
In 2015 the Government of Egypt (GoE) (supported by World Bank) introduced a national targeted
safety net programme “Takaful & Karama” based on cash transfers for the poorest and most vulnerable
population in Egypt, targeting 2 million households in FY 2018.
These programs cover all the 27 governorates of Egypt. Takaful is a family income support conditional
cash transfer (CT) program aimed at reducing poverty. Takaful is conditioned on being poor and to send
children under 18 years of age to schools. Mothers or female guardians are the designated beneficiaries
of payments (not necessary to be the head of the household). A maximum of three children from each
household are covered as beneficiaries under the program’s conditionality monitoring.
Karama is a CT that supports social inclusion, which is conditioned on being below the poverty line and
meeting one of the two following conditions: Person with Severe disability that prevents a person from
working or being an Elderly (above the age of 65 years).
Figure 5: Percentage of households received Takaful CT, 2018
Overall, Figure 5 shows that 10.5% of
100% 7 2.6 5
90% 14 10.5 population with children in Egypt are
20
80%
70%
benefitting from Takaful cash transfer. Rural
60% Egypt exhibited the largest percentage of
50% 93 97.4 95
40% 86 89.5 beneficiaries, representing 14% of the
80
30%
20%
population living in households with children.
10%
0% Cash transfer benefits are well targeted but
Poor Near Poor Non-Poor Urban Rural
the coverage is too small. Disaggregating by
Poverty Status before receiving Residence Total
cash transfers
poverty status, Figure 5 shows that only 20% of
poor individuals living in households with
Not received Received Takafol
children less than 18 years are receiving
Takaful and 2.6% of non-poor are receiving
Takaful. However, the distribution of beneficiaries by poverty status shows that 73% of beneficiaries are
poor and 18.2% are near poor, thus 8.7% of program benefits leaked to the non-poor. Additionally, 63%
of CT beneficiaries are from rural Upper Egypt, while they represent only 25% of all population.
Although rural Upper Egypt is the poorest region, it is the only region where poverty rates have
decreased, and this explains the impact of CT (as one of the interventions) in this region that supports
7poverty decline. Accordingly, cash transfer benefits are well targeted but the coverage is too small. Thus
extending the coverage of cash transfer programs are required.
Regarding Karama CT, overall, the data shows that only 1.7% of individuals received the Karama cash
transfer. Only 3.5% of poor individuals who are elderly or disabled received Karama and this percentage
reached 1.2% and 0.7% among near poor and non-poor respectively.
Takaful transfers markedly affect the situation of beneficiaries. Looking at the impact of Takaful CT
on Takaful beneficiaries only, data presented in Table (2) shows the great impact of this cash transfer
program on poverty status of those people. About 10% of Takaful beneficiaries moved from being poor
to near poor and 3.7% moved from near poor to non-poor after receiving the Takaful cash transfer. On
the other hand, the percentage of the non-poor increased significantly from 9.7% to 13.4% after
benefitting from Takaful transfer.
Table 2. Distribution of individuals receiving Takaful according to Poverty Status before and after
receiving Takaful
Poverty after receiving Poverty without Takaful Total
Takaful Poor Near Poor Non-Poor
Poor 62.2 62.2
Near Poor 9.6 14.9 24.5
Non-Poor 3.7 9.7 13.4
Total 71.8 18.6 9.7 100.0
Targeting and Poverty Impact of Egypt’s subsidies
Social safety nets (SSN) are a crucial component of a well-functioning economy. SSN are non-
contributory transfer programs seeking to prevent the poor or those vulnerable to shocks and poverty
from falling below a certain poverty level (Grosh et. Al. 2008). They play an important role in sustaining
social cohesion and promoting a more equitable development in all modern day welfare states. Egypt
spends large amounts on untargeted subsidy programs, with little resources allocated for a number of
other fragmented SSN programs. Effectiveness of these programs in managing household risks and
reducing poverty has proved to be limited. In Egypt, the public safety net comprises basically in-kind
subsidies (energy and food).
Subsidies Programs have impact on declining Poverty Rates. Data of HIECS 2018 shows that the
coverage of food subsidy reached 88.5% of households, with 80.2% among households in urban areas
and 95.5% among households in rural areas.
Assuming zero food subsidy effect, i.e.; 100% removal of food subsidy system is likely to have a direct
impact on income poverty and hence on food insecurity. Income poverty is expected to rise under this
scenario by 5.4 percentage points, up to 37.9% of the population. Similar results are observed regarding
the LPG and electricity subsidies as shown in Figure (6). Accordingly, Subsidies Programs are well
targeted in Egypt and have impact on Poverty Rates.
8Figure 6: Percentage of poor people without receiving the subsidies and with receiving all
subsidies, 2018
5.4
percentage 5.2
points percentage 4.7 percentage
points points
40 37.9 37.7 37.2
35 32.5 32.5 32.5
30
25
20
15
10
5
0
Food Subsidy LPG Subsidy Electricity Subsidy
Without Subsidy With all Subsidies
Programs launched by the government helped in reducing poverty
A large number of programs were launched by the government:
1- Decent housing: Provide adequate housing for citizens and their children, “Decent Housing”
project aims to rehabilitate 22,000 homes for the most vulnerable families who benefit from
Takaful, Karama or Social Security pension program.
2- Social housing: The project aims to implement 725 thousand housing units during 6 years in
all governorates and new cities, and it targets poor households.
3- The initiative "A Good Life": is Launched by President Abdel Fattah El-Sisi on January 2,
2019. It aims to help the most needy groups in Egypt. The initiative began with the selection of
277 villages with a poverty rate of more than 70%.
4- Launching 8 presidential initiatives to provide better health services.
3.3 Food Security in Egypt
Adequacy of Food Consumption & Coping Strategies
As part of the 2018 HIECS questionnaire, households were asked about the adequacy of food
consumption during the last 30 days. In response, 24.6% percent of households reported that they could
barely meet their basic food needs, and 4.7 percent reported insufficient access to food, with no
difference between 2015 and 2018. Among poor population: 41% reporting that they do not consume
adequate food, compared to 25.6% among non-poor
Households adopted various consumption and stress strategies to cope with inadequate food. The coping
strategies adopted by households can be grouped into 4 main categories: consumption strategies (such
as eating cheaper foods and reducing number of meals), stress strategies (such as borrowing food or
9borrowing money to buy food), crises strategies (such as reducing expenditure on health and education
and sending children to work) and emergency strategies (Begging, such as rely on assistance from family
and friends and Seek for donations).
Overall, 40% of households reported that they could barely meet their basic food needs or reported
insufficient access to food relied on consumption strategies (eating cheaper foods), 31% adopted
emergency strategies (Begging or seek for donation) and 13% depends on crisis strategies (reducing
expenditure on health and education or sending children to work) Poor households and those in rural
areas depend more on emergency and crises strategies (begging, reduced spending on health and
education and taking children out of schools and sending them to work).
Quantity and Quality of Consumed Food
Food Security in Egypt measured by two ways; Quantity of consumed food measured by deficiency
in caloric intake (consumed calories are less than required calories) and Quality of consumed food
measured by Dietary Diversity. Deficiency in micronutrients and vitamins that arises from poor dietary
diversity can compromise energy levels, growth and eventually the ability to survive. Dietary Diversity
means that the household consumed different types of food (by different weights); Cereals, Root and
tubers, Pulses, Vegetables, Fruit, Meat and fish, Milk, Sugar and Oil.
Regarding deficiency in caloric intake, results of HIECS 2018 show that 17% of the population suffer
caloric deficiency. Poor people are more likely to suffer caloric deficiency than non-poor (33% and 9%
respectively). Similar result is observed among people in rural areas, where 21% of the population in
rural areas suffer caloric deficiency compared to only 12% among those in urban areas. As expected,
prevalence of caloric deficiency increased with household size and with illiterate heads or less educated
heads.
Concerning dietary diversity, the data shows that 21.4% of people suffer poor food diversification (poor
Quality of food). Marked difference is observed between Poor and non-poor people in dietary diversity,
where 36% of poor people consumed poor food diets compared to only 14% among non-poor people.
3.4 Social Risks in Egypt and Policy Recommendations from findings
Risks on Macro level from findings
1. Decline in Real Consumption
2. High cost of living and decrease in real income
3. Unclear Policies of increasing employment opportunities
4. Decline in Public Expenditure on Health and education
Risks from Individuals point of view
1. Decline of quality of health and education services
2. Decline of Decent employment opportunities
3. Temporary Income
4. Increase in Dependency Ratio
5. Decline of enrollment rate and increase child labour, thus transition of poverty among generations
10 Policy Recommendations
1. Growth is a necessary condition for poverty reduction in Egypt, but it is not sufficient. Inclusive
growth is the most effective. Inclusive growth allows creation of enough decent jobs that generate
incomes that reduce poverty and generate enough public resources for social protection
financing needs. Accordingly, GoE should focus on sectors in achieving sustainable inclusive
growth, which are:
Transformative Industries
Agriculture
Wholesale and retail trade
Tourism
Communications, technology and information
Construction and real estate activities
2. Financial sustainability of the social protection system is required: fill the gaps of SP system,
starting with the children, elderly and disabled.
3. Enhancing the capabilities of poor to enter the labor market
4. Social assistance programs should be developed such as cash transfers, school meals and
improvement of livelihood of people in rural areas ...etc. to protect the poor from wrong practices
such as borrowing, selling assets and child labor.
5. Extending the coverage of Cash Transfer programs are required.
6. Family planning is a necessary and sufficient condition for reducing poverty.
7. The role of government, the private sector, civil society, and the poor themselves must be integrated
to achieve the desired Poverty impact, however this Integration requires the design of economic and
social policies that have sufficient support to implement them.
8. Financial sustainability of basic public services, in addition to improve the public services
(especially education, health and housing conditions).
These recommendations required formulating a national strategy for social protection that
integrates with Egypt's Vision 2030.
References
1. Foster, J., Greer, J., Thorbecke, E.1984: A class of decomposable poverty measures.
Econometrica 52, 761–776.
2. Glewwe, p. and John Gibson:” Chapter Viii. Analysis of Poverty Dynamics”,
https://unstats.un.org/unsd/methods/poverty/pdf/Chapter-8.pdf, accessed Feb 2017.
3. Haughton, J and Shahid Khandker, 2009:’Poverty and Inequality Handbook,” Chapter 11,
World Bank.
4. Heise, David. 1969. .Separating Reliability and Stability in Test-Retest Correlation.
5. American Sociological Review 34(1):93-101.
6. Marotta, D, Ruslan Yemtsov, Heba El-Laithy, Hala Abou-Ali and Sherine Al-Shawarby
(2010),” Was Growth in Egypt Between 2005 and 2008 Pro-Poor” policy Research Working
Paper, # 5589, World Bank.
7. WFP (2013)” The Status of Poverty and Food Security in Egypt: Analysis and Policy
Recommendations ” World Food Program report.
11You can also read