Case Study: Coffee in Dak Lak Province - Thailand Vietnam ...
←
→
Page content transcription
If your browser does not render page correctly, please read the page content below
Case Study: Coffee in Dak Lak Province
by: Manh Hung Do, MSc., Institute of Environmental Economics and World Trade, Leibniz
Universität Hannover, Germany

Buon Ma Thuot, the capital of Dak Lak Province Vietnam; photo: H. Waibel

Acknowledgements

The contributions of Associate Professor Dr. Niem Le Duc, Tay Nguyen University, Buon Ma Thuot
City, Vietnam, are much appreciated. Thanks are also extended to Mark Brooks for English language
editing and Florian Heinrichs for formatting the document.
I.    Background
The province of Dak Lak is the most southern of the three provinces in Vietnam of the Thailand
Vietanm Socioeconomic Panel (TVSEP) research project. Dal Lak is a landlocked, mostly mountainous
province of about 13,000 square kilometres and a population of some 1.8 million, the majority of
which live in rural areas. The province is located some 300 km north of Ho Chi Minh City and is
bordering Cambodia to the west.

All over Vietnam, Dak Lak is known to be the coffee province of the country, accounting for almost
one third of coffee production in Vietnam (GSO, 2018). It is the home of robusta coffee, of which
Vietnam is the world’s second‐largest exporter. In 2018, Vietnam exported almost 1.9 million tonnes
of coffee with a market value of over 3.5 billion USD. Between 2007 and 2017 the value of coffee
export grew (compound growth rate) by over 5 % annually (MARD, 2019).

In Buon Ma Thout (BMT), the provincial capital, the flavour of coffee is everywhere. Some of the
most authentic coffee brands are Trung Nguyen, Thang Loi and An Thai Coffee. Famous coffee shops
and outlets are the Trung Nguyen Coffee Village, the CE coffee and the Arul coffee. The latter is a
typical Ede1 style house with antique furniture and artworks (see picture below).

Arul Coffee and Ede Cultural House in BMT; photo: Dr. Niem Le Duc

Agriculture in Dak Lak is dominated by coffee, which is the main source of income for around
220,000 coffee households. This equates to about 60 % of all farm households in the province (GSO,
2017). Driven by favourable coffee prices, the cultivated area allocated to coffee increased from
about 179,000 ha in 2007 to almost 204,000 ha in 2017. Figure 1 shows, that the actual area of
coffee cultivation in Dak Lak would be close to 350,000 ha, had the new province of Dak Nong not
been the formed in 2004.

1
     Ede is the major indigenous ethnic group in Dak Lak province with specific cultural heritages such as
     matrilineal traditions and a language of Malayo‐Polynesian origin
                                                         2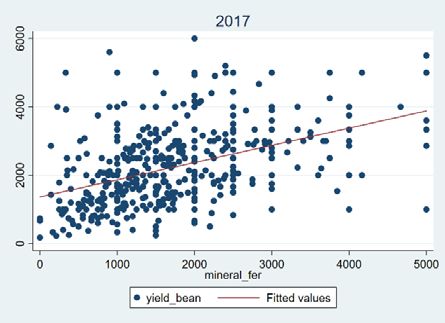
Note: Dak Lak province was split into Dak Lak and Dak Nong province in 2004
   Source: (GSO, 2018)
Figure 1: The expansion of coffee cultivation area in Dak Lak province between 1996 and 2017.

Aside from coffee farming, the processing, trading and sale of coffee is important for the socio‐
economic development of Dak Lak province. In 2017, the coffee industry contributed to over 40% of
the provincial GDP. In addition, 60 % of the provincial government budget was generated by the
coffee industry by means of fees and taxes (Cairns, 2017).

There are reportedly about 500 small‐scale collectors/traders at the district and commune levels, 301
roasters/processors (including 204 roasters, 95 green beans processors, and 2 instant coffee
processors), and 11 exporters (including 3 Foreign Direct Investment enterprises) in Dak Lak province
(DPI, 2018). The coffee value chain has created jobs for about half a million people, comprising of
about 44 % of the total labour force in Dak Lak province (DOLISA, 2017).

In this case study, we demonstrate the use of the unique TVSEP panel data (Hardeweg et al., 2013)
from Dak Lak province TVSEP with several panel waves covering the period of 2007 to 2017. In the
following, we present some interesting features of coffee production by smallholder farmers in Dak
Lak province. Our aim of presenting this simple and mainly descriptive analysis of the Dak Lak data is
to stimulate researchers to develop their own research topics using the TVSEP data. This could be a
single study either on a provincial or country level basis ‐ or a study that combines TVSEP data with
other data sets like climatic data, for example.

In this case study, however, we focus on one province and on one commodity: coffee in Dak Lak!

                                                  3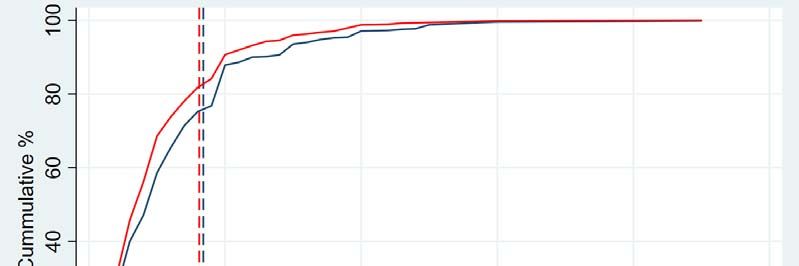
II. Some observations from a decade of TVSEP data collection on coffee production
    in Dak Lak
In the following, we present some simple descriptive statistics of coffee production in Dak Lak, based
on TVSEP data of about 650 rural households. These descriptions include: 1) profitability of coffee
production; 2) the structure of coffee production including coffee replacement strategies; and 3)
environmental problems in connection with coffee farming.

1. Productivity and profitability of coffee
Coffee is not an easy crop to grow. Good management is a prerequisite to producing high quality
coffee and achieving a good harvest. Conventional, non‐organic coffee requires chemical inputs like
pesticides and mineral fertilizer. The latter makes up around 60 % of the cost of production, while
pesticides ranks second with almost 10 %, which is about the same as the labour costs for harvesting.

There are two ways of marketing coffee. One consists of farmers selling freshly harvested coffee
beans and the second method is drying the beans before selling. The latter system is dominant with
almost 90 % of coffee growers following this practice. Beans are usually dried in the sun to 12 – 13 %
moisture so dried beans weigh much less than freshly harvested beans, but of course command a
higher price.

Using some of our panel data, we describe the coffee production system in Dak Lak province (Table
1). We have interview data from over 700 rural households. Between 2007 and 2017 an attrition rate
of some 15 % can be observed. However, the share of coffee producers has remained almost
constant over time at ~60 %. On average, coffee farmers are small‐scale, like most farmers in
Vietnam, and most of their cropland is allocated to coffee. However, the share of coffee as a
percentage of cropland has declined from almost 72 % in 2007 to 60 % in 2017, which indicates that
some diversification into other crops has taken place. Today, Dak Lak is not only famous for coffee
but also for pepper, avocado and durian. For example, the number of households that cultivated
pepper trees in the TVSEP sample increased from 5,7 % in 2007 to 18,6 % in 2017. The average
pepper area per household increased from 0.17 ha in 2007 to 0.33 ha in 2017, corresponding with an
doubling of the share of pepper in agricultural land.

As shown in Figure 1, close to 80 % of the coffee plots per farm are smaller than 1 ha and 40 % are
smaller than half a ha. Only about 5 % of farmers grow more than 2 ha of coffee and this picture has
barely changed between 2007 and 2017. Hence, coffee farming in Dak Lak is really mini‐scale but
whether or not it is also “small and beautiful”, the data below will tell us.

                                                  4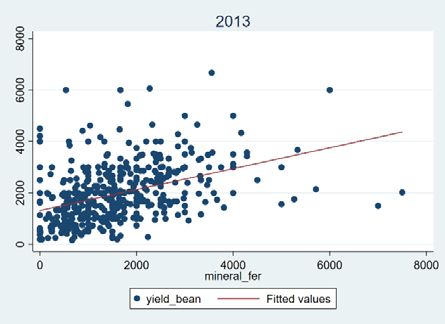
Table 1: General information of coffee production in Dak Lak.

                                                                  2007          2010          2013    2017
Total Interviewed Households (HHs)                                  757           715           703     646
Coffee HHs                                                          470           466           462     409
Share of HHs planting coffee (%)                                   62.1          65.2          65.7    63.3
Size of Coffee Area per HH (ha)                                    0.84          0.90          0.90    0.81
Share of coffee in agricultural land (%)                           72.1          68.9          68.0    59.5
Average yield per ha (kg green beans)                             1,996         2,241         1,984   2,062
Average production cost in USD per ha                               975         1,148         1,533   1,535
Average net income in USD per ha                                  1,273         1,488         1,307   2,402
Average coffee prices
    Fresh cherries (in USD per kg)                                 0.30          0.23          0.31    0.32
    Dried beans (in USD per kg)                                    1.29          1.24          1.80    1.81

      Note: All monetary data are nominal values.
      Source: www.tvsep.de

Productivity of coffee in Dak Lak is higher than in Brazil, the world’s major coffee producer. This is
also what the TVSEP data show, with around 2 tonnes of green beans per ha and with relatively small
variation throughout the years. Generally, yields can be influenced by weather and pests like coffee
berry borers or diseases like coffee rust, in addition to the farmer’s crop management skills and input
use. As shown in Table 1, production costs have increased by almost 40 % between 2007 and 2017.
Since these are nominal figures, the increase in fertilizer prices explains part of the increase but it can
also be related to higher fertilizer use due to rising problems with soil fertility. Furthermore, the data
indicate some gaps in efficiency as input costs bear little relationship with yields.

Net income from coffee can be as high as 2,400 USD but as low as 1,300 USD per ha (Table 1). Much
depends on the price of coffee, which dropped in 2010 but rebounded in 20132. The income data
suggests that most coffee farmers remain poor. For example, a farmer with half a ha of coffee, in the
best case scenario, would just get over 3 USD per day from coffee. For a family of five, this would put
them well below the poverty line, considering that coffee is the major source of income. Hence,
income from other crops like pepper (here net income can be up to 4,500 USD per ha) or non‐farm
income becomes more and more important for coffee farmers in Dak Lak.

2. The ageing of Dak Lak’s coffee trees
One of the problems of coffee farming in Dak Lak is that the trees are getting old. The World Bank, in
one of its reports about Vietnam (2011), has pointed to tree age as a major threat to Vietnam’s
coffee industry. The data collected under the TVSEP project allows an analysis of this problem since
TVSEP is the only survey that includes tree age information in its panel dataset. Both, the Vietnam
Household Living Standards Survey (VHLSS) and the Vietnam Agri‐census do not collect such data.

2
    Coffee prices also dropped in late 2013 (after the survey) but increased again in 2017.
                                                          5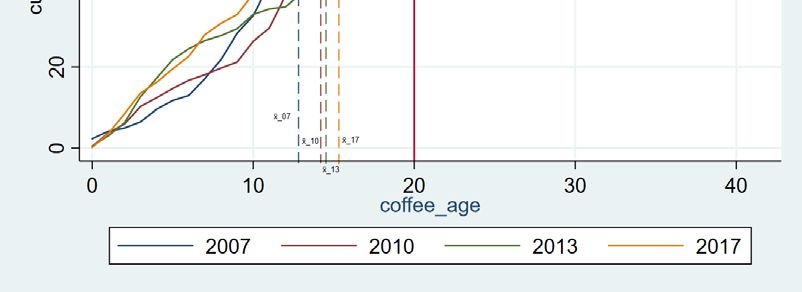
Source: (www.tvsep.de)
Figure 2: Distribution of coffee land size among panel households.
Of course, the optimal replacement of a durable asset is a standard management question. In theory,
the optimal replacement of a perennial crop like coffee is reached when the marginal net revenue of
another year falls below the expected maximum annuity value of a new plantation (or tree). In
practice, this is not always easy to determine due to lack of information and lack of financial
resources. As a rule of thumb, 20 years is considered to be the age when coffee trees should be
replaced (ICO, 2019). The productivity of older coffee trees can only be maintained with higher
fertilizer inputs; else productivity will decline rapidly. The TVSEP data gives record to what extent this
rule is being implemented in Dak Lak province.
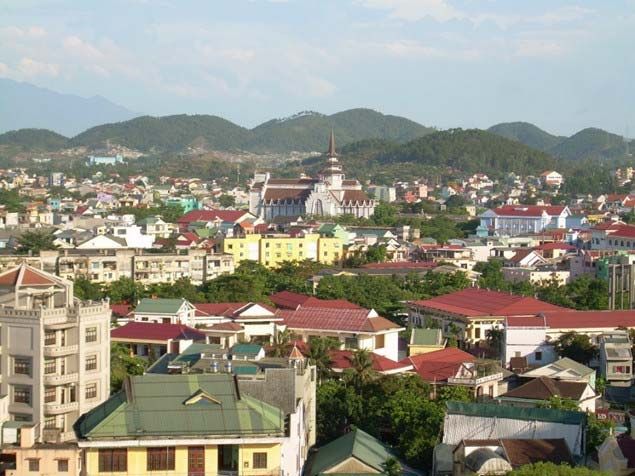
In Figure 3, a cumulative distribution function/curve (CDF) is shown for all the four panel waves. In
2007, only 15 % of coffee trees were older than the threshold value while this increased to almost
40 % by 2017. At the same time, very few of the plantations are in their gestation period, i.e. below
three years of age.
Farmers in Dak Lak have delayed the replacement of coffee plantations and may have missed the
optimal replacement time. This hypothesis is supported by the rising input costs as shown in Table 1.
Currently, replacement of old coffee trees must be carried out under challenging conditions with, for
example, rising labour costs, natural resources degradation, and climate change effects (Havemann
et al., 2015). Hence, a good replacement strategy may include adopting intercropping or switching to
other crops. Cleary, if current trends continue, more than half of Dak Lak’s coffee trees will become
too old. If no replacement or shifting to other more profitable crops will take place, income from
farming may decline and poverty and inequality (Doutriaux et al. 2008) in Dak Lak could increase
again, especially if other shocks like the recent Covid‐19 pandemic occur. Good agricultural extension
services, supported by targeted credit programs, may be needed to sustain the unique coffee
production systems of the province. Certainly, there is also room for conducting interesting research
6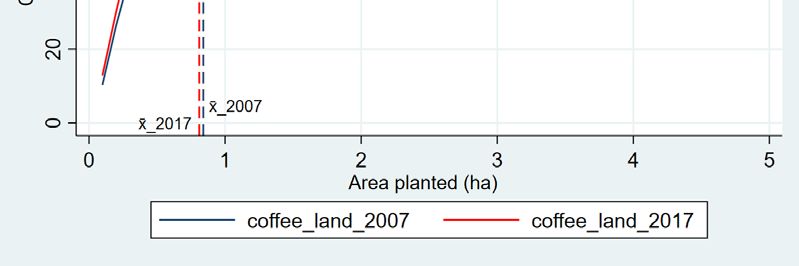
around this theme, by making use of the TVSEP panel data, eventually supplemented by an add‐on
projects or well‐targeted case studies.

   Source: (www.tvsep.de)
Figure 3: Age distribution of coffee plantations in Dak Lak.

3. Coffee and the environment
One of the downsides of the dominance of a single agricultural commodity in a region is that on the
one hand, it can lead to economic dependency, but it also can have negative effects on natural
resources and the environment. The rapid expansion of coffee areas since the mid‐nineties has been
a root cause for deforestation, also resulting in loss of biodiversity. Dak Lak planning authorities have
set a maximum of 180,000 ha for the area planted to coffee in the province (GSO, 2018). By 2017,
however, the coffee area was over 200,000 ha, i.e. more than 10 % over the target. In addition,
chemical‐based crop management practices with heavy doses of mineral fertilizers, which, more
often than not, are far above the recommended rates, have led to a decrease in soil organic matter
and fertility (D’haeze et al., 2005; Byrareddy et al., 2019). Likewise, mis‐ and overuse of chemical
pesticides has led to more pest problems. The rapid expansion of well irrigation has caused the
depletion of ground water resources (Amarasinghe et al., 2015).

In Figure 4, a simple scatterplot of coffee yield versus fertilizer input indicates a “higgledy‐piggledy”
pattern instead of the expected production function shape. This again points to possible efficiency
gaps in farmers’ fertilizer management indicating the need for appropriate extension services and
participatory training (i.e. bringing in farmers’ experience and indigenous knowledge) to achieve
need‐based application of fertilizer, which is in concurrence with the principles of sustainable soil

                                                    7
management. It appears from Figure 4 that the inefficiency even increased in 2017 when compared
to 10 years previously.
Figure 4: Coffee yield versus mineral fertilizer use (kg per ha).
III. The future of Dak Lak coffee
Coffee has been an economically attractive crop for Dak Lak province for a long time, which is why
the province’ economy is “coffee‐driven”. If managed well, the coffee industry will continue to be the
backbone of the economy in Dak Lak. Productivity and profitability of coffee is highly competitive
compared to other production locations in Vietnam and relative to many other crops. However, the
agricultural portfolio is diversifying as a result of domestic and foreign demand for other
commodities. For example, black pepper is growing in importance due to the promotion of
environmentally‐motivated certification schemes (IDH, 2018). Another emerging business is related
to fruit trees such as avocados, which are gaining huge popularity in the international market (GIZ,
2006) and Durian, a fruit known for its strong smell that is very popular among Asian consumers, with
an especially growing market in China. Farmers sometimes start these crops by intercropping them
with coffee. For example, avocado is known to be a good “shade tree” in coffee plantations. The
TVSEP panel has the capacity to capture these changes and thus provide valuable information for
policy making at the provincial level and offering a model to other coffee producing regions.
Finally, as this case study has shown, there are a number of interesting topics that may emerge for
future research using the TVSEP data set. Additionally, the panel can serve as an entry point for
TVSEP add‐on projects with additional data collection activities beyond the TVSEP panel (link: Add‐on
projects).
To conclude, three topics are suggested, which of course are just examples and could easily be
expanded:
1. Coffee or fruit trees: Where is more money?
2. The impact of aeging coffee trees on the coffee industry.
3. The prospects for structural change in Dak Lak farming: How long will small still be beautiful?
8References
Amarasinghe, U. A., Hoanh, C. T., D'haeze, D., & Hung, T. Q. (2015). Toward sustainable coffee
production in Vietnam: More coffee with less water. Agricultural Systems, 136, 96‐105.
https://doi.org/10.1016/j.agsy.2015.02.008
Byrareddy, V., Kouadio, L., Mushtaq, S., & Stone, R. (2019). Sustainable production of Robusta coffee
under a changing climate: a 10‐year monitoring of fertilizer management in coffee farms in
Vietnam and Indonesia. Agronomy, 9(9), 499. https://doi.org/10.3390/agronomy9090499
Cairns, M. (Ed.). (2017). Shifting Cultivation Policies: Balancing Environmental and Social
Sustainability. CABI.
D’haeze, D., Deckers, J., Raes, D., Phong, T. A., & Loi, H. V. (2005). Environmental and socio‐economic
impacts of institutional reforms on the agricultural sector of Vietnam: Land suitability
assessment for Robusta coffee in the Dak Gan region. Agriculture, ecosystems & environment,
105(1‐2), 59‐76. https://doi.org/10.1016/j.agee.2004.05.009
DOLISA. (2017). Assessment of labour force in Dak Lak province. The Department of Labour‐ Invalids
and Social Affairs (DOLISA). Available http://sldtbxh.daklak.gov.vn/web/guest/‐/%C4%91anh‐
gia‐nguon‐nhan‐luc‐tinh‐%C4%91ak‐lak [Accessed: 14 Sep. 2020]. (In Vietnamese)
Doutriaux, S., Geisler, C., & Shively, G. (2008). Competing for coffee space: development‐induced
displacement in the Central Highlands of Vietnam. Rural Sociology, 73(4), 528‐554.
DPI. (2018). Dak Lak: Coffee production – Processing – Export in the 2017‐2018 season. Department
of Planning and Investment of Dak Lak province (DPI). Available:
http://ipc.daklakdpi.gov.vn/fkaVbjxecgYzxzcaaYxwwVfbeadVsfzU‐
wewgwVaUUgVwxasbbwdezfadwfYweUgd‐1‐162.aspx [Accessed: 14 Sep. 2020]. (In
Vietnamese)
GIZ. (2006). Analysis of the Dak Lak Avocado Chain. A Study Commissioned by the MPI‐GTZ SME
Development Program. Prepared by Fresh Studio Innovations Asia LTD.
GSO. (2017). “Main Result from Vietnam Agriculture Census – 2016”. General Statistics Office of
Vietnam (GSO). Available:
https://www.gso.gov.vn/default.aspx?tabid=512&idmid=5&ItemID=18964 [Accessed: 20 Dec.
2019]. (In Vietnamese)
GSO. (2018). “Statistical Yearbook of Vietnam – 2018”. General Statistics Office of Vietnam (GSO).
Available: https://gso.gov.vn/default.aspx?tabid=512&idmid=5&ItemID=19298 [Accessed: 20
Dec. 2019]. (In Vietnamese)
Hardeweg, B., Klasen, S., & Waibel, H. (2013). Establishing a database for vulnerability assessment. In
Vulnerability to Poverty: Theory, measurement and determinants, with case studies from
Thailand and Vietnam (pp. 50‐79). Palgrave Macmillan, London.
https://doi.org/10.1057/9780230306622_3
Havemann, T., Nair, S., Cassou, E., & Jaffee, S. (2015). Coffee in Daklak, Vietnam. In Scherr, Sara J.,
Mankad, Kedar, Jaffee, Steven and Negra, Christine, Steps Toward Green: Policy Responses to
9the Environmental Footprint of Commodity Agriculture in East and Southeast Asia (99‐122).
Washington, DC: EcoAgriculture Partners and the World Bank.
Hung Anh, N., Bokelmann, W., Do Nga, T., & Van Minh, N. (2019). Toward sustainability or efficiency:
the case of smallholder coffee farmers in Vietnam. Economies, 7(3), 66.
https://doi.org/10.3390/economies7030066
ICO. (2019). Country Coffee Profile: Vietnam. The International Coffee Organisation. Available:
http://www.ico.org/documents/cy2018‐19/icc‐124‐9e‐profile‐vietnam.pdf [Accessed: 23 Dec.
2019].
IDH. (2018). A success story from a pepper province – Dak Lak, Vietnam. The IDH sustainable trade
initiative. News article dated 17.05.2018. Available:
https://www.idhsustainabletrade.com/news/a‐success‐story‐from‐a‐pepper‐province‐dak‐lak‐
vietnam/ [Accessed: 14 Sep. 2020].
Luong, Q. V., & Tauer, L. W. (2006). A real options analysis of coffee planting in Vietnam. Agricultural
Economics, 35(1), 49‐57. https://doi.org/10.1111/j.1574‐0862.2006.00138.x
MARD. (2019). “Monthly Statistical Report of Agricultural Sector“. The Ministry of Agriculture and
Rural Development of Vietnam (MARD). Available: https://www.mard.gov.vn/Pages/bao‐cao‐
thong‐ke.aspx# [Accessed: 20 Dec. 2019]. (In Vietnamese)
TVSEP. Thailand – Vietnam Socio Economic Panel (TVSEP). Waves of 2007, 2008, 2010, 2011, 2013,
2016, 2017 in Vietnam (www.tvsep.de).
World Bank, (2011). Vietnam Coffee Supply Chain Risk Assessment (Draft report). The International
Bank for Reconstruction and Development/the World Bank, August 2011.
10You can also read