PRESENTATION TO Point72 Asset Management - We recommend you buy Royal Caribbean Cruises Ltd. (RCL) 3-Year Price Target: $120.29 - beINvolved
←
→
Page content transcription
If your browser does not render page correctly, please read the page content below
PRESENTATION TO Point72 Asset Management

We recommend you buy Royal Caribbean Cruises Ltd. (RCL)

3-Year Price Target: $120.29

                                                       Team Members
                                                       1. Shyam Rajgarhia
                                                       2. Kiran Patel-O’Connor
                                                       3. Shohith Sama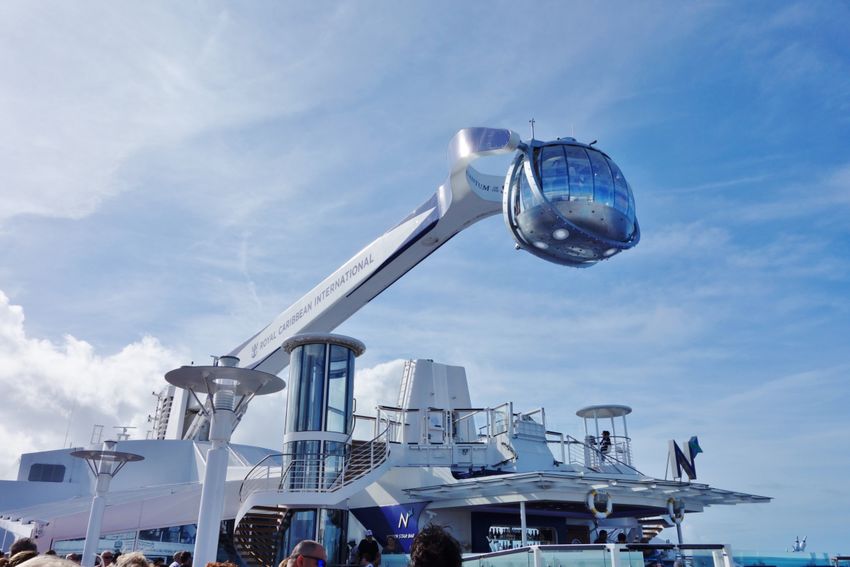
Industry Overview
Cruise Line Industry Highlights                                                Growth Potential
§     Cruise Line industry has had a compounded annual passenger               § Growth Strategies to date have been driven by larger capacity new builds and
      growth rate of 6.55% since 1990.                                           ship diversification, more local ports, more destinations and new on-
§     Current industry penetration (calculated by passengers divided by          board/on-shore activities that match consumer demands.
      population) rates for North America, Europe and Asia are 3.29%,          § Although currently, USA is the largest cruise market, we expect Asia to be the
      1.24%, and 0.09% respectively.                                             fastest growing cruise market in the next 5 years. According to Cruise Lines
§     Only 53% of the target North American Market (or 24% of the US             International Association, between 2012 and 2015, passenger volume grew
      Population) have ever taken an ocean cruise. All the cruise ships in       from 775,000 to nearly 2.1 million passengers in Asia, a 39 percent compound
      the entire world filled at capacity all year long still only amount to     annual growth rate.
      less than ½ of the total number of visitors to Las Vegas.                § China is a main driver of passenger growth in Asia, added 770,000 more
§     The industry faces risk of falling passenger demand due to                 cruise travelers since 2012 - a 66 percent compound annual growth rate.
      epidemics like the Zika Virus, terrorist threats and political unrest      Therefore, we believe that the cruise line industry is a promising investment
      (which have caused slightly slowed growth in Europe), weak                 prospect and we endeavored to find the company most suited to benefit from
      economic conditions and fall in discretionary spending.                    these positive trends.

                     Disposable Personal Income                                    Competitive Landscape
    15500.0                                                                    §    The cruise industry is a highly consolidated in which 3 companies account for
                                                                                    81% of the market share (through various subsidiaries)– Carnival Corporation
                                                                                    (CCL) accounting for 48%, Royal Caribbean Cruises accounting for 23.1%,
    14500.0                                                                         Norwegian Cruise Line Holdings accounting for 10%. The remaining market
                                                                                    share is accounted for by companies such as Genting Hong Kong and Saga plc
                                                                               §    Through analysis of the financial and strategic positions of each company, we
    13500.0                                                                         narrowed down to RCL, CCL, and NCLH. We did not choose NCHL because,
                                                                                    while CCL benefits from economies of scale due its large size and RCL enjoys
                                                                                    economies of scale due to its larger ships, thereby spreading costs among more
    12500.0                                                                         customers – NCLH is at a disadvantage.
                                                                               §    Secondly, while both CCL and RCL have significant operations in China,
                                                                                    which is currently the fastest growing cruise market, NCLH will debut only
    11500.0                                                                         this summer. Thirdly, NCLH has a Debt/EBITDA of 4.25 times, making it
                                                                                    highly susceptible to interest rate changes and possibly insolvency in case of a
                                                                                    major downturn in the global economy.
    10500.0                                                                    §    We initiated coverage on RCL due to its superior operational efficiency, judged
              2010    2011   2012   2013     2014     2015     2016     2017        from cruise industry specific metrics and economic moat, as described in the
                                                                                    following slides.

                                                                                                                                                        1
Royal Caribbean International Ltd. Overview

Company Overview                                                      Current and Future Business Prospects

§ Headquarters: Miami, Florida
                                                                                                                With 23 ships its accounts for 2/3 capacity.
§ Founded: 1997| Stock Ticker: RCL
§ Number of Employees: 64,000
§ Royal Caribbean Cruises is a cruise line company with six
                                                                                                                RCL’s luxury brand, which sails primarily
  major brands that target middle to higher middle class                                                        in the Caribbean with10 ships.
  demographics in the North America, Europe, and Asia
§ Market Capitalization: $21.0 billion                                                                          Spanish brand which serves France and
§ Current Stock Price: $97.80                                                                                   Spain. RCL has a 49% stake.
Revenue Structure
                           27%                                                                                  Luxury brand with 2 ships in its fleet

    Passenger Ticket
    Revenue                                                                                                     German brand in which RCL is a 50% joint
                                                                                                                venture owner.

    On-board Revenue                                                                                            RCL has a 35 % stake in this strategic
                                                                                                                alliance with local travel agency ctrip.com
                                                                                                                and the first Chinese national cruise line
                                                        73%

§ Passenger Ticket Revenues - Represents sales from passenger         § Together, its Global Brands and its Partner Brands operate a combined total of 49
  ticket purchases and accounts for 73% of total revenue                ships in the cruise vacation industry with an aggregate capacity of approximately
§ On–Board Revenues - Represents purchases made while on                125770 berths as of December 31, 2016.
  board the cruise. It is made up of alcoholic beverages purchases,   § It plans to add 11 more ships, which a total capacity of 39000 berths by 2022. More
  gambling, spa treatments, and other on-board amenities. It            details on the future prospects are given in the following slides
  Accounts for 27% of total revenue

                                                                                                                                                 2
Investment Thesis
Financial Analysis
Based on our analysis of metrics which are relevant to the cruise industry, we have concluded that RCL demonstrates a greater
operational efficiency when compared with CCL.
Firstly, we define certain key terms that are relevant to our financial analysis:
Available Passenger Cruise Days (APCD): A measure of capacity, represent double occupancy per cabin multiplied by the number of cruise days for the
period. APCD is referred to as Available Lower Berth Days (ALDB) in case of Carnival Corp (CCL).
Net Yield: Total revenue (less of commissions, transportation and on-board expenses)/ Capacity (APCD)
Net Cruise Costs: (Operating Expenses + SG&A – Commission & Transportation – On - Board Expenses)
Passenger Cruise Days: The number of passengers carried for the period multiplied by the number of days of their respective cruises.
Occupancy: Passenger Cruise Days/APCD (or ALDB in case of CCL)

 Quarter 4, 2016                                                               Full Year 2016
 § Net yields rose 5.3 % on a constant currency basis                          § RCL’s Net yield was $179.92 in 2016, as compared to $169.74 for CCL.
 § Net Cruise Costs per APCD (excluding fuel) decreased by                       The Net Yield increased also by 3.910% Year – on – Year (hereafter
   1.9% due to a decrease in operating expenses                                  abbreviated as Y-o-Y ). Thus, not only is RCL making more money on its
                                                                                 available capacity, it is also increasing the rate at which it does so.
 Financial Analysis
                                                                               § The Net Cruise Costs per APCD (excluding fuel) was $94.62 for RCL in
 § We believe that in this industry, the Operating Profit Margin is much         2016, as compared to $97.34 for CCL. This measure increased by 0.9%
   more important than the Net Profit Margin, because the latter can be          for RCL on Y-o-Y basis, compared to a 1.7% increase in case of CCL.
   significantly affected by gains and losses on derivatives used to hedge       Thus, RCL is better able to spread the costs among its passengers,
   against oil price and interest rate movements.                                perhaps because of its larger ships, and therefore has a cost advantage.
 § RCL’s Operating Profit Margin in the most recent quarter is 15.66% as         This is a major competitive advantage.
   against 15.17% for CCL. Over the past 5 years, the RCL’s Operating          § Occupancy was 106.4 for RCL in 2016, a 1.23% increase from the prior
   Margin has grown 12% per year on average, as against 8.7% for CCL.            year. Whereas, occupancy was only 105.9 for CCL in 2016, a 1% increase.
   Thus, not only is RCL’S Operating Margin higher, due to its newer and         This indicates that despite having larger ships, RCL is better able to
   bigger fleet, it is also growing at a faster pace, giving a higher upside     utilize its available berths/cabins
   potential in the stock price.                                               § Fuel consumption per APCD: 0.035 metric tons for RCL vs 0.041 metric
                                            ROE        P/E      OPM              tons for CCL. Therefore, RCL is 17% more fuel efficient.
                                  RCL     14.94%      15.98   15.54
                                  CCL     11.99%      16.39   15.17

                                                                                                                                                3
Investment Thesis - Catalysts
Strong Booked Position for 2017                                       Greater Economies of Scale from Larger Ships
§ The company's booked position for 2017 is better than last          § RCL’s major competitive advantage is that on average, its ships
  year's record high, and at higher rates.                              are the largest in the cruise industry, enabling it to spread its
§ Strength from North American consumers is driving                     costs over a larger number of passengers.
  exceptionally positive trends for North American and                § For instance, its new ship, Symphony of the Seas, will be the
  European products.                                                    largest in the world, replacing its own ship – Harmony of the Seas.
§ Furthermore, robust demand in Australia for Ovation of              § We believe that RCL will be able to better leverage its larger
  the Seas, exceedingly strong demand for Harmony of the                sized ships due to economic recovery in USA and Europe,
  Seas in the Caribbean, and solid booked position in China             which will lead to a growth in Occupancy and higher Net
  for the first half of the year are likely to be key contributors      Yields.
  to this yield improvement in 2017

Strong Position in China
§ From 2012-2016, there has been a 66% CAGR in Chinese Cruise passengers.
  RCL is well positioned to benefit from this trend.
§ The first ship in its Quantum Series, the Quantum of the Seas is devoted to
  the Chinese market, is tailor made for the tastes of Chinese consumers and
  has some unique features, which will be explained in the following slides.
§ In June 2016 , RCL announced the launch of the of the third ship in the series,
  The Ovation of the Seas. Apart from being the 6th largest cruise ship in the
  world, it is also custom made for the Chinese markets. With 3 other vessels
  deployed in China – the Voyager of the Seas, Mariner of the Seas and the Legend
  of the Seas, RCL has the largest fleet in China. China accounts for 9% of
  RCL’s total capacity
§ Moreover, it has a joint venture called SkySea Cruises with the Chinese
  travel giant Ctrip and Shanghai based asset manager Stone Capital. SkySea
  took ownership of RCL’s Celebrity Century, which was customized for the
  Chinese market and plans to roll out more ships. We believe that through
  Ctrip RCL will have access to the marketing network, customer base,                Source: Chinese Cruise & Yacht Industry Association
  technical expertise and high level of service in China.

                                                                                                                                           4
Investment Thesis - Catalysts
Technological Innovation
Project Edge WOW Bands
§ Celebrity Cruises will add two ships under a new class, dubbed Project § WOW Bands (pictured below on the right) are bracelets with an RFID
Edge, to build upon the Millennium and Solstice-class vessels already in chip in them that can be used in place of the SeaPass cards and are much
its fleet. Delivery of the first two Edge-class ships is expected in the fall of more convenient. The band can be used to enter the room by waving it in
2018, with the second vessel to follow in early 2020. front of the door, is convenient to have while swimming as it is
§ These Edge class ships will incorporate cutting edge technology and waterproof, is compatible with the games in the casino and is less
significant fuel efficiency. For instance, there will be a new mobile app susceptible to being lost or forgotten, unlike the SeaPass cards.
for guests and the crew, and it will include machine learning and AI to § Carnival Corp also has a similar product called the Medallion, which will
act as an intelligent personal assistant for passengers. The company's debut in November this year. However, RCL has a headstart, as it
tech team is working on a range of new features, including facial started developing these bands 2 years ago. It will have them in 20% of
recognition to allow for check-in at ports, wayfinding, and automatically its ships by the end of 2017 as compared to 1% for Carnival. RCL expects
unlocking cabin doors for the cabin's occupant. to have WOW Bands in roughly 50% of its ships by end of 2018.
Quantum of the Seas
§ It is unlike any other ship that caters to the expanding Chinese Market
and is the most popular cruise in China. This is because it has some
special features such as a skydiving simulator, the North Star (to the
right) and the Bionic Bar. The North Star is very similar to the London
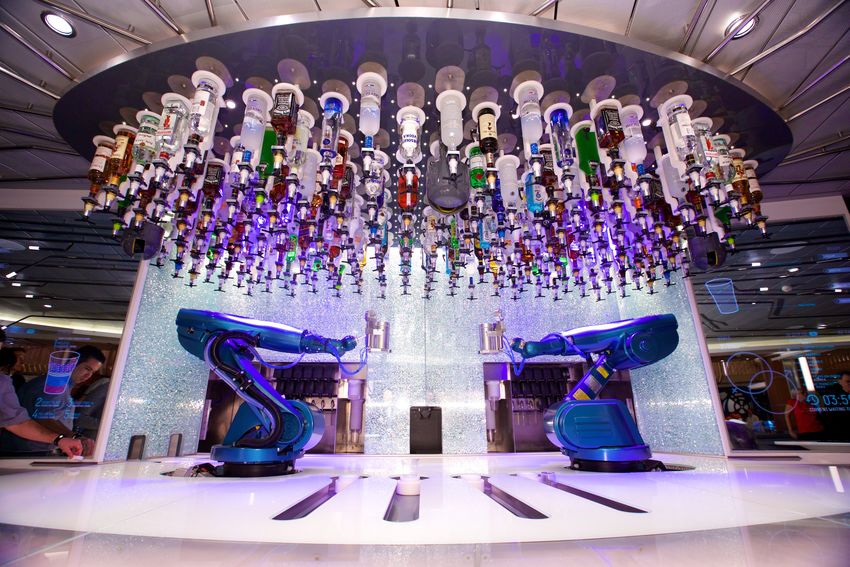
Eye and consists of a glass cubicle that takes passenger 300 feet above
sea level. The Bionic Bar uses robotic bartenders, which take customer
orders through a tablet and are able to create drinks containing the
precise quantities of ingredients. North Star on Quantum of the Seas WOW Band
Other Sources of Demand
§ Many cruise lines have purchased or leased private islands. RCL also has CocoCay in
Bahamas and Labadee in Haiti, which cater to luxury segment of the cruise market.
§ Cruises from the Royal Caribbean brand and the Azambra brand have been
approved for sailings to Cuba. RCL has added 13 itineraries to Cuba this year.
§ RCL has enetered into an agreement with the Government of The Bahamas to grow
tourism to that country and employ more Bahamian nationals. Royal Caribbean
currently brings 1.7 million visitors a year to The Bahamas, with plans to significantly Bionic Bar
expand that number in the next decade as they add capacity in the region. on Quantum
of the Seas
5Royal Caribbean Cruises Ltd. Comparable Companies Analysis
Name Ticker Market Cap Price OPM ROE ROA ROIC P/E P/B P/S EV/EBITDA T12M Int Cov Rt
ROYAL CARIBBEAN CRUISES LTD RCL $20,533.10 $98.70 15.54% 14.94% 5.94% 8.57% 16.35 2.3 2.48 10.10x 3.68%
CARNIVAL CORP CCL $40,835.89 $57.64 15.17% 11.99% 7.11% 9.34% 16.63 1.85 2.62 9.60x 15.37%
NORWEGIAN CRUISE LINE HOLDINGS NCLH $11,536.70 $51.31 13.65% 15.22% 5.02% 8.65% 16.96 2.57 2.39 11.62x 1.74%
Mean $24,301.90 $69.22 14.79% 14.05% 6.02% 8.85% 16.65 2.24 2.50 10.44x 6.93%
Median $20,533.10 $57.64 15.17% 14.94% 5.94% 8.65% 16.63 2.30 2.48 10.10x 3.68%
Forward Net Debt to Debt to EV/EBITDA Gross Margin % 52 Week Price Debt/Com Dvd Yld Diluted EPS
Name P/E EBITDA EBITDA Nxt Yr Range Equity T12M
ROYAL CARIBBEAN CRUISES LTD 13.50 3.90x 3.25x 9.46x 64.42% 97.47% 102.92% 1.75% 5.94
CARNIVAL CORP 15.40 1.84x 1.97x 9.55x 41.07% 95.42% 41.84% 2.34% 3.74
NORWEGIAN CRUISE LINE HOLDINGS 12.90 4.57x 4.67x 10.01x 38.22% 80.07% 141.01% 0.00% 2.78
Mean 13.93 3.44x 3.43x 9.68x 47.90% 90.99% 95.26% 1.36% 4.15
Median 13.50 3.90x 3.96x 9.55x 41.07% 95.42% 102.92% 1.75% 3.74
Abbreviations Summary
§ OPM – Operating Profit Margin
§ RCL is operationally superior
§ Int Cov Rt – Interest Coverage Ratio
§ RCL’s operating profit margin (15.54%) exceeds
§ Dvd Yld – Dividend Yield
CCL’s (15.17%)
§ T12M – Trailing Twelve Months
§ RCL’s Gross Margin (64.42%) far exceeds
competitors Gross margins (41.07% & 38.22%)
due to its appeal and more premium cruise lines
6Royal Caribbean Cruises Ltd. Discounted Cash Flow Analysis
($ in Millions) Historical Period Projection Period
2015 2016 2017 2018 2019 2020 2021 2022 2023
Revenue $8,299.07 $8,496.40 $8,477.34 $8,765.57 $9,234.53 $9,815.61 $10,436.55 $10,963.85 $11,320.18
%Growth YoY 2.79% 2.38% -0.22% 3.40% 5.35% 6.29% 6.33% 5.05% 3.25%
Cost of Goods Sold $5,099.39 $5,015.54 $4,840.61 $4,940.43 $5,167.88 $5,266.11 $5,577.77 $5,703.99 $5,889.37
% of Revenue 61.4% 59.0% 57.1% 56.4% 56.0% 53.7% 53.4% 52.0% 52.0%
Gross Profit $3,199.68 $3,480.86 $3,636.73 $3,825.14 $4,066.65 $4,549.50 $4,858.78 $5,259.86 $5,430.81
Gross Margin 38.6% 41.0% 42.9% 43.6% 44.0% 46.3% 46.6% 48.0% 48.0%
Selling, General, & Administrative $1,098.92 $1,115.09 $1,111.00 $1,152.00 $1,185.00 $1,223.00 $1,287.00 $1,330.00 $1,370.00
% of Revenue 13.2% 13.1% 13.1% 13.1% 12.8% 12.5% 12.3% 12.1% 12.1%
EBITDA $2,100.76 $2,365.77 $2,525.73 $2,673.14 $2,881.65 $3,326.50 $3,571.78 $3,929.86 $4,060.81
% of Revenue 25.3% 27.8% 29.8% 30.5% 31.2% 33.9% 34.2% 35.8% 35.9%
Depreciation & Amortization $827.01 $894.92 $957.56 $1,024.59 $1,096.31 $1,173.05 $1,255.16 $1,343.03 $1,410.18
EBIT $1,273.75 $1,470.86 $1,568.17 $1,648.55 $1,785.34 $2,153.45 $2,316.62 $2,586.83 $2,650.63
% of Revenue 15.3% 17.3% 18.5% 18.8% 19.3% 21.9% 22.2% 23.6% 23.4%
Taxes $12.53 $0.00 $7.84 $8.24 $8.93 $10.77 $11.58 $12.93 $13.25
% of EBIT 0.98% -- 0.50% 0.50% 0.50% 0.50% 0.50% 0.50% 0.50%
Effective Tax Rate 0.98% 0.00% 0.50% 0.50% 0.50% 0.50% 0.50% 0.50% 0.50%
EBIAT $1,261.22 $1,485.66 $1,560.33 $1,640.31 $1,776.41 $2,142.68 $2,305.03 $2,573.90 $2,637.37
% of Revenue 15.2% 17.5% 18.4% 18.7% 19.2% 21.8% 22.1% 23.5% 23.3%
Plus: Depreciation & Amortization $827.01 $894.92 $957.56 $1,024.59 $1,096.31 $1,173.05 $1,255.16 $1,343.03 $1,410.18
Less: Capital Expenditures $1,613.34 $2,494.41 $600.00 $2,600.00 $1,500.00 $2,000.00 $2,300.00 $2,200.00 $1,750.00
Less: (Inc.)/Dec. in Net Working Capital $(407.60) $(237.50) $80.00 $80.00 $80.00 $80.00 $80.00 $80.00 $80.00
Unlevered Free Cash Flows $882.49 $123.66 $1,837.89 -$15.10 $1,292.72 $1,235.73 $1,180.20 $1,636.93 $2,217.55
WACC
Discount Period 1 2 3 4 5 6 7
Discount Factor 0.92 0.85 0.78 0.72 0.66 0.61 0.56
Present Value of Free Cash Flow $1,693.23 -$12.82 $1,010.87 $890.25 $783.32 $1,000.94 $1,249.25
7Royal Caribbean Cruises Ltd. Discounted Cash Flow Analysis [Continued]
Sensitivity Analysis
RCL WACC Calculation Terminal Value Using Exit Multiple Method (EMM) Enterprise Value
Capital Structure 2023 EBITDA $4,060.81 Exit Multiple
Market Value of Equity $20,939.39 9.1x 9.6x 10.1x 10.6x 11.1x
Exit Multiple 10.10x
Market Value of Debt $8,101.79 6.5% $30,863.74 $32,166.60 $33,469.46 $34,772.32 $36,075.17
Debt Terminal Value $41,030.38 7.5% $29,091.24 $30,311.62 $31,532.01 $32,752.39 $33,972.78
Weight of Debt 27.90% Present Value $23,114.40 WACC 8.5% $27,441.79 $28,585.62 $29,729.44 $30,873.27 $32,017.09
Average Weighted Cost 3.68% Enterprise Value $29,729.44 9.5% $25,905.74 $26,978.44 $28,051.14 $29,123.85 $30,196.55
Tax Rate 0.50% Implied EV/EBITDA 7.32x 10.5% $24,474.23 $25,480.82 $26,487.42 $27,494.01 $28,500.60
Tax-Effected Cost of Debt 3.66% % of Enterprise Value 77.75%
Weighted Cost of Debt 1.02% Implied Equity Value
Equity Exit Multiple
Weight of Equity 72.10% Implied Equity Value and Share Price 9.1x 9.6x 10.1x 10.6x 11.1x
Levered Beta 1.22 Enterprise Value $29,729.44 6.5% $22,894.64 $24,197.50 $25,500.36 $26,803.21 $28,106.07
Risk-Free Rate 2.49% Less Total Debt $8,101.70 7.5% $21,122.14 $22,342.52 $23,562.91 $24,783.29 $26,003.68
Expected Market Return 9.00% Plus Cash & Cash Equivalents $132.60 WACC 8.5% $19,472.69 $20,616.52 $21,760.34 $22,904.17 $24,047.99
Market Risk Premium 6.51% 9.5% $17,936.63 $19,009.34 $20,082.04 $21,154.74 $22,227.45
Less Preferred Stock $-
CAPM 10.43% 10.5% $16,505.13 $17,511.72 $18,518.32 $19,524.91 $20,531.50
Less Non-Controlling Interest $-
Weighted Cost of Equity 7.52%
Implied Equity Value $21,760.34 Implied Share Price
WACC 8.54% Implied Share Price (2017) $100.60 Exit Multiple
9.1x 9.6x 10.1x 10.6x 11.1x
6.5% $105.84 $111.86 $117.88 $123.91 $129.93
Legend Sum of PV of FCF $6,615.05 7.5% $97.64 $103.29 $108.93 $114.57 $120.21
Enterprise Value $29,729.44 WACC 8.5% $90.02 $95.31 $100.60 $105.88 $111.17
Management's projections 9.5% $82.92 $87.88 $92.84 $97.80 $102.75
Implied Equity Value $21,760.34
Assumptions 10.5% $76.30 $80.95 $85.61 $90.26 $94.91
Fully Diluted Shares (in millions) 216.32
Calculations
Implied Price Per Share $100.60 § In this slide, we have listed our assumptions and how we
(Historical data is also in black) have achieved these assumptions.
Multiple (Median EV/EBITDA) 10.10x
§ We assume a WACC of 8.54%
§ We assume an Exit Multiple of 10.10
§ We also reached an implied share price of $100.60
8Royal Caribbean Cruises Ltd. Valuation Summary
Method Used to Reach Price-Target
1. In order to find a 3-year price target RCL, we decided to find the implied share price in 2019.
2. Do do this, we projected two additional years of Free Cash Flows by using the terminal year
EBITDA growth rate of 3.25%.
3. We discounted the Future Free Cash Flows at our WACC of 8.54%. To be clear, we are
“acting” as if 2019 is the present and discounting future free cash flows accordingly.
4. We then used the exit multiple method (shown below) to reach the enterprise value in 2019,
assuming an exit multiple of 10.10x.
5. We then found the implied equity value and divided it by fully diluted share outstanding
(216.32 million) to reach our implied share price of $120.29.
6. The implied share price in 2019 is our price-target and represents a 21.87% upside to today’s
share price ($98.70 as of 3/7/2017).
Terminal Value Using Exit Multiple Method (EMM) Implied Equity Value and Share Price 2019
2025 EBITDA $4,469.74 Enterprise Value $33,988.85
Exit Multiple 10.10x
Less Total Debt $8,289.34
Terminal Value $45,162.26
Plus Cash & Cash Equivalents $321.86
Present Value $25,442.09
Less Preferred Stock $-
Sum of PV of FCF $8,546.76
Enterprise Value $33,988.85 Less Non-Controlling Interest $-
Implied EV/EBITDA 7.60 Implied Equity Value $26,019.75
% of Enterprise Value 74.85% Implied Share Price (2019) $120.29
($ in millions) 2019 2020 2021 2022 2023 2024 2025
Free Cash Flows $1,292.72 $1,235.73 $1,180.20 $1,636.93 $2,217.55 $2,289.62 $2,364.04
Discount Period 1 2 3 4 5 6 7
PV of Free Cash Flows $1,191.01 $1,048.93 $922.96 $1,179.42 $1,472.06 $1,400.31 $1,332.06
9Investment Risks
Epidemics Weak Economic Conditions Security Threats and Political Conditions
§ Epidemics like the Zika Virus. In 2016, § The demand for cruises is affected by § Events such as terrorist attacks, war (or war-like
the Center for Disease Control and international, national and local economic conditions), conflicts (domestic or cross-border), civil
Prevention warned against pregnant conditions. Weak or uncertain economic unrest and the resulting political instability, travel
women travelling to Miami, which is an conditions impact consumer confidence and restrictions and advisories, and concerns over safety of
important departure port for many of pose a risk as vacationers may postpone or traveling have had, and could have in the future, a
the cruise lines’ ships in wake of several reduce discretionary spending. This, in turn, significant adverse impact on demand and pricing in
cases of Zika Virus in that area. may result in cruise booking slowdowns, the travel and vacation industry. For example, the
decreased cruise prices and lower onboard series of terrorism incidents throughout Europe in
Currency and Interest Rate Fluctuations revenues. Given the global nature of RCL’s early 2016 negatively impacted demand for European
business, it is exposed to many different cruises in 2016, particularly from North American
§ Fluctuations in foreign currency
economies and could be hurt by challenging guests. In view of RCL’s global operations, it is
exchange rates, fuel prices and interest
conditions in any of its markets. susceptible to a wide range of adverse events.
rates. A strong US dollar has adversely
affected its earnings, and could further Leverage Long-term–Debt/EBITDA
strengthen due to interest rate increases
by the Federal Reserve ( as investors § One major risk is that the company is 5.0
will demand more US Dollars to take highly leveraged, with a Long-term-
advantage of the higher relative interest Debt/EBITDA of 3.25 and could be 4.5
rates) As per RCL’s own guidance in its adversely affected by rising interest rates.
most recent 10 K: However, this risk will be mitigated to
4.0
some extent for the following reasons:
Factor Impact on 2017 Earnings § The percentage of Fixed Interest Rate
loans in RCL’s portfolio has been 3.5
10% change in fuel prices $30 million
consistently rising. It is currently 40.5% as
1% change in currency $17 million against 31.2% a year ago. 3.0
1% change in LIBOR $43 million § They use interest-rate swaps to hedge 2012 2013 2014 2015 2016
interest rate risk.
§ As you can see in the charts, Long-term- Overcapacity in the Caribbean
Debt/EBITDA and Interest Coverage Ratio § There is a risk of having too much existing
have show a positive trend over the past 5 capacity for Miami – based Caribbean tours
years. from various cruise lines
10You can also read