DECEMBER 2020 INTERIM RESULTS - March 2021 - Gravis Capital

Page created by Manuel Freeman
 
CONTINUE READING
DECEMBER 2020 INTERIM RESULTS - March 2021 - Gravis Capital
STUDENT

          DECEMBER 2020
          INTERIM RESULTS
          March 2021
DECEMBER 2020 INTERIM RESULTS - March 2021 - Gravis Capital
IMPORTANT NOTICE
This presentation (the "Presentation") has been prepared by Gravis       No undertaking, representation, warranty or other assurance, express or
Capital Management Limited (the "Investment Manager“ or “Gravis”) and    implied, is made or given by or on behalf of the Company or the
is for information purposes only.                                        Investment Manager or any of their respective directors, officers,
                                                                         partners, employees, agents or advisers or any other person as to the
This Presentation is not intended for distribution to, or use by, any
                                                                         accuracy or completeness of the information or opinions contained in
person or entity in any jurisdiction or country where such
distribution or use would be contrary to local law or regulation. Any    this Presentation and no responsibility or liability is accepted by any
recipients of this presentation outside the UK should inform             of them for any such information or opinions or for any errors,
themselves of and observe any applicable legal or regulatory             omissions, misstatements, negligence or otherwise for any other
requirements in their jurisdiction, and are treated as having            communication written or otherwise. In addition, neither the Company
represented that they are able to receive this Presentation without      nor the Investment Manager undertake any obligation to update or to
contravention of any law or regulation in the jurisdiction in which      correct any inaccuracies which may become apparent in these slides. The
they reside or conduct business.                                         information in this Presentation is subject to updating, completion,
                                                                         revision, further verification and amendment without notice.
This Presentation is not intended to provide the basis for any credit
or other evaluation of any securities of GCP Student Living plc (the     In considering the performance information contained herein, recipients
"Company") (or any other current or future investment vehicle managed
                                                                         should bear in mind that past performance is not necessarily indicative
or advised by the Investment Manager or any of its affiliates) and
should not be considered as a recommendation, invitation or inducement   of future results, and there can be no assurance that return
that any investor should subscribe for, dispose of or purchase any       projections will be met. Certain of the past performance information
such securities or enter into any other transaction with the Company     presented herein may not be representative of all transactions of a
or any other person. The merits and suitability of any investment        given type. Any forward-looking statements have not been independently
action in relation to securities should be considered carefully and      audited, examined or otherwise reviewed or verified and nothing in this
involve, among other things, an assessment of the legal, tax,            Presentation should be construed as a profit forecast.
accounting, regulatory, financial, credit and other related aspects of
such securities.                                                         Certain information contained herein (including forward-looking
                                                                         statements and economic and market information) has been obtained from
Any recipient of this document will be taken to have warranted,          published sources and/or prepared by third parties and in certain cases
represented and undertaken to the Investment Manager and the Company
                                                                         has not been updated to the date hereof. While such sources are
its has read, agrees to and will comply with the terms of this notice;
and will conduct its own analyses or other verification of the data      believed to be reliable for the purpose used herein, none of the
set out in this document and will bear the responsibility for all or     Investment Manager or any of its directors, officers, employees,
any costs incurred in doing so.                                          partners, members, shareholders or affiliates, or any other person
                                                                         assumes any responsibility for the accuracy or completeness of such
The Investment Manager acts only for the Company and will not be         information.
responsible to any third party for providing the protections afforded
to clients of the Investment Manager and will not be advising a third    This is a financial promotion and is not intended to be investment
party on investing in the Company.                                       advice. The content of this Presentation has been prepared by, is the
                                                                         sole responsibility of and has been approved as a financial promotion,
                                                                         solely for the purpose of section 21(2)(b) of the Financial Services
                                                                         and Markets Act 2000 (as amended), by Gravis, authorised and regulated
                                                                         by the Financial Conduct Authority. Gravis is registered in England and
                                                                         Wales No: 10471852 and its principal place of business is at 24 Savile
                                                                         Row, London W1S 2ES.

STUDENT                                                                                                                                            2
DECEMBER 2020 INTERIM RESULTS - March 2021 - Gravis Capital
CONTENTS

                                  -   Introduction

                                  -   Where, what and how

                                  -   The London Advantage

                                  -   December 2020 update

                                  -   Operating performance

                                  -   Portfolio update

                                  -   ESG

                                  -   UK student accommodation market

                                  -   Portfolio fundamentals

                                  -   Conclusion

                                  -   Appendices

STUDENT   ScapeScape
                Bloomsbury,CGI
                ScapeShoreditch
                      Brighton                                          3
DECEMBER 2020 INTERIM RESULTS - March 2021 - Gravis Capital
INTRODUCTION
                     GCP Student Living plc (“the Company”)

                 -   GCP Student is the only UK REIT focused on modern,
                     purpose-built private student accommodation in and
                     around London

                 -   The Company seeks to provide attractive total returns in
                     the longer term

                 -   Investments located primarily in and around London,
                     where there is a long-term structural shortfall of student
                     accommodation

                 -   Strong rental growth characteristics - focus on locations
                     likely to benefit from supply and demand imbalances and
                     a growing number of international students

                 -   The Company faces challenges during the current
                     academic year due to restrictions on student mobility and
                     the provision of in-person teaching

                 -   Diversified operational portfolio of c.4,100 beds; portfolio
                     valuation of £1.03bn at 31 December 2020

                 -   Annualised NAV total return since IPO of 12.1%, with
                     annualised share price return of 9.1%

Scape Mile End       Return data relates to period from 20 May 2013 to 31 December 2020   4
DECEMBER 2020 INTERIM RESULTS - March 2021 - Gravis Capital
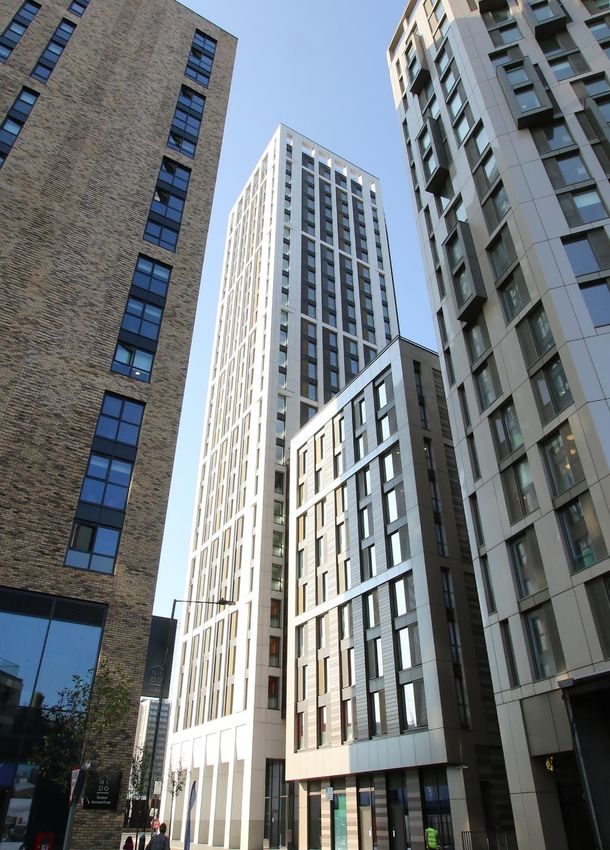
WHERE, WHAT AND HOW

STUDENT               5
DECEMBER 2020 INTERIM RESULTS - March 2021 - Gravis Capital
THE LONDON ADVANTAGE
The London student accommodation market                            Student accommodation supply
is underpinned by surplus long term                                and demand in London 2019/20
demand

Supply constrained:
                                                                 500,000

Land availability & planning tax
                                                                 450,000

The London Plan
                                                                 400,000
                                                                                       International
Outlook for development of new schemes in London remains                                 students
low                                                              350,000

Strong demand:                                                   300,000

                                                                                         Domestic
One in four students in UK HEIs study in London and the South    250,000
                                                                                      postgraduates

East
                                                                 200,000
London has the largest international student population with
c.150,000 students
                                                                 150,000

London has five of the 24 Russell Group universities in the UK                           Domestic
                                                                                                                                Pipeline
                                                                 100,000             undergraduates
and two of the top ten universities in the world
                                                                                                                              Private halls

                                                                  50,000
                                                                                                                               University
                                                                                                                               halls of
                                                                                                                               residence
                                                                      -
                                                                                          Demand                                 Supply

STUDENT                                                            Sources: Higher Education Statistics Agency, KF Research                   6
DECEMBER 2020 INTERIM RESULTS - March 2021 - Gravis Capital
DECEMBER 2020 UPDATE
   Stable NAV for the quarter with positive
   sector outlook
Portfolio
                                        Quarter       FY21
                                        movement      movement
   NAV                 171.38p           0.2%         0.2%
   Valuation           £1.03bn           0.2%*        0.2%*

   -     PBSA transactional activity supportive of PBSA valuations

   -     Scape Brighton opened to students from September

Income

   -     Bookings at 68% for AY 20/21 vs full each year since IPO

   -     Occupancy of booked beds at 64%

   -     Into have paid their rent in full for the 20/21 academic year

   -     Second FY21 interim dividend of 0.25p declared

   -     Post quarter end:
         - rent concession of 6 weeks offered to students unable to
            occupy their rooms during the current lockdown

         -    WeWork lease has been terminated and the Company
              has taken vacant possession of the space

   * Like for like valuation movement
  STUDENT                                                                           77
                                                                         Scape Wembley
DECEMBER 2020 INTERIM RESULTS - March 2021 - Gravis Capital
OPERATING PERFORMANCE -
     INCOME STATEMENT
                                                                    Commentary
     For period ended 31 December 2020
                                       31 Dec 20   31 Dec 19
                                           £’000       £’000
Rental income                             16,949      24,587         Rental income decreased by 31% in the period, due to
                                                                     reduced occupancy as international mobility became
Operating expenses                       (6,248)     (5,236)
                                                                     restricted due to the ongoing Covid-19 pandemic
Gross profit                              10,701      19,351
Administration expenses                  (4,242)     (4,738)         Operating expenses increased by 19% due to the
                                                                     opening of Scape Brighton and property management
Aborted transaction costs                  (119)           -
                                                                     fees being reallocated to operating expenses from
Operating profit before gains on                                     administrative costs
                                           6,340      14,613
investment properties
Fair Value gains on investment                                       Gross profit margin decreased to 63% from 79%​ due to
                                           4,535      37,987
properties
                                                                     reduced occupancy and property management fees being
Fair value gains on financial Assets         32          22          moved from administrative costs
Operating profit                          10,907      52,622
                                                                     Operating margin before gains on investment
Net Finance costs                        (5,105)     (4,856)
                                                                     properties has reduced to 37%​ from 59%
Profit for the year                        5,802      47,766
                                                                     Ongoing Charges Ratio is 1.2%†
Basic Group EPS                             1.28       11.52
                                                                     Finance costs have increased by 5% to fund capital
Group-specific adjusted EPS*                0.71        2.91         expenditure and to preserve liquidity. The blended cost of
Dividends per share                         0.50        3.15         drawn debt is 2.93%
Dividend cover                            142%          92%
                                                                     Dividend was 142% covered reflecting the reduction of
                                                                     the dividend during the period

                                                               *EPRA EPS adjusted for non-recurring transactions and licence fees on forward-funded developments
                                                               | †Based on AIC methodology, excluding direct property costs
    STUDENT                                                                                                                                                        8
DECEMBER 2020 INTERIM RESULTS - March 2021 - Gravis Capital
OPERATING PERFORMANCE -
     BALANCE SHEET
     At 31 December 2020                              Commentary

                              31 Dec 20   30 Jun 20
                                  £’000       £’000
Assets                                                Investment property increased by 2.9% due to capital
                                                      expenditure on Scape Brighton and Circus St and modest
                                                      valuation uplifts.
Investment property           1,039,040   1,009,838
Cash and cash equivalents        43,911     60,358    Valuation gains of £4.5m represent a 0.2% like-for-like
                                                      increase driven by the completion of Scape Brighton.
Trade and other receivables      17,341     17,979
Total Assets                  1,100,292   1,088,175   Cash decreased from £60.4m to £43.9m as the Company
                                                      part funded development costs from available resources
Liabilities
                                                      Loans and borrowings increased by £7.1m to fund
                                                      Scape Brighton. £38m was drawn on the development
Loans and borrowings          (286,517)   (279,456)   facility and the redrawable facility was £15m drawn at
Trade and other payables        (8,510)     (9,607)   period end​.
Lease liability                (11,751)    (11,608)
                                                      EPRA NTA per share (cum-income) fell by 0.2% to
Deferred income                (13,892)     (6,085)   171.38 as at the period end
Total liabilities             (320,670)   (306,756)

Net assets                     779,622     781,419

EPRA NTA per share (cum-
                                 171.38     171.78
income) (pps)

    STUDENT                                                                                                     9
DECEMBER 2020 INTERIM RESULTS - March 2021 - Gravis Capital
Portfolio update

STUDENT            Scape Bloomsbury
PORTFOLIO OVERVIEW
     At 31 December 2020

            80%                                 2

                                                    4   3   1

                                 7 6                            5

Property
                                11
1    Scape Mile End

2    Scape Wembley

3    Scape Shoreditch

4    Scape Bloomsbury

5    Scape Greenwich

6    The Pad, Egham                  8

7    Podium, Egham                       9 10

8    Scape Guildford

9    Circus Street, Brighton*

10   Scape Brighton
     Water Lane Apartments,
11
     Bristol
     STUDENT                                                        * Office element under construction   11
PORTFOLIO OVERVIEW
 At 31 December 2020

                                                                                                                   Commercial
                                  Year      Book                                  % of
Property            Beds                           Valuation   Location                                 NIY             space
                             completed      cost                             portfolio
                                                                                                                       (sqft)
Scape Shoreditch       541        2015   £166.8m     £209.7m    London                  20%        4.32%               49,000
Scape Bloomsbury       432        2018   £167.3m     £194.7m    London                  19%        4.00%                 nil
Scape East             588        2012    £94.3m     £163.1m    London                  16%        4.42%               22,000
Scape Wembley          578        2017    £78.0m     £106.5m    London                  10%        4.65%                 nil
Scape Brighton         555        2020    £73.2m     £100.0m   Brighton                 10%        5.11%                1,500
Circus Street*         450        2019    £61.9m      £79.0m   Brighton                   8%       4.00%               29,000
Scape Greenwich        280        2014    £40.5m      £61.0m    London                    6%       4.59%                 nil
The Pad                220        2013    £28.6m      £33.4m    Surrey                    3%       5.80%                 nil
Podium                 178        2017    £29.6m      £31.3m    Surrey                    3%       5.65%                 nil
Scape Guildford        141        2015    £19.1m      £28.0m    Surrey                    3%       5.15%                 nil
Water Lane
                       153        2015    £18.8m      £23.0m   Bristol                    2%       5.25%                 nil
Apartments
Total              4,116                 £778.9m   £1,029.7m                                       4.52%             101,500

                                                                    *Includes office under construction (£10.3m)
 STUDENT                                                                                                                        12
LIQUIDITY
The Company is well capitalised

At 31 December 2020 the Company:

-    remained lowly levered, with an LTV of 24%

-    had cash reserves of c.£44m

-    had remaining capital commitments of c.£5m across Circus St and Scape Brighton to be funded from equity to use resources
     efficiently

The Company continues to maintain strong long-term borrowing relationships with PGIM and Wells Fargo

                                                                                       Wells Fargo            Wells Fargo
    Loan details                        PGIM 1                 PGIM 2
                                                                                       RCF                    Development Loan
    Principal                           £170m                  £65m                    £45m                   £55m
    Drawn (31.12.20)                    £170m                  £65m                    £15m                   £38m
    Interest rate                       3.01%                  2.82%                   Libor + 185bps         Libor + 310bps
    Final repayment                     30 Sep 24              05 Apr 29               25 Jul 21              21 Dec 21
    LTV/LTC covenant                    60%                    60%                     60%                    65%
    ISCR / debt yield covenant          1.75x                  1.75x                   7.50%                  7.50%

STUDENT                                                                                                                          13
COVID-19 - ACADEMIC YEAR 2020/21
    Pandemic continues to impact the sector
                                                                                           Collected vs budgeted income for AY 2020/21
    and portfolio

Portfolio has faced operational challenges caused by the pandemic                               Budget
-   The Company agreed to a 6-week rent concession for eligible students                        £60.1m
    unable to occupy their rooms during the national lockdown                          £60.0m
-   It now expects to collect c.55-60% of the total annual budgeted income
-   Bookings now at 68% (of which 64% occupied)
-   88% of the first two direct let termly instalments collected
                                                                                       £50.0m
-   Into have paid all rent in relation to the academic year                                     £23.9m
-   WeWork arrears covered by the capped parent guarantee to June 2021

                                                                                       £40.0m
Higher Education sector                                                                                                      Contracted
-   Universities remain open under government guidance
                                                                                                   34%
-   Acceleration of flight to quality of applications due to higher-than-expected A-   £30.0m
    Level results
                                                                                                 £12.4m          £24.9m
-   Increased applications (+12%) and substantial increase in mature students
    (+22%) for next academic year                                                                                  27%
                                                                                       £20.0m                     £6.7m
-   Global mobility expected to improve through vaccination and testing

                                                                                                                                £11.4m
                                                                                                   66%
The Investment Manager remains confident in the long-term prospects of                           £23.8m
                                                                                       £10.0m                       73%             50%
PBSA in and around London                                                                                         £18.2m           £5.7m

-   Structural shortfall remains                                                                                                    50%
-   New supply of PBSA remains low                                                                                                 £5.6m            £0m
                                                                                        £0.0m
-   Investment yields supported by transactional evidence                                          Total        Direct Let    Nominations /         Summer
                                                                                                budgeted                         leases            revenue
                                                                                                 revenue

                                                                                                    Collected        Outstanding           Unlet

    STUDENT                                                                                                                                                  14
ESG

STUDENT   Scape Brighton
GRAVIS RESPONSIBLE INVESTMENT APPROACH
At Gravis we involve ourselves in long-term projects that offer a human dimension,
investing in assets that will be needed by the UK for many years to come

- Our long-term approach enables us to engage with investee        - Allocating time and resources to adhere to our
  companies, borrowers, and property developers and                  Responsible Investment commitments, including training
  operators on matters relating to responsible investment and        staff
  gives us the opportunity to seek to drive change where
  appropriate                                                   - For more info: graviscapital.com/responsible-investment

- We believe that integrating Responsible Investment
  considerations into investment management processes can
  help to create more successful and sustainable businesses
  over the long-term and generate enhanced value for our
  clients and society at large

- Our commitment to Responsible Investment includes:

   - UN Principles for Responsible Investment (“UNPRI”)
     signatory since 2018

   - Aim to operate within the principles set out in the UN
     Global Compact with reference to human rights, labour,
     environment and anti-corruption

   - Aiming to become a signatory to the UK Stewardship
     Code 2020

   - Adhere to the recommendations of the Taskforce for
     Climate-related Financial Disclosures (TCFD)
STUDENT                                                                                                                       16
GCP STUDENT ESG APPROACH
GCP Student's ESG policies and credentials

                   The Global Real Estate Sustainability Benchmark provides comparable and reliable data on the ESG performance of
                   investments. Under its 2020 submission the Company achieved:
                   • 2 ‘Green Stars’ on its Real Estate Assessment and a score of 62
                   • Public Disclosure score of 63, ranking 4th out of 8 in the UK residential category
                   A gap analysis exercise is underway to improve the score for 2021

                   An MSCI ESG Rating is designed to measure a company's resilience to long-term, industry material ESG risks.
                   • The Company has an ‘A’ MSCI ESG rating

                   The European Real Estate Association (EPRA) Best Practice Recommendations on Sustainability Reporting (sBPR)
                   are intended to raise the standards and consistency of sustainability reporting for listed real estate companies across
                   Europe
                   • The Company has been awarded an EPRA sBPR ‘Silver Award’

                   An Energy Performance Certificate (EPC) is a key measure of an asset’s energy efficiency, and grades the property
                   from A (most efficient) to G (least efficient)
                   • 100% of the portfolio has an EPC rated ‘B’ or above

                   Building Research Establishment Environmental Assessment Method (BREEAM) is a sustainability assessment
                   method that is used to masterplan projects, infrastructure and buildings.
                   • Circus Street, Wembley, Greenwich and Shoreditch are all rated ‘Excellent’. Scape Guildford and Scape Mile End
                      are rated ‘Very Good’
                   • The Investment Manager is exploring obtaining BREEAM In-Use ratings for each of the buildings which are
                      currently unrated

                   GCP Student has set a long term target of a 0.5% per annum like-for-like reduction in energy consumption (electricity
                   and natural gas kWh), water consumption (m3), and general waste (kg) production from a baseline of 2018 to 2021.

STUDENT                                                                                                                                      17
UK student accommodation market

STUDENT
UCAS UPDATE
January applicant data shows strong growth in students looking to start in September
2021

On 18 February UCAS published their January deadline
                                                                                              Growth in student acceptances
application statistics for the 2021/22 cycle.
                                                                        200%                        Non EU
                                                                        190%                        EU (excluding UK)
Total undergraduate applications are up 8%, with EU applications        180%                        UK
down 40%, domestic students up 12% and non-EU international             170%                        International
students up 17%                                                         160%
                                                                        150%
                                                                        140%
Some of the key highlights are:                                         130%
                                                                        120%
-   Chinese students up 21% from 21,250 to 25,810;                      110%
                                                                        100%
-   Indian students up 33%, from 6,230 to 7,820;

                                                                                                                                                                           2019
                                                                               2006

                                                                                      2007

                                                                                             2008

                                                                                                    2009

                                                                                                           2010

                                                                                                                  2011

                                                                                                                         2012

                                                                                                                                2013

                                                                                                                                        2014

                                                                                                                                               2015

                                                                                                                                                      2016

                                                                                                                                                             2017

                                                                                                                                                                    2018

                                                                                                                                                                                  2020
-   American students up 61% from 4,140 to 6,670;
-   Irish students up 26% from 3,850 to 4,850
-   Mature students (21+ years old) of all nationalities up 21%, from                               Student acceptence rates
    89,580 to 107,970;                                                  800,000
-   Nursing applications increased by 32% to 60,130.
                                                                        700,000
                                                                        600,000
On 4 February UCAS published their end of cycle acceptance
                                                                        500,000
data for 2020/21 academic year:
                                                                        400,000
    Accepted                                                            300,000
                          2018        2019       2020           %
    students
                                                                        200,000
    UK                 459,285     464,335    485,400          5%
                                                                        100,000
    EU (excl UK)        31,855      31,765     32,320          2%               0
    Non EU              42,220      45,140     52,755         17%                       15/16          16/17             17/18          18/19           19/20          20/21

    Total              533,360     541,240    570,475          5%                                          Accepted                    Unplaced

Source: UCAS
STUDENT                                                                                                                                                                                  19
APPLICATION TRENDS
Accelerated divergence in university                                                                    Change in student applications by
application rates                                                                                       ranking of UK universities
                                                                                                        (2012-2020)

                                                                                                        60%
For the 2020/21 UCAS cycle, Higher Tariff providers had a 13%
increase in acceptances vs a 1% increase for lower tariff                                                                                                                             % change from
                                                                                                        50%
institutions                                                                                                                                                                         2012 to 2020

                                                                                                        40%

                                                                     Change in number of applications
In 2012, the government raised tuition fees to a maximum of
£9,000 per year, and in 2015 the cap on the number of                                                                                                                                 % change from
                                                                                                        30%                                                                          2012 to 2019
undergraduate students was removed
                                                                                                        20%
With a university education costing more, it may be that an
increasing number of students are viewing their choice in                                               10%
financial terms with expected future earnings an important factor
                                                                                                         0%
The top ranked universities have benefitted most from this shift,
whereas the lower ranked institutions have seen their number of                               -10%
applicants fall
                                                                                              -20%
This has enabled the top universities to accept more students
whilst maintaining their academic requirements                                                -30%

London has six of the top 40 universities, and Bristol (15 th) and                            -40%
Sussex (25th) support the Company’s regional properties

                                                                                                              1-10

                                                                                                                     11-20

                                                                                                                             21-30

                                                                                                                                     31-40

                                                                                                                                             41-50

                                                                                                                                                     51-60

                                                                                                                                                             61-70

                                                                                                                                                                     71-80

                                                                                                                                                                             81-90

                                                                                                                                                                                     91-100

                                                                                                                                                                                              101-110

                                                                                                                                                                                                        111-120

                                                                                                                                                                                                                  121-130
The number of UK 18 year olds will increase each year for the
next 10 years, supporting further growth in demand for places at                                                                         University ranking
highly ranked institutions

STUDENT                                                              Sources: UCAS, Complete University Guide                                                                                                               20
UK STUDENT INVESTMENT MARKET
Portfolio valuations supported by                                        Notable recent transactions
transactional activity

                                                                                                                                                   Estimated
                                                                  Transaction                        Location             Beds        Value
                                                                                                                                                      yield*
Background
                                                                  KKR Portfolio                      National          2,163          £291m              4.75%
-    Student accommodation is an institutional asset class        Scape Canalside                    Mile End              412        £106m              4.20%
     attracting sophisticated capital
                                                                  Scape Guildford 2                 Guildford              403         £80m              5.10%

-    Record c.£6bn of student assets traded in 2020               Canto Court                      Shoreditch              164         £70m              3.90%

                                                                  Ravenscourt House               Hammersmith              235         £72m              4.15%
-    c.£1.1bn of assets have traded since September 2020
                                                                  Thomas St                             Bristol            357         £57m              4.25%
Post lockdown notable transactions                                iQ**                               National        28,000       £4.7bn                 4.00%

                                                                  Student Castle                     Regional          2,400          £448m              5.10%
-    Greystar have acquired a 5 asset portfolio from KKR/
     Roundhill across London, Bristol, Glasgow & Coventry

-    Realstar have sold an 8 asset BTR and PBSA portfolio                                                    -

-    Scape Canalside and Scape Guildford II acquired by
     an institutional buyer
                                                                5 year
-    Two student schemes at Bermondsey Spa Gardens             average                                                -
                                                                                                                                                        £6.0bn
                                                                £4.3bn                                     £5.7bn
     are being forward funded separately by Curlew Capital                         -                                                           £5.2bn

     and Barings                                                                           -                                 £4.1bn
                                                                                                    -               £3.2bn            £3.2bn
                                                                                £2.7bn
-    Print Hall and Unity Street in Bristol were acquired by              -              £2.0bn
                                                                                                  £1.7bn
     GSA for £58m reflecting a 4.90% yield                            £1.0bn

                                                                      2011 2012 2013 2014 2015 2016 2017 2018 2019 2020
                                                                         Source: JLL
Source: Knight Frank

STUDENT                                                           * Investment manager’s belief                                                                  21
                                                                  ** NOI Yield
Conclusion

STUDENT                   22
             Scape Shoreditch
PORTFOLIO FUNDAMENTALS
The investment manager remains confident of the portfolio’s long-term prospects

 LONDON WEIGHTING               ON CAMPUS                    STUDIO CENTRIC

 80% weighting towards London   All assets are either on-    Portfolio is 80% weighted
                                campus or are within a 10-   towards studios
 London is a global centre of   minute walk to a HEI
 academic excellence with 5                                  Enables effective social
 Russell Group universities     Reduces the need to use      distancing within the
                                public transport to attend   buildings
 Assets benefit from strong     seminars and tutorials
 alternative use values

STUDENT                                                                                  23
CONCLUSION
                      The Investment Manager is confident
                      of the long-term prospects of PBSA

                  -   Covid-19 lockdown and travel restrictions are impacting
                      the Company and uncertainty remains for the rest of the
                      20/21 academic year

                  -   Focussed on the safety and wellbeing of students and
                      staff

                  -   The Company is well positioned with low leverage and
                      significant cash reserves

                  -   Investment yields supported by transactional evidence

                  -   Demand for education in and around London expected to
                      be resilient in the long-term; supply will remain
                      constrained

                  -   The portfolio consists of high-quality, well located assets,
                      in markets that benefit from presence of leading
                      educational institutions

Scape Greenwich                                                                      24
CONTACT INFORMATION

 Nick Barker
 nick.barker@graviscapital.com
 020 3405 8521

 Joe McDonagh
 joe.mcdonagh@graviscapital.com
 020 3405 8523

                                  Gravis Capital Management Limited
                                  24 Savile Row
                                  London, W1S 2ES
                                  www.graviscapital.com

STUDENT
Appendices

STUDENT
INVESTMENT OBJECTIVES
The Company targets attractive total returns in the longer term

 TOTAL RETURN                    PORTFOLIO           QUALITY                                       DIVERSIFICATION

 To generate attractive total    Focus on modern, private                                          The Company invests and
 returns in the longer term.     student residential                                               manages its assets with the
                                 accommodation primarily in                                        objective of spreading risk.
                                 and around London.

 3.50p                           2.6%                                                              4,116
 Dividends declared in respect   Like for like student rental                                      Number of beds
 of the year                     growth for 2020/21

 12.1%                           68%                                                               11
 Annualised NAV total return     Bookings for 2020/21                                              Number of assets
 since IPO
                                  1.   Dividends relate to 12 months ended 31 December 2020
STUDENT                           2.   Total return relates to the period from 20 May 2013 to 31 December 2020                    27
COMPANY HIGHLIGHTS – AT A GLANCE
The Company has increased NAV and income since IPO while reducing its cost of debt

                                                                  220p
 7p                                                                                                                                                  6.00%                                                                           50%
                                           6.15p 6.15p            210p                     Ordinary share price
                                   5.95p
 6p   5.50p 5.60p
                  5.66p 5.75p                                     200p                     EPRA NAV                                                  5.00%
                                                                  190p                                                                                                                                                               40%
 5p                                                               180p
                                                                                                                                                     4.00%
                                                                  170p                                                                                                                                                               30%
 4p                                                               160p
                                                                                                                                                     3.00%
                                                                  150p
 3p                                                                                                                                                                                                                                  20%
                                                                  140p
                                                                  130p                                                                               2.00%
 2p                                                                                                                                                                                              Cost of debt
                                                                  120p                                                                                                                                                               10%
 1p                                                               110p                                                                               1.00%                                       LTV
                                                          0.50p
                                                                  100p
 0p                                                                90p                                                                               0.00%                                                                           0%
       2014

              2015

                     2016

                            2017

                                    2018

                                            2019

                                                   2020

                                                           2021

                                                                                                                                                             Dec 13

                                                                                                                                                                      Dec 14

                                                                                                                                                                               Dec 15

                                                                                                                                                                                        Dec 16

                                                                                                                                                                                                 Dec 17

                                                                                                                                                                                                          Dec 18

                                                                                                                                                                                                                   Dec 19

                                                                                                                                                                                                                            Dec 20
                                                                         Dec 13

                                                                                  Dec 14

                                                                                            Dec 15

                                                                                                        Dec 16

                                                                                                                 Dec 17

                                                                                                                          Dec 18

                                                                                                                                   Dec 19

                                                                                                                                            Dec 20
  The Company historically                                                NAV per share has increased                                                   LTV of 24% against long
  increased its dividends in                                              from 97p at IPO to 171.38p                                                    term target of
  line with inflation since                                               at 31 December 2020                                                           approximately 30%
  IPO
                                                                          Annualised NAV total return                                                   Blended interest rate on
  Impact of Covid-19 pandemic                                             since IPO of 12.1% (share                                                     current borrowings is
  has resulted in a reduction                                             price 9.1%)                                                                   2.93%; 2025 weighted
  to the Company’s dividend                                                                                                                             average maturity

                                                                                                     Share price data relates to the period from 20 May 2013 to 1 March 2021
STUDENT                                                                                                                                                                                                                                    28
PORTFOLIO DEMOGRAPHICS
The portfolio has a diverse student mix

                                      #1   British              #1   Royal Holloway
                                      #2   Chinese              #2   UCL
                                      #3   Indian               #3   QMUL
                                      #4   French               #4   Sussex
Level of study                        #5   American             #5   Brighton
Undergraduate   Postgraduate          Top five nationalities    Top five higher

72%             28%                                             education institutions
                                                                attended by residents

Nationality                           Number of nationalities   Number of higher
                                                                education institutions
Int.            U.K.           E.U.

58%             27%            15%    118                       78

STUDENT                                                                                  29
You can also read