Half Year Results July 2021 - Greencoat UK Wind
←
→
Page content transcription
If your browser does not render page correctly, please read the page content below
Half Year Results
July 2021

                    For Professional Investors Only
H1 2021 Highlights

                                                                                                      £103.6m
Strong cash generation                                                                           Net cash generation

                                                                                                     1,476GWh
Power generation 20% below budget due to low wind resource                                        Power generation

                                                                                                    £68.45/MWh
High power prices                                                                                Average power price

                                                                                             £70.9m / 3.59p per share
Dividend in line with FY target and dividend cover of 1.5x                           Dividends declared with respect to the period

                                                                                                      1,209MW
£48m investment made in the remaining 50% of Braes of Doune (36MW)                               Generating capacity

                                                                                                       45MW
£16m invested into Douglas West with final commissioning in September                   Generating capacity coming on stream

                                                                                                  129.5MW / £161.6m
Windy Rig, Twentyshilling and Glen Kyllachy will complete on commissioning in H2     Additional generating capacity committed in 2021

                                                                                                         28%
£940m total debt (£700m longer term fixed rate debt + £240m drawn under £400m RCF)
                                                                                             Gearing (percentage of GAV)

                                                                                           £2,474.1m / 125.2p per share
NAV increased by 3.0p                                                                              Net Asset Value

                                                                                                       £2.5bn
Market capitalisation                                                                            Market capitalisation

                                 Continued delivery of simple, low risk and proven strategy
                                                                                                                                     2
 Note: all numbers to or at 30 June 2021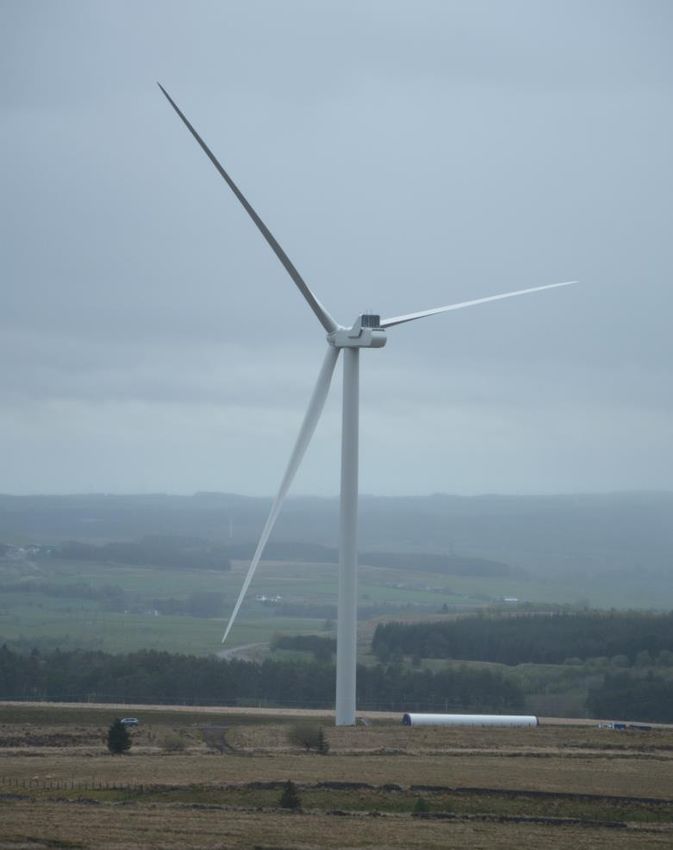
Simple Model

                                                       6-38(1) wind     Generating capacity increased
                                                          farms       from 127 to 1,209MW(1) since IPO
                       Total reinvestment

Equity

                                                          12.8TWh          Total power produced

 Debt
                                                          £725.2m           Total cash generated

                                £195.7m

                                                                       £529.5m Total dividends paid or declared

                      “6p dividend, increasing with RPI inflation and real NAV preservation’’
Note: from IPO to 30 June 2021; (1) Douglas West not included                                                 3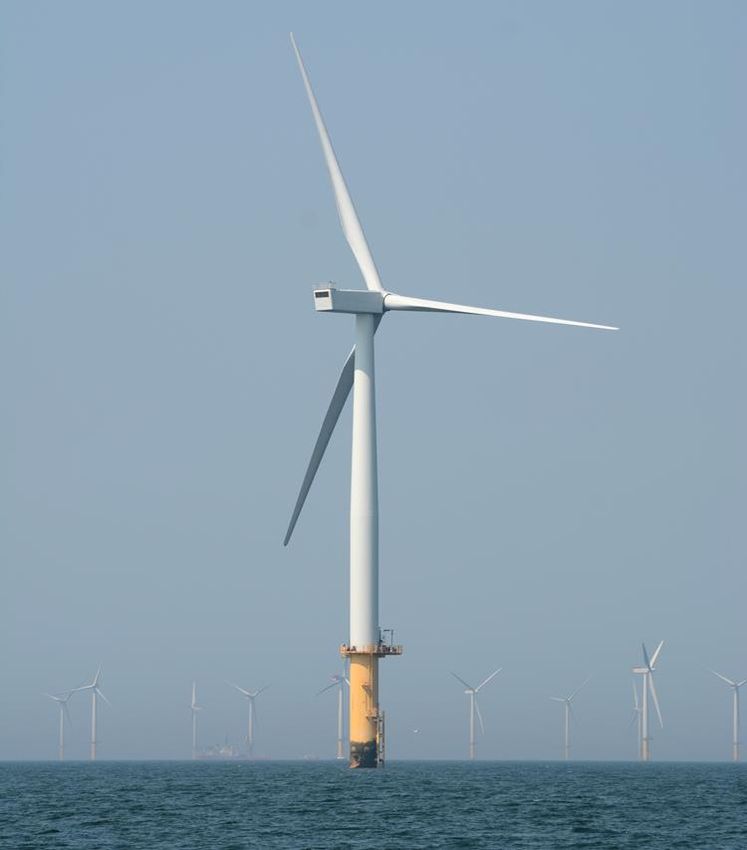
Operational and
Financial Performance
Financial Performance

                        5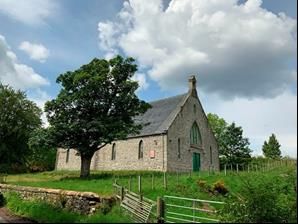
Net Asset Value

                  The increase in the portfolio
                  valuation of £14.9m (1p per share)
                  comprised:
                  ▪ +4p from an increase in forward
                     power prices over the period
                     2021-2024
                  ▪ -2p from an increase in the
                     modelled corporation tax rate over
                     the medium term
                  ▪ -1p other

                                                   6
Power Price

Demand                                                            Supply
Energy efficiency                                                            Demand in China and India
                                                                   Gas                                             60p/th = £40/MWh
Electric vehicles                                                            Cost of extraction
Electrification of heat

                                                                   Carbon    Focus on climate change               £60/t = £25/MWh
Absolute level of demand not
important in the long term
Generation mix will be the same                                              Network charges
                                                                   Other                                                   £5/MWh
Economics and policy driven                                                  Ramping, opportunity cost
                                                                                                                          £70/MWh
Evolving generation mix                                            GB power price profile (before PPA discounts)
 Generation mix              2021                  2050

 Wind                         23%                  46%

 Solar                        4%                    9%

 Nuclear                      19%                  26%

 Gas                          35%                   8%

 Other                        19%                  11%

Now: price is set by marginal generator (gas)
Future: price will also be set by marginal buyer (electrolysis)

                                    Power price is the largest driver of risk and reward
                                                                                                                                  7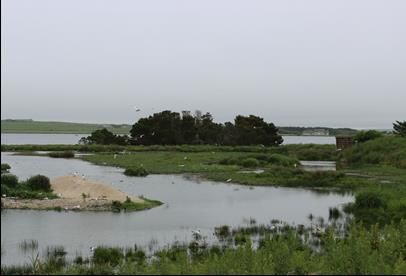
Net Asset Value Since IPO

                      “6p dividend, increasing with RPI inflation and real NAV preservation’’
                                                                                                8
Note: (1) per share and adjusted for accrued dividends
Investment Performance
Strong, consistent return with correlation to inflation
9Portfolio and Acquisitions
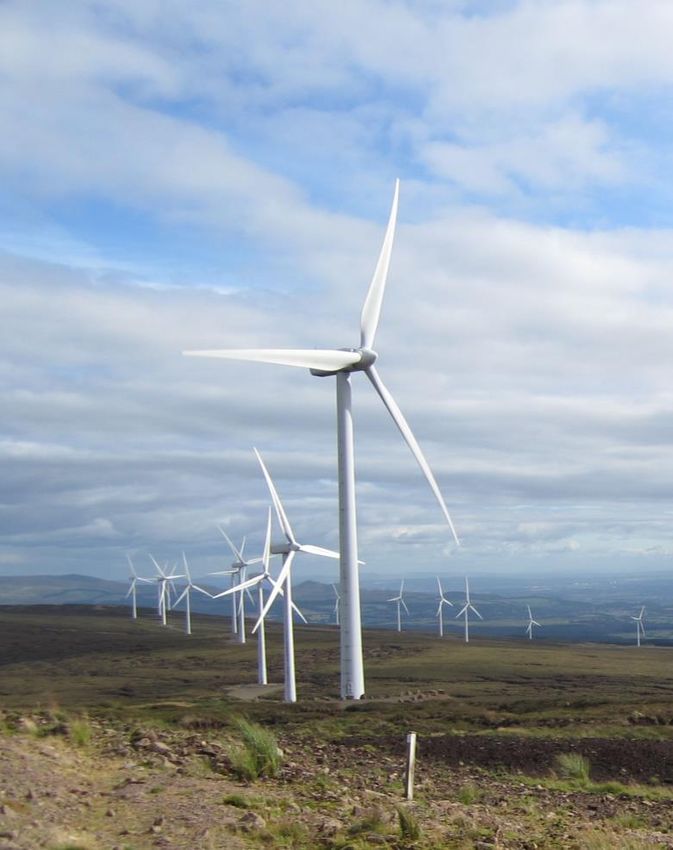
Portfolio Overview

            Generating sufficient electricity to power 1.3 million homes
                                                                           11
Portfolio Overview
Well diversified generating portfolio of 1,209MW – 5% market share
Note: breakdown by value as at 30 June 2021 12Braes of Doune
Seller ▪ Hermes
Capacity ▪ 72MW
Turbines ▪ 36 x Vestas V80 2MW
Commercial Operations Date ▪ June 2007
PPA ▪ Centrica to June 2022
Turbine O&M ▪ Vestas
O&M Management ▪ DNV-GL
▪ Part of IPO seed portfolio
▪ Restricted from purchasing Centrica’s 50% due to single
investment limits at the time
▪ Hermes selling at end of fund life in bilateral transaction
▪ 8 years of operating track record under UKW ownership
Increased from 50% to 100% of wind farm owned since IPO
13Douglas West
Seller ▪ Blue Energy
Capacity ▪ 45MW
Turbines ▪ 13 x Vestas V136 3.6MW
Commercial Operations Date ▪ September 2021
PPA ▪ Erova
Turbine O&M ▪ Vestas
O&M Management ▪ Natural Power
▪ Bilateral transaction for 100% ownership
▪ Construction has taken place over the last 18 months,
managed by Natural Power
▪ First power exported in July 2021
▪ Final commissioning in September 2021
First subsidy free project to enter UKW portfolio
14Investments and Commitments in 2021
Wind Farm Seller Net MW Investment Comment
Investments
Braes of Doune Hermes 36 £48m Bilateral purchase of remaining 50%
Douglas West Blue Energy 45 £16m from cashflow COD in Sep 2021
Commitments
Windy Rig Statkraft 43.2 £53m Acquire on COD in Sep 2021
Twentyshilling Statkraft 37.5 £51m Acquire on COD in Oct 2021
Glen Kyllachy RWE 48.5 £58m Acquire on COD in Nov 2021
£162m of committed investments in H2 matched by available RCF commitments
15Secondary Market - Continued Opportunities to Grow
UKW net generating capacity (MW) 1,209MW
1200
1000
800
600
400
200 127MW
0
30000 £70bn market
25000
20000
15000 UK offshore capacity (MW)
£20bn market
10000
5000
UK onshore capacity (MW)
0
Mar-13
Jun-13
Sep-13
Dec-13
Mar-14
Jun-14
Sep-14
Dec-14
Mar-15
Jun-15
Sep-15
Dec-15
Mar-16
Jun-16
Sep-16
Dec-16
Mar-17
Jun-17
Sep-17
Dec-17
Mar-18
Jun-18
Sep-18
Dec-18
Mar-19
Jun-19
Sep-19
Dec-19
Mar-20
Jun-20
Sep-20
Dec-20
Mar-21
Jun-21
UKW owns a small portion of the operating UK wind market
16ESG
Environmental, Social and Governance
▪ Portfolio produces enough renewable electricity to power 1.3 million homes
▪ Recycling of capital enabling more renewable generation capacity to be built out
Environmental ▪ 1.5m tonnes of CO2 per annum will be avoided compared to thermal generation
▪ Co-existence of energy generation alongside livestock and arable farming
▪ Designed to minimise impact on local terrestrial, aquatic and aerial wildlife
▪ £3.8m of local community funding in 2020
▪ Significant number of jobs in rural communities
Social ▪ Local school and other educational visits
▪ Board reviews health and safety at each scheduled board meeting
▪ Independent health and safety consultant engaged
▪ Independent board approves all acquisitions
▪ UKW’s domicile enables UKW to appoint directors with expertise and experience covering all
Governance key UKW activities from unrestricted pool
▪ Gender diversity: 60% female representation on board (including chairman) and ~30% in
investment manager
100% renewable generator
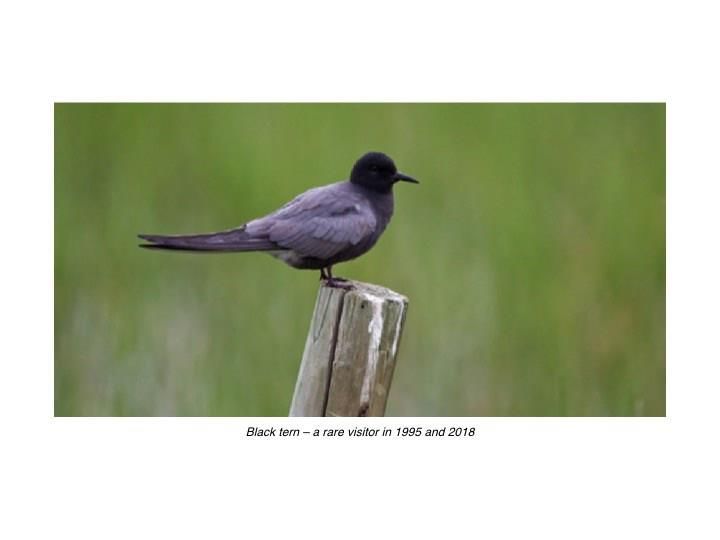
18ESG Case Study – Stroupster
St. John’s Pool Bird Reserve, Dunnet Head, Caithness
▪ Provides a safe sanctuary for breeding, wintering
and migrant birds (over 200 species)
Grant of £43,600 to:
▪ Improve access for all-ability visitors
▪ Increase safe breeding areas for terns
▪ Enhance biodiversity
▪ Increase understanding and appreciation
amongst residents and visitors
“In addition to St. John’s Pool providing a safe breeding colony for these
four seabirds of conservation concern, it allows people to experience this
spectacle in a way that we have never seen elsewhere. The plan to re-
build the car park and create an all-ability access path to the main hide is
therefore particularly valuable to ensure that this amazing spectacle is
accessible to people who use wheelchairs or have reduced mobility”(1)
Note: (1) Joint letter from a Seabird Ecologist and a Conservation Scientist at the Environmental Research Institute 19ESG Case Study – Corriegarth
Errogie Free Church, Dores, Inverness
▪ Contribution of £92,300 to purchase,
renovate and convert the church into a
multi-use community meeting place
▪ Public consultation has identified more
than 50 activities that the building
could house including painting, a gym
and dance studio, music, courses in
photography and crafts
▪ The building is expected to open by the
end of 2022
20Summary
H1 2021 Highlights

                                                                                                      £103.6m
Strong cash generation                                                                           Net cash generation

                                                                                                     1,476GWh
Power generation 20% below budget due to low wind resource                                        Power generation

                                                                                                    £68.45/MWh
High power prices                                                                                Average power price

                                                                                             £70.9m / 3.59p per share
Dividend in line with FY target and dividend cover of 1.5x                           Dividends declared with respect to the period

                                                                                                      1,209MW
£48m investment made in the remaining 50% of Braes of Doune (36MW)                               Generating capacity

                                                                                                       45MW
£16m invested into Douglas West with final commissioning in September                   Generating capacity coming on stream

                                                                                                  129.5MW / £161.6m
Windy Rig, Twentyshilling and Glen Kyllachy will complete on commissioning in H2     Additional generating capacity committed in 2021

                                                                                                         28%
£940m total debt (£700m longer term fixed rate debt + £240m drawn under £400m RCF)
                                                                                             Gearing (percentage of GAV)

                                                                                           £2,474.1m / 125.2p per share
NAV increased by 3.0p                                                                              Net Asset Value

                                                                                                       £2.5bn
Market capitalisation                                                                            Market capitalisation

                                 Continued delivery of simple, low risk and proven strategy
                                                                                                                                     22
 Note: all numbers to or at 30 June 2021
Appendix
Greencoat UK Wind

            ▪   Greencoat UK Wind acquires and operates UK wind farms. The cash generated by these
                assets is used primarily to pay a robust, premium dividend to shareholders. The
  Simple        remainder is reinvested to ensure capital is preserved in real terms.
            ▪   Simple structure, UK domiciled with a strong independent board, wind only (the most
                mature renewable technology), sterling only.

            ▪   UKW was designed to be structurally low risk: operating assets and low gearing for cash
                flow stability and tolerance to sensitivities including power price.
 Low Risk
            ▪   Wind and production variability is low, and within one standard deviation in all but one
                year since listing.

            ▪   Greencoat UK Wind is over 8 years old, and over this period has delivered on its
                investment proposition: 6p dividend increasing with RPI inflation (7.18p target for 2021)
                and real NAV preservation.
  Proven
            ▪   Ability to acquire assets at value accretive prices, and then to operate with the
                knowledge and expertise of the most experienced team in the UK listed renewables
                sector.

                     Designed for investors from first principles
                                                                                                           24
Diversified Asset Portfolio (1)
Group Acquisition
Total Commercial ROCs / Forecast Net Load
Wind Farm Country Turbines PPA Ownership Net MW(1)
MW Operations Date Date MWh Factor(2)
Stake
Bicker Fen England Senvion EDF 26.7 80% 21.3 Sep-08 Oct-17 1.0 23.8%
Bin Mountain N Ireland GE SSE 9.0 100% 9.0 Jul-07 Mar-13 1.0 31.3%
Bishopthorpe England Senvion Axpo 16.4 100% 16.4 May-17 Jun-17 0.9 35.6%
Braes of Doune Scotland Vestas Centrica 72.0 100% 72.0 Jun-07 Mar-13(3) 1.0 26.9%
Brockaghboy N Ireland Nordex SSE 47.5 100% 47.5 Feb-18 Mar-18 0.9 39.8%
Carcant Scotland Siemens Axpo 6.0 100% 6.0 Jun-10 Mar-13 1.0 32.9%
Church Hill N Ireland Enercon Energia 18.4 100% 18.4 Jul-12 Dec-18 1.0 24.5%
Clyde Scotland Siemens SSE 522.4 28.2% 147.3 Oct-12(4) Mar-16(4) 1.0(3) 35.7%
Corriegarth Scotland Enercon Centrica 69.5 100% 69.5 Apr-17 Aug-17 0.9 35.9%
Cotton Farm England Senvion Sainsbury’s 16.4 100% 16.4 Mar-13 Oct-13 1.0 35.9%
Notes: (1) Net MW represents the Group ownership stake in the total MW capacity of the underlying wind farm; (2) Forecast net load factor is the expected output of the wind farm
divided by the theoretical maximum output over a calendar year (as a %). Forecast net load factors are net of each wind farm’s availability assumption. Forecast net load factors
are P50 estimates (50% probability of output exceeding estimate) based on operational data (>1 year of operations) or modelled assumptions (Diversified Asset Portfolio (2)
Group Acquisition
Total Commercial ROCs / Forecast Net Load
Wind Farm Country Turbines PPA Ownership Net MW(1)
MW Operations Date Date MWh Factor(2)
Stake
Crighshane N Ireland Enercon Energia 32.2 100% 32.2 Jul-12 Dec-18 1.0 22.6%
Deeping St
England Senvion EDF 16.4 80% 13.1 Jun-06 Oct-17 1.0 26.0%
Nicholas
Drone Hill Scotland Nordex Statkraft 28.6 51.6% 14.8 Aug-12 Aug-14 1.0 23.7%
Dunmaglass Scotland GE SSE 94.0 35.5% 33.4 Dec-17 Mar-19 0.9 44.9%
Earl’s Hall Farm England Senvion Sainsbury’s 10.3 100% 10.3 Mar-13 Oct-13 1.0 35.9%
Glass Moor England Senvion EDF 16.4 80% 13.1 Jun-06 Oct-17 1.0 25.3%
Humber Gateway England Vestas RWE 219 37.8% 82.8 Jun-15 Dec-20 2.0 44.6%
Kildrummy Scotland Enercon Sainsbury’s 18.4 100% 18.4 May-13 Jun-14 1.0 34.8%
Langhope Rig Scotland GE Centrica 16.0 100% 16.0 Dec-15 Mar-17 0.9 33.6%
Lindhurst England Vestas RWE 9.0 49% 4.4 Oct-10 Nov-13 1.0 30.1%
Notes: (1) Net MW represents the Group ownership stake in the total MW capacity of the underlying wind farm; (2) Forecast net load factor is the expected output of the wind farm
divided by the theoretical maximum output over a calendar year (as a %). Forecast net load factors are net of each wind farm’s availability assumption. Forecast net load factors
are P50 estimates (50% probability of output exceeding estimate) based on operational data (>1 year of operations) or modelled assumptions (Diversified Asset Portfolio (3)
Group Acquisition
Total Commercial ROCs / Forecast Net Load
Wind Farm Country Turbines PPA Ownership Net MW(1)
MW Operations Date Date MWh Factor(2)
Stake
Little Cheyne
England Nordex RWE 59.8 41% 24.5 Mar-09 Mar-13 1.0 28.7%
Court
Maerdy Wales Siemens Statkraft 24.0 100% 24.0 Aug-13 Jun-14 1.0 30.3%
Middlemoor England Vestas RWE 54.0 49% 26.5 Sep-13 Nov-13 1.0 29.8%
North Hoyle Wales Vestas Erova 60.0 100% 60.0 Jun-04 Sep-17 1.0 35.3%
North Rhins Scotland Vestas EoN 22.0 51.6% 11.4 Dec-09 Aug-14 1.0 38.4%
Red House England Senvion EDF 12.3 80% 9.8 Jun-06 Oct-17 1.0 25.5%
Red Tile England Senvion EDF 24.6 80% 19.7 Apr-07 Oct-17 1.0 24.6%
Rhyl Flats Wales Siemens RWE 90.0 24.95% 22.5 Jul-09 Mar-13 1.5 35.7%
Screggagh N Ireland Nordex Energia 20.0 100% 20.0 May-11 Jun-16 1.0 27.0%
Sixpenny Wood England Senvion Statkraft 20.5 51.6% 10.6 Jul-13 Aug-14 1.0 31.1%
Notes: (1) Net MW represents the Group ownership stake in the total MW capacity of the underlying wind farm; (2) Forecast net load factor is the expected output of the wind farm
divided by the theoretical maximum output over a calendar year (as a %). Forecast net load factors are net of each wind farm’s availability assumption. Forecast net load factors
are P50 estimates (50% probability of output exceeding estimate) based on operational data (>1 year of operations) or modelled assumptions (Diversified Asset Portfolio (4)
Group Acquisition
Total Commercial ROCs / Forecast Net Load
Wind Farm Country Turbines PPA Ownership Net MW(1)
MW Operations Date Date MWh Factor(2)
Stake
Slieve Divena N Ireland Nordex SSE 30 100% 30 Mar-09 Aug-17 1.0 22.1%
Slieve Divena II N Ireland Enercon SSE 18.8 100% 18.8 Jun-17 Feb-20 0.9 31.5%
Stronelairg Scotland Vestas SSE 227.7 35.5% 80.9 Dec-18 Mar-19 0.9 43.1%
Stroupster Scotland Enercon BT 29.9 100% 29.9 Oct-15 Nov-15 0.9 36.6%
Tappaghan N Ireland GE SSE 28.5 100% 28.5 Jan-05(3) Mar-13 1.0 29.0%
75% plus
Tom nan Clach Scotland Vestas CFD 39.1 29.3 May-19 Jun-19 CFD 47.2%
debt
Walney England Siemens SSE 367.2 25.1% 92.2 Jul-11/Jun-12 Sep-20 2.0 44.0%
Yelvertoft England Senvion Statkraft 16.4 51.6% 8.5 Jul-13 Aug-14 1.0 29.4%
Total 1,209.2
Notes: (1) Net MW represents the Group ownership stake in the total MW capacity of the underlying wind farm; (2) Forecast net load factor is the expected output of the wind farm
divided by the theoretical maximum output over a calendar year (as a %). Forecast net load factors are net of each wind farm’s availability assumption. Forecast net load factors
are P50 estimates (50% probability of output exceeding estimate) based on operational data (>1 year of operations) or modelled assumptions (NAV Sensitivities
29Disclaimer (1)
Important Information
This presentation and its contents are confidential.
NOT FOR RELEASE, PUBLICATION OR DISTRIBUTION, DIRECTLY OR INDIRECTLY, IN OR INTO, THE UNITED STATES (OR TO ANY US PERSON), AUSTRALIA, NEW ZEALAND, THE REPUBLIC OF SOUTH AFRICA, CANADA,
JAPAN, ANY MEMBER STATE OF THE EUROPEAN ECONOMIC AREA AND THE UK (OTHER THAN TO PROFESSIONAL INVESTORS IN THE UK, AND TO PROFESSIONAL INVESTORS IN THE REPUBLIC OF IRELAND,
SWEDEN AND THE NETHERLANDS) OR ANY OTHER JURISDICTION WHERE TO DO SO MIGHT CONSTITUTE A VIOLATION OF THE RELEVANT LAWS OR REGULATIONS OF SUCH JURISDICTION.
This presentation does not constitute an offer of securities in the United States or any other jurisdiction. Securities may not be offered or sold directly or indirectly in or into the United States or to, or for the
account or benefit of, any US persons (within the meaning of Regulation S under the US Securities Act (“Regulation S”)) (a “US Person”), except pursuant to an exemption from the registration requirements of
the US Securities Act of 1933, as amended (the “US Securities Act”) for offers and sales of securities that do not involve any public offering contained in Section 4(a)(2) of the US Securities Act and analogous
exemptions under state securities laws. In particular investors should note that the new ordinary shares have not been and will not be registered under the US Securities Act or with any securities regulatory
authority of any state or other jurisdiction of the United States and the Company has not registered, and does not intend to register, as an investment company under the US Investment Company Act of 1940,
as amended (the “US Investment Company Act”). The new ordinary are being offered only to (i) US Persons who are qualified institutional buyers, as defined in Rule 144A under the US Securities Act, and
qualified purchasers, as defined in Section 2(a)(51) of the US Investment Company Act and (ii) investors who are not US Persons outside of the United States in “offshore transactions” as defined in and
pursuant to Regulation S under the US Securities Act. Neither Greencoat Capital nor UKW intend to register any portion of the offering in the United States or conduct a public offering of securities in the
United States.
This document and any offer if made subsequently is subject to the Alternative Investment Fund Managers Directive ("AIFMD") as implemented by Member States of the European Economic Area. This
presentation and any offer if made subsequently is directed only at professional investors in the Republic of Ireland and to qualified investors in Sweden and the Netherlands (as defined in article 1:1 of the
Dutch Act of Financial Supervision) (the "Eligible Member States"). The Investment Manager has not been authorised or has notified of the intention to market under the national private placement regime (or
equivalent) in any other member state (each an "Ineligible Member State"). This presentation may not be distributed in any Ineligible Member State and no offers subsequent to it may be made or accepted in
any Ineligible Member State. The attention of all prospective investors is drawn to disclosures required to be made under the AIFMD which are set out on the Company's website (including as set out in its
most recent prospectus and annual report and accounts), which will also set out (if applicable) any periodic updates required under the rules in the FCA's Handbook (FUND 3.2.5R and 3.2.6R).
This document is intended for distribution only in the United Kingdom and only to (i) persons who have professional experience in matters relating to investments falling within Article 19(5) of the Financial
Services and Markets Act 2000 (Financial Promotion) Order 2005 (as amended) (the “Order”); (ii) high net worth companies, unincorporated associations etc. falling within Article 49(2) of the Order; or (iii)
persons to whom it can otherwise lawfully be distributed (persons meeting such criteria are referred to herein as “Relevant Persons”). It is not directed at and may not be acted or relied on by anyone other
than a Relevant Person and such persons should return this document to Greencoat Capital. By accepting this document and not immediately returning it, you represent that: (i) you are a Relevant Person; and
(ii) you have read, agreed to and will comply with the contents of this notice. The distribution of this document in certain jurisdictions may be restricted and accordingly it is the responsibility of any person
into whose possession this document comes to inform themselves about and observe such restrictions.
This document has not been approved or authorised by the Guernsey Financial Services Commission (the “Commission”) or the States of Guernsey. This document may only be distributed or circulated directly
or indirectly in or from within the Bailiwick of Guernsey, and is being distributed or circulated in or from within the Bailiwick of Guernsey only (i) by persons licensed to do so by the Commission under the
Protection of Investors (Bailiwick of Guernsey) Law, 1987 (as amended) ("POI Law"); or (ii) by non-Guernsey bodies who (A) carry on such promotion in a manner in which they are permitted to carry on
promotion in or from within, and under the law of certain designated countries or territories which, in the opinion of GFSC, afford adequate protection to investors and (B) meet the criteria specified in section
29(c) of the POI Law; or (iii) to persons licensed under the POI Law, the Banking Supervision (Bailiwick of Guernsey) Law, 1994, the Insurance Business (Bailiwick of Guernsey) Law, 2002 or the Regulation of
Fiduciaries, Administration Business and Company Directors etc. (Bailiwick of Guernsey) Law, 2000 by non-Guernsey bodies who (A) carry on such promotion in a manner in which they are permitted to carry
on promotion in or from within, and under the law of certain designated countries or territories which, in the opinion of GFSC, afford adequate protection to investors and (B) meet the criteria specified in
section 29(cc) of the POI Law; or, (iv) as otherwise permitted by the GFSC. This document is not available in or from within the Bailiwick of Guernsey other than in accordance with this paragraph and must not
be relied upon by any person unless received in accordance with this paragraph.
30Disclaimer (2)
Any subsequent offer may only be made in Jersey where the offer is valid in the United Kingdom or Guernsey and is circulated in Jersey only to persons similar to those to whom, and in a manner similar to that
in which, it is for the time being circulated in the United Kingdom or Guernsey as the case may be. Consent under the Control of Borrowing (Jersey) Order 1958 has not been obtained for the circulation of this
document or any subsequent offer made under the presentation and it must be distinctly understood that the Jersey Financial Services Commission does not accept any responsibility for the financial
soundness of or any representations made in connection with the Company. By accepting any subsequent offer (if made) each prospective investor in Jersey represents and warrants that he or she is in
possession of sufficient information to be able to make a reasonable evaluation of the offer.
No action has been or will be taken in Israel that would permit an offering of this investment opportunity or a distribution of this document to the public in Israel and this document shall not be seen as a public
offering as defined under the Israeli Securities Law, 1968 or the Joint Investment Trust Law, 1994. In particular, this document has not been reviewed or approved by the Israel Securities Authority. Accordingly,
the investment opportunity shall only be sold in Israel to investors of the type listed in the First Schedule to the Israel’s Securities Law, 1968 (a "Sophisticated Investor").
Each investor shall be required to warrant, as a condition precedent to purchasing the investment opportunity, that it is a Sophisticated Investor, that it is aware of the implications of being treated as a
Sophisticated Investor, and consents to such treatment. Further, each investor shall be required to warrant, as a condition precedent to purchasing the investment opportunity, that it is acquiring the
investment for its own account and without intent to market, re-sell, or otherwise distribute the investment to any other person.
The Company is not licensed under the Israeli Regulation of Investment Advice, Investment Marketing and Portfolio Management Law, 1995, and this document shall not constitute Investment Advice or
Investment Marketing as defined therein. In making an investment decision, investors must only rely on their own examination of the investment opportunity, including the merits and risks involved, and
should seek advice from appropriate advisors with respect to the legal, accounting, tax and financial ramifications of purchasing the investment.
The offer and marketing of the ordinary shares of the Company in Switzerland will be exclusively made to, and directed at, qualified investors (the “Qualified Investors”), as defined in Article 10(3) of the Swiss
Collective Investment Schemes Act (“CISA”) in conjunction with Article 4(4) of the Swiss Financial Services Act (“FinSA”), i.e. institutional clients, at the exclusion of professional clients with opting-out pursuant
to Article 5(3) FinSA (“Excluded Qualified Investors”). Accordingly, the Company has not been and will not be registered with the Swiss Financial Market Supervisory Authority (“FINMA”) and no representative
or paying agent have been or will be appointed in Switzerland. This document and/or any other offering or marketing materials relating to the Ordinary Shares of the Company may be made available in
Switzerland solely to Qualified Investors, at the exclusion of Excluded Qualified Investors.
The Ordinary Shares may not be publicly offered, directly or indirectly, in Switzerland within the meaning of the FinSA and no application has or will be made to admit the Ordinary Shares to trading on any
trading venue (exchange or multilateral trading facility) in Switzerland. Neither this document nor any other offering or marketing material relating to the Ordinary Shares constitutes a prospectus pursuant to
the FinSA, and neither this document nor any other offering or marketing material relating to the Ordinary Shares may be publicly distributed or otherwise made publicly available in Switzerland.
This presentation and any information made available subsequent hereto is strictly confidential to the addressee(s) and it may not be copied, reproduced, disclosed, distributed or passed on, in whole or in
part, to any other person. This document is supplied for information purposes of the addressee(s) only. This document does not constitute and may not be construed as, an offer to sell or an invitation to
purchase, investments of any description nor the provision of investment advice by any party and no reliance may be placed for any purposes whatsoever on the information (including, without limitation,
illustrative modelling information) contained in this document.
This presentation has been prepared by Greencoat Capital LLP (“Greencoat Capital”). Greencoat Capital is the exclusive investment manager to Greencoat UK Wind PLC (“UKW”). Neither Greencoat Capital nor
UKW or any of their officers, partners, employees, agents, advisers or affiliates makes any express or implied representation, warranty or undertaking with respect to the information nor opinions contained in
this presentation. No liability whatsoever (whether in negligence or otherwise) arising directly or indirectly from the use of this presentation is accepted and no representation, warranty or undertaking,
express or implied, is or will be made by Greencoat Capital or UKW or any of their respective directors, officers, employees, advisers, representatives or other agents for any information or any of the opinions
contained herein or for any errors, omissions or misstatements.
Greencoat Capital, which is authorised and regulated by the UK Financial Conduct Authority, is not acting as adviser to any recipient of this document and will not be responsible to any recipient of this
document for providing the protections afforded to clients of Greencoat Capital nor for providing advice in connection with this presentation or matters referred to herein. All investments are subject to risk,
including the loss of the principal amount invested. Past performance is no guarantee of future returns. The value of shares and the income from them is not guaranteed and can fall as well as rise due to stock
market and currency movements. When you sell your investment you may get back less than you originally invested. You should always seek expert legal, financial, tax and other professional advice before
making any investment decision.
31You can also read