Investor Presentation | Dec. 31, 2020 as of March 2021
←
→
Page content transcription
If your browser does not render page correctly, please read the page content below
Investor Presentation | Dec. 31, 2020 as of March 2021
                                              © 2021 The Joint Corp. All Rights Reserved.   1
Safe Harbor Statement
Certain statements contained in this presentation are "forward-looking statements” about future events and expectations. Forward-looking statements are based on our beliefs, assumptions and
expectations of industry trends, our future financial and operating performance and our growth plans, taking into account the information currently available to us. These statements are not statements of
historical fact. Forward-looking statements involve risks and uncertainties that may cause our actual results to differ materially from the expectations of future results we express or imply in any forward-
looking statements, and you should not place undue reliance on such statements. Factors that could contribute to these differences include, but are not limited to, the continuing impact of the COVID-19
outbreak on the economy and our operations (including temporary clinic closures, shortened business hours and reduced patient demand), our failure to develop or acquire company-owned or managed
clinics as rapidly as we intend, our failure to profitably operate company-owned or managed clinics, and the other factors described in “Risk Factors” in our Annual Report on Form 10-K as filed with the SEC
for the year ended December 31, 2019, as updated or revised for any material changes described in any subsequently-filed Quarterly Reports on Form 10-Q or other SEC filings, and in our Annual Report on
Form 10-K for the year ended December 31, 2020 expected to be filed with the SEC on or around March 5, 2021. Words such as, "anticipates," "believes," "continues," "estimates," "expects," "goal,"
"objectives," "intends," "may," "opportunity," "plans," "potential," "near-term," "long-term," "projections," "assumptions," "projects," "guidance," "forecasts," "outlook," "target," "trends," "should,"
"could," "would," "will," and similar expressions are intended to identify such forward-looking statements. We qualify any forward-looking statements entirely by these cautionary factors. We assume no
obligation to update or revise any forward-looking statements for any reason or to update the reasons actual results could differ materially from those anticipated in these forward-looking statements, even
if new information becomes available in the future. Comparisons of results for current and any prior periods are not intended to express any future trends or indications of future performance, unless
expressed as such, and should only be viewed as historical data.

Business Structure
The Joint Corp. is a franchisor of clinics and an operator of clinics in certain states. In Arkansas, California, Colorado, District of Columbia, Florida, Illinois, Kansas, Kentucky, Maryland, Massachusetts,
Michigan, Minnesota, New Jersey, New York, North Carolina, Oregon, Pennsylvania, Rhode Island, South Dakota, Tennessee, Washington, West Virginia and Wyoming, The Joint Corp. and its franchisees
provide management services to affiliated professional chiropractic practices.

                                                                                                                                                                             © 2021 The Joint Corp. All Rights Reserved.   2
OUR MODEL

Bringing quality, convenient, affordable chiropractic care to retail
                                                                       © 2021 The Joint Corp. All Rights Reserved.   3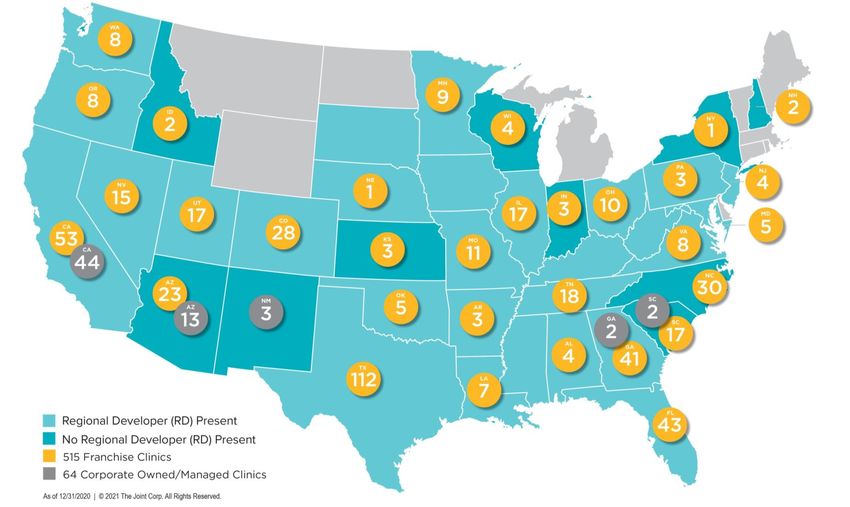
OUR PATIENTS

Serving patients seeking pain relief and ongoing health and wellness
                                                                       © 2021 The Joint Corp. All Rights Reserved.   4
OUR CLINICS

Employing a proven membership-based, walk-in,
no-insurance model in an open bay setting
                                                © 2021 The Joint Corp. All Rights Reserved.   5
Disruptive Business Model Continues to Thrive

1.1M                                 8.3M                             584K                        27%                                   85%
unique patients                          adjustments                    new patients             of new patients           system-wide gross sales
treated in 2020                            in 2020                        in 2020                  were new to                  from monthly
                                                                                               chiropractic1 in 2020        memberships in 2020

Up from 998k in 2019                  Up from 7.7M in 2019          Compared to 585K in 2019    Approx. 158k patients               Up from 80% in 2019
                                                                                                 had never been to a
                                                                                                 chiropractor before

                  1   New patient survey completed February 2021.

                                                                                                                        © 2020 The Joint Corp. All Rights Reserved.   6
Chiropractic Care Is an Essential Healthcare Service

                               •   Critical point of differentiation versus other retailer
                                   service concepts

                               •   Service call for our doctors and staff: Now more than
                                   ever, we must be open to treat our patients

Increased frequency of
                               •   Reassuring patients: Our clinics are open and taking the
messaging through video            necessary safety precautions
and blogs, emails and texts,
clinic signage and PR

                                                                            © 2021 The Joint Corp. All Rights Reserved.   7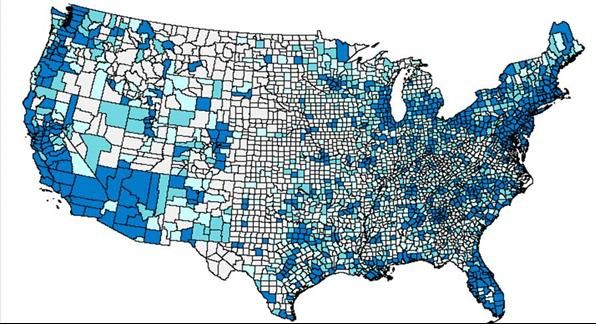
Upside for Future Growth
$16B growing chiropractic market1

                                                                   50%                                30%                                      16%
                                                               of Americans don’t                 understand chiropractic                saw a chiropractor
                                                              know what the word                      but are scared                   in the last 12 months
                                                              “chiropractic” means
                                                                       Gallup-Palmer College of        Nucleus Marketing Lab 2018                     Gallup-Palmer College of
                                                                       Chiropractic Report 2017                                                       Chiropractic Report 2018

             1   IBIS World Chiropractors Market Research Report; February 2019

                                                                                                                                    © 2021 The Joint Corp. All Rights Reserved.   8
Substantial Opportunity for Market Share Growth

                                                        The Joint Chiropractic                                                             Chiropractic Is a Natural Solution
• Annual spending on
                                                             $220M, 1%                                 Other Chains3
  back pain: $90B1                                                                                      $300M, 2%                            • Chiropractic is a part of the first
                                                                                                                                               line of therapy5
• Chiropractic care: $16B2
                                                                                                                                             • Patients who visit a chiropractor
• Total chains make up                                                                                                                         are 49% less likely to receive an
  ~3% of chiropractic3                                                                                                                         opioid prescription6
                                                                                 Independents                                                • Patients who visit a chiropractor
• By contrast, dentistry                                                                                                                       first had 90% decreased odds of
                                                                                  $15.5B, 97%
  chains (DSOs) account                                                                                                                        early and long-term opioid use7
  for nearly 12%4

            1 Bureauof Labor Statistics, U.S. Department of Labor, Occupational Outlook Handbook, 2016-17 Edition; 2 IBIS US Industry Report, Chiropractors in the US, April 2020; 3 Internal Chiropractic
            Competitive Analysis, August 2019; 4 Apex Reimbursement Specialists, Inc.., 2018 5American College of Physicians and Journal of American Medical Association; 6 Yale Center for Medical
            Informatics, presented at American Academy of Pain Medicine’s 2019 Annual Meeting and reported in Medscape Medical News; 7 American Chiropractic Association on low back pain, 2019.

                                                                                                                                                                     © 2021 The Joint Corp. All Rights Reserved.   9
Market Opportunity: 1800+ Potential Clinics
Targeting 1,000 clinics opened by the end of 2023

                                                    The Joint Patient Base
                                                    With usable addresses in last 21 months
                                                    •   All 50 States, DC, and Puerto Rico
                                                    •   All Canadian Provinces and Territories
                                                    •   24 Countries on 6 Continents
                                                    1800+ Similar Points of Distribution
                                                    • Analyze demographics and psychographics
                                                    • Model attributes
 Best
 Good
                                                    • Roll across country
 Fair
 Poor

                                                                            © 2021 The Joint Corp. All Rights Reserved.   10
The Joint: The Industry Leader with Momentum Building
Clinics Clinics Change in Owned/ Private
Companies States Franchise Insurance
at 12/31/20 at 12/31/17 Clinics Managed Pay
The Joint Corp. 579 399 180 33 ✔
️ ✔
️ ✔
️
HealthSource Chiropractic 152 295 (143) 35 ✔️ ✔️
ChiroOne 68 41 27 5 ✔️ ✔️
100% Chiropractic 46 * * 11 ✔️ ✔️ ✔️
AlignLife Chiropractic 28 23 5 10 ✔️ ✔️ ✔️
Chiropractic Company 20 * * 1 ✔️ ✔️
Aligned Modern Health 17 * * 1 ✔️ ✔️
20 Dollar Chiropractic 13 * * 1 ✔️ ✔️
ChiroWay 9 8 1 2 ✔️ ✔️
Chiropractic Partners 8 * * 1 ✔️ ✔️ ✔️
NuSpine 5 3 2 3 ✔️ ✔️
Express Chiropractic 5 0 5 1 ✔️ ✔️
SnapCrack Chiropractic 5 * * 1 ✔️ ✔️
Simply Chiropractic 2 7 (5) 2 ✔️ ✔️
Independent Offices 40,150 39,527 623 50 ✔️ Varies Varies
1 Kentley Insights, The Office of Chiropractors Market Research Report, 2019 and 2017, respectively.
* Historical information unknown.
© 2021 The Joint Corp. All Rights Reserved. 11Franchise Satisfaction Index Is Above Average
58% 65% 75%
The Joint The Joint The Joint
Apr. 2017 Nov. 2018 Oct. 2020
FSI represents a weighted sum of positive responses and discounts negative responses. FSI ratings provide a benchmark to help gauge overall level of franchisee satisfaction and
compare it to various franchise industry sectors.
© 2021 The Joint Corp. All Rights Reserved. 12Driving Growth with Resilient Business Model
Live a Better You
BUILD INCREASE ATTRACT OPEN
BRAND AWARENESS NEW PATIENTS NEW CLINICS
© 2021 The Joint Corp. All Rights Reserved. 13Continuing to Target 1000 Clinics by the End of 2023
2018 2019 2020
Franchise Licenses Sold 99 126 121
Total New Franchised
Clinics Opened
47 71 70
Greenfield Clinics Opened 0 5 3
Franchised Clinics Acquired 1 8 1
Clinics in Development 155 204 253
© 2021 The Joint Corp. All Rights Reserved. 14New Clinic Openings Accelerated in Q3 2020
70 new clinics opened in 2020, compared to 71 in 2019*
579
513 64
TOTAL CLINICS OPEN
Franchise Company Owned/Managed 442 60
399
48
370
47
312 61
47
246
515
4
453
394
352
309
242 265
175
82
12 26
2010 2011 2012 2013 2014 2015 2016 2017 2018 2019 2020
© 2021 The Joint Corp. All Rights Reserved. 15Advancing Robust National Footprint
579 33
clinics states
As of December 31, 2020
© 2021 The Joint Corp. All Rights Reserved. 16Franchise License Sales Reinvigorate Acceleration
56 Franchise Licenses Sold in Q4 2020 – Quarterly Record
Franchise Licenses Clinics in Active Gross Cumulative
Sold Annually Development1 Franchise Licenses Sold1
126 121 253
962
99 204 841
715
155 616
112
37
Dec. 31, Dec. 31, Dec. 31, Dec. 31, Dec. 31, Dec. 31, Dec. 31, Dec. 31, Dec. 31, Dec. 31, Dec. 31, Dec. 31,
2017 2018 2019 2020 2017 2018 2019 2020 2017 2018 2019 2020
• 83% sold by RDs in 2020
• 72% of clinics supported by 22 RDs at Dec. 31, 2020
• RDs cover 61% of Metropolitan Statistical Areas (MSAs) at Dec. 31, 2020
1 Of the 962 franchise licenses sold as of December 31, 2020, 253 are in active development, 579 are currently operating and the balance represents terminated/closed licenses.
© 2020 The Joint Corp. All Rights Reserved. 17Continued Improvement to Clinic Economics
More recent cohorts continue to far surpass historical sales growth
System-wide Sales & Potential Company-owned/Managed Contribution1
(5 yr. avg., $ in 000s)
$462 $482
Approximate Investment of $276k $447
$400
• $180K initial build-out cost $379
$330
• Franchisee pays 7% royalty on gross sales
• Franchisee pays $599/month in software fees $249
• Assumes breakeven at $25K monthly gross $187
$140
sales1
$85 $149
• Franchisee pays $39.9K per $127
license, prior to year 1 sales $98
• Improving estimated cash-on-cash return $45
from 5+ years to approximately 3.5 years $(48)
Historical System Avg. Gross Sales (Jan-13 - Dec-20) Historical System Avg. Gross Sales (Jan-17 - Dec-20)
$(101)
Operating Margin (Jan-13 - Dec-20) Operating Margin (Jan-17 - Dec-20)
Yr. 1 Yr. 2 Yr. 3 Yr. 4 Yr. 5
1 Breakeven varies on a clinic-by-clinic basis based on actual gross sales and operating expenses. This represents operating margin excluding income taxes and depreciation.
© 2021 The Joint Corp. All Rights Reserved. 18System-wide and Comp Sales
24% 16% 10%
Increase in Increase in Increase in
system-wide sales comp sales1 for all clinics comp sales1 for all clinics
Q4 2020 over Q4 2019 >13 months in operation >48 months in operation
Q4 2020 over Q4 2019 Q4 2020 over Q4 2019
1Comparable sales include only the sales from clinics that have been open at least 13 or 48 full months and exclude any clinics that have permanently closed.
2 Reconciliation of Adjusted EBITDA to GAAP earnings is included in the Appendix.
© 2021 The Joint Corp. All Rights Reserved. 19Introducing 2021 Guidance
2020 Low High
$ in M
Actual Guidance Guidance
Revenues $58.7 $73 $77
Adjusted EBITDA1 $9.1 $10.5 $12.0
New Franchised Clinic Openings 70 80 100
New Company-owned/Managed Clinics2 4 20 30
1Reconciliation of Adjusted EBITDA to GAAP earnings is included in the appendix. | 2 Through a combination of both greenfields and buybacks.
© 2021 The Joint Corp. All Rights Reserved. 20Resilient Business Model Drives Long-term Growth
The Joint Corp. 10-yr. CAGR 70%1 vs. Industry CAGR 1.4%2*
$260.0
System-wide Gross Sales
People will continue to seek ($ in M) $220.3
more noninvasive, holistic ways
to manage their pain. $165.1
70% CAGR1
(2010 - 2020)
$126.9
We will be ready to treat them. $98.6
$70.1
$46.2
$22.3
$2.8 $8.1
$1.3
2010 2011 2012 2013 2014 2015 2016 2017 2018 2019 2020
1 For the period ended Dec. 31, 2020 | 2 IBIS US Industry Report, Chiropractors in the US, April 2020 - CAGR projected 2020-2025.
© 2021 The Joint Corp. All Rights Reserved. 21Appendix
© 2021 The Joint Corp. All Rights Reserved. 22Q4 2020 Financial Results
$ in M1 Q4 2020 Q4 2019 Differences
Revenue $17.0 $13.9 $3.2 23%
• Corporate clinics 9.2 7.6 1.7 22%
• Franchise fees 7.8 6.3 1.5 24%
Cost of revenue 1.9 1.6 0.3 19%
Sales and marketing 2.1 1.8 0.3 15%
Depreciation and amortization 0.7 0.6 0.1 14%
G&A 9.5 8.5 1.0 13%
Operating Income 2.8 1.3 1.4 106%
Tax Benefit2 7.9 0.0 7.9 na
Net Income / (Loss) 10.6 1.3 9.3 715%
Adj. EBITDA3 3.7 2.1 1.6 74%
1 Due to rounding, numbers may not add up precisely to the totals. 2 Recognized the reversal of the tax valuation allowance of $8.9 million.
3 Reconciliation of Adjusted EBITDA to GAAP earnings is included in the Appendix.
© 2021 The Joint Corp. All Rights Reserved. 23Full Year 2020 Financial Results
Unrestricted cash $20.6M at Dec. 31, 2020, compared to $8.5M at Dec. 31, 2019
$ in M1 2020 2019 Differences
Revenue $58.7 $48.5 $10.2 21%
• Corporate clinics 31.8 25.8 6.0 23%
• Franchise fees 26.9 22.6 4.3 19%
Cost of revenue 6.5 5.6 0.9 17%
Sales and marketing 7.8 6.9 0.9 13%
Depreciation and amortization 2.7 1.9 0.8 44%
G&A 36.2 30.7 5.5 18%
Operating Income 5.5 3.4 2.1 61%
Tax Benefit2 7.9 0.0 7.9 na
Net Income / (Loss) 13.2 3.3 9.9 296%
Adj. EBITDA3 9.1 6.2 2.9 47%
1 Due to rounding, numbers may not add up precisely to the totals. 2 Recognized the reversal of the tax valuation allowance of $8.9 million.
3 Reconciliation of Adjusted EBITDA to GAAP earnings is included in the Appendix.
© 2021 The Joint Corp. All Rights Reserved. 24Experienced Board Offers Leadership
Matthew E. Rubel James H. Amos, Jr. Ronald V. DaVella, CPA Suzanne M. Decker Peter D. Holt Abe Hong Glenn J. Krevlin
Lead Director, 2017 Director, 2015 Director, 2014 Director, 2017 Director, 2016 Director, 2018 Director, 2019
• Lead Director, Executive Chair • Advisory Board Chair, APFI • COO & CFO Aura Ventures • Chief HR Officer, • Pres. & CEO, • EVP & CIO, • Founder, Managing
KidKraft, Inc. P&G Franchising Initiatives • Alkaline Water Co. Aspen Dental Mgmt The Joint Corp. Technologent Partner, & PM, Glenhill
• Chair, Mid Ocean Ptrs. PE • Mail Boxes Etc. • NanoFlex Power Corp. • Davis Vision Companies • Tasti D-Lite • Discount Tire Company Capital Advisors
Consumer Group (now The UPS Store) • Amazing Lash Studio • Great Hill Partners • Red Rock Resorts • Design within Reach
• Ind. Dir., Hudson's Bay Co. & • Intl. Franchise Assn. (IFA) CFO & franchisee • Mail Boxes, Etc. • Starbucks Corp. • Centric Brands
Treehouse Foods • Marine Corps Captain, • Deloitte & Touche (now The UPS Store) • Restoration Hardware
• Varsity Brands, Collective National Veterans’ Admin., • Director Intl. Franchise • Cumberland Associates
Brands, Cole Haan Marine Military Academy, Assn. (IFA)
Marine Corps Heritage Fdn. • The Goldman Sachs Group
• Roark Capital & TPG Capital • Chair, International Affairs
• Pres. Appointee, House • Meineke Car Care Centers Network (IAN)
Advisory Council on Trade • Zig Ziglar Corp
Policy Negotiation • WSI of Canada
BS, Ohio University AB, University of BS, Queens College BA, Univ. of Washington BE, U.S. Military Academy at BA, Wesleyan University
BS, Russell Sage College
MBA, University of Miami Missouri-Columbia MBA, Pace University MA, University of London West Point MBA, New York University
© 2021 The Joint Corp. All Rights Reserved. 25Strong Leadership Team in Place
Peter D. Holt Jake Singleton Jorge Armenteros Jason Greenwood Amy Karroum Eric Simon Manjula Sriram Dr. Steve Knauf
Exe. Dir. of Chiropractic
President & CEO CFO VP, Operations VP, Marketing VP, Human Resources VP, Franchise Sales VP, Technology
& Compliance
• Tasti D-Lite • EY • McDonald’s • Peter Piper Pizza • Thermo Fluids • Aamco • Vail/Versay • Arizona State Board
• Planet Smoothie • American Institute • Dunkin’ Donuts • Robeks Juice • Taylor Morrison • Mail Boxes Etc. • Early Warning of Chiropractic
• Mail Boxes Etc. of CPAs • Baskin Robbins • Young & Rubicam • Foundation for • UPS Store • Walgreens • Northwestern
• The UPS Store • Pollo Campero Group Senior Living • Extreme Pita • United Airlines Health Sciences
• I Can’t Believe • Pulte Homes • US Foods University
It’s Yogurt • ISASA Certified Data • International
Privacy Solutions Chiropractors Assn.
Engineer • American
Chiropractic Assn.
DC, Northwestern Health
MBA, Keller Graduate
MA, Univ. of London MA, Univ. of Arizona MBA, Wayne State Univ. MBA, Univ. of Michigan BA, Univ. of Sciences Univ.
School of Management
BA, Univ. of Washington BS, Univ. of Arizona BBA, Eastern Michigan Univ. BA, Michigan State Univ. Rhode Island BS, Northwestern Health
BS, Univ. of Wisconsin
Sciences Univ.
© 2021 The Joint Corp. All Rights Reserved. 26Revolutionizing Access to Chiropractic Care
Features Industry Problems The Joint’s Solutions
Affordability (per appointment) $77 Average1 $29 Average
Convenient Locations Medical Centers / Offices Retail Locations
Multiple Locations Limited Locations 579 Clinics
Walk-in / No Appointment Appointments Required No Appointments
Insurance / Caps / Co-pays Yes Private Pay
Inviting Consumer-centric Design Clinical Approachable, Consumer Friendly
Service Hours Limited / Inconsistent Open 6-7 Days + Nights & Weekends2
Average Patient Visits per Clinic 600 per Month3 1,350+ per Month4
1 Chiropractic Economics, October 2018 | 2 Hours vary by clinic | 3 Chiropractic Economics, May 2018 | 4 Number includes multiple visits per patient
© 2021 The Joint Corp. All Rights Reserved. 27Patient Demographics
Median Age 37 Years
Generation Mix
Gen Z 11%
Millennial 44%
Gen X 30%
Baby Boomer 15%
Gender
Female 49%
1 Patients who visited The Joint Chiropractic in 2019
© 2021 The Joint Corp. All Rights Reserved. 28Transformative Opportunity for Chiropractors
Industry The Joint
Starting Salary $30K - $40K1 $65K - $85K plus bonus potential2
• Appointments required • No appointments
Accessibility • Medical centers & offices • Clustered, high-visibility retail locations
• Traditional office hours • Open evenings + weekends3
• Proprietary CRM and
• Challenges of managing POS software
a business without support • Ongoing training and coaching
Practice • Difficulty attracting new patients • Ability to perfect technique
& Insurance
• Insurance hassles • Less administration
• Slow payment cycle • Higher patient focus
• Better cash flow
1 Bureau of Labor Statistics, U.S. Department of Labor, Occupational Outlook Handbook, 2016-17 Edition
2 Based on Joint Corp. Company-owned/managed actual salaries | 3 Hours vary by clinic
© 2021 The Joint Corp. All Rights Reserved. 29Non-GAAP Measure Definition
This presentation includes a presentation of EBITDA and Adjusted EBITDA, which are non-GAAP financial measures. EBITDA and Adjusted EBITDA are
presented because they are important measures used by management to assess financial performance, as management believes they provide a more
transparent view of the Company’s underlying operating performance and operating trends than GAAP measures alone. Reconciliations of net loss to EBITDA
and Adjusted EBITDA are presented where applicable. The Company defines EBITDA as net income/(loss) before net interest, tax expense, depreciation, and
amortization expenses. The Company defines Adjusted EBITDA as EBITDA before acquisition-related expenses, bargain purchase net gain, gain/(loss) on
disposition or impairment, and stock-based compensation expenses.
EBITDA and Adjusted EBITDA do not represent and should not be considered alternatives to net income or cash flows from operations, as determined by
accounting principles generally accepted in the United States, or GAAP. While EBITDA and Adjusted EBITDA are frequently used as measures of financial
performance and the ability to meet debt service requirements, they are not necessarily comparable to other similarly titled captions of other companies due
to potential inconsistencies in the methods of calculation. EBITDA and Adjusted EBITDA should be reviewed in conjunction with the Company’s financial
statements filed with the SEC.
© 2021 The Joint Corp. All Rights Reserved. 30Q4 2020 Segment Results
Q4
2020
© 2021 The Joint Corp. All Rights Reserved. 312020 Segment Results
2020
© 2021 The Joint Corp. All Rights Reserved. 32GAAP – Non-GAAP Reconciliation
© 2021 The Joint Corp. All Rights Reserved. 33The Joint Corp. Contact Information
Peter D. Holt, President and CEO
peter.holt@thejoint.com
The Joint Corp. | 16767 N. Perimeter Dr., Suite 110, Scottsdale, AZ 85260 | (480) 245-5960
https://www.facebook.com/thejointchiro
@thejointchiro
Jake Singleton, CFO https://twitter.com/thejointchiro
jake.singleton@thejoint.com @thejointchiro
The Joint Corp. | 16767 N. Perimeter Dr., Suite 110, Scottsdale, AZ 85260 | (480) 245-5960
https://www.youtube.com/thejointcorp
@thejointcorp
Kirsten Chapman, LHA Investor Relations
thejoint@lhai.com
LHA Investor Relations | One Market Street, Spear Tower, Suite 3600, San Francisco, CA 94105 | (415) 433-3777
© 2021 The Joint Corp. All Rights Reserved. 34You can also read