Management White Paper on Real Estate Market 2021
←
→
Page content transcription
If your browser does not render page correctly, please read the page content below

UC Asset Limited Partnership

Management White Paper on
Real Estate Market 2021

IMPORTANT NOTICE:
In this white paper, we will provide our opinion based on our best
observation and reasoning. Although we are confident in our opinion,
it, however, does not constitute any investment advice and should not
be used as basis for anyone to make their investment decision. This is
a communicative move so that our shareholders and investors may
have better understanding of our investment strategy. We may adjust,
change or even reverse our opinion in the future with or without any
reason, and we are not obligated to disclosure or update about those
changes or even reverses.
Management White Paper on Real Estate Market 2021

Dear Shareholders,

In the past months, we, the management of UC Asset LP, have received inquiries from some shareholders
questioning about our current investment strategy. In this letter, we will share some thoughts with our
shareholders.

2020 was a very confusing and eventful year. We witnessed a dramatic increase in residential housing
prices. For some investors, it may suggest a bull market in residential property, and they may decide to
make more purchases. Our team, however, concluded in 2020 that it was not an ideal time to expand our
portfolio, after considering both the economic climate and our investment model.

In the 12 months from October 2019 to October 2020 S&P Case-Shiller Index, the widely accepted index
tracking residential property price, had gained 8.4% nationwide, and 8.0% in 20 cities including metro
Atlanta. In metro Atlanta specifically, Case-Shiller gained by 7.1% for this period.

This increase should be considered abnormal as it breaks away from the assumed correlation, which is
usually very high, between house price and economic and employment growth.

    1.   The 2020 House Market Broke Away from Economy and Employment Trend

The following chart shows the very positive correlation between house price, local economy growth, and
employment growth, in the metro Atlanta area, over the last 20 years (Same correlation would exist if we
expanded the range of data to cover a longer period of time).

It also manifests the anomaly in 2020 -- House price index in Atlanta rose by 7.1% when the local economy
shrank by more than 2% and employment shrank by 5.7%.

Not only did house price increase in 2020, despite a shrinking economy and dropping employment, it had
risen faster than in the previous 3 years. For example, Atlanta Case-Shiller index only increased by 4.1%
for the 12 months between October 2018 to October 2019, when local economy actually had a growth.

If we compare 2020 to past years with similar economic situation, the abnormality is even more obvious.
When a similar GDP retraction occurred in 2008 and 2009, Atlanta Case-Shiller index dropped by -10.5%
(October 2007- October 2008) and -7.6% (October 2008 – October 2009) respectively.

UC Asset Limited Partnership. Address: 2299 Perimeter Park Drive, Suite 120, Atlanta , GA 30341, USA; Website: www.ucasset.com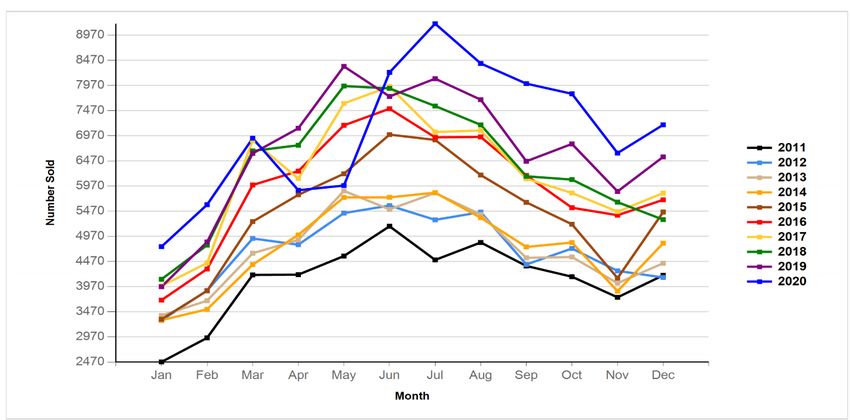
Neither did the sharp dip in employment have stopped the rising of house price. This is even worse
abnormality because employment is arguably a more relevant factor, as people need paycheck to pay for
residential mortgage.

                                                      House Price                      Economy                      Employment
                  210

                  170

                  130

                   90

                   50
                                             J-04
                                                    J-05
                                                           J-06
                        J-01
                               J-02
                                      J-03

                                                                  J-07
                                                                         J-08
                                                                                J-09
                                                                                       J-10
                                                                                              J-11
                                                                                                     J-12
                                                                                                            J-13
                                                                                                                   J-14
                                                                                                                          J-15
                                                                                                                                 J-16
                                                                                                                                        J-17
                                                                                                                                               J-18
                                                                                                                                                      J-19
                                                                                                                                                             J-20
                   Figure 1. Correlation between Atlanta house price vs local GDP and employment
                                (Created by UC Asset based on publicly available data)

    2.   Residential Price Hike Is Driven By Higher Demand

The rising residential housing prices in Atlanta were driven up by higher demand. In all FMLS areas, which
covers metro Atlanta, 2020 saw considerably more homes sold than any other year, even the year of 2019,
when residential closings reached record high numbers (See Figure 2, the chart in the previous page).
Demand temporarily dropped in April and May, when COVID erupted in the States, but soon recovered and
compensated the lost demand in June and July. The demand for residential properties remained strong for
the rest of the year and eventually reached a new record high.

UC Asset Limited Partnership. Address: 2299 Perimeter Park Drive, Suite 120, Atlanta , GA 30341, USA; Website: www.ucasset.com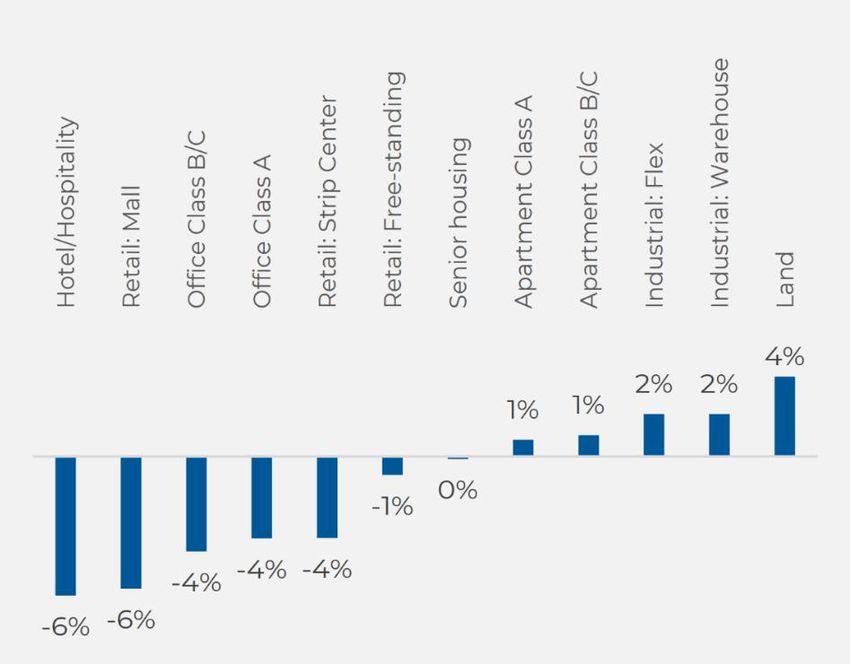
Figure 2: Listing Sold in Metro Atlanta, in every month (Residential, detached). Source: FMLS

The numbers in metro Atlanta showed similar increases. (See below). Also, the increase percentage was
larger in 2020 (3.5%) than in 2019 (2.8%). This explains the increase in residential prices in 2020 in
comparison to 2019 (7.1% vs 4.1%).

                       Figure 3: Annual Number of House Sales in Metro Atlanta. Source: FMLS

UC Asset Limited Partnership. Address: 2299 Perimeter Park Drive, Suite 120, Atlanta , GA 30341, USA; Website: www.ucasset.com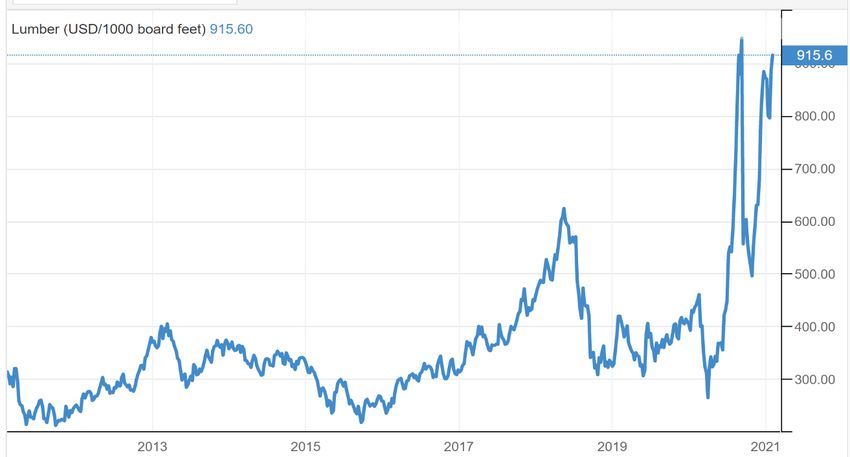
3. High Demand Is Likely NOT Driven by Historically Low Mortgage Rate
With the rising house prices being attributed to higher demand, the next question is: Why was the
demand for residential properties so high in 2020, despite a shrinking economy, decreased jobs and less
personal income? Will this demand be sustainable throughout 2021?
An easy answer is that it is because of record-low interest rates. But after careful examination of data, we
believe this is NOT the correct explanation.
The following chart shows the average rate of 30-year residential mortgage over the past 50 years. It is
true that we’ve never seen a mortgage rate this low, but it is not a new thing. In fact, lower mortgage rates
have been a trend over the past 40 years, ever since it reached its historical high in the early 1980s. (The
chart is created by UC Asset based on publicly available data).
Figure 4: 30 year fixed mortgage rate (%)
20
18
16
14
12
10
8
6
4
2
0
6/1/1974
5/1/2020
4/1/1971
11/1/1972
1/1/1976
8/1/1977
3/1/1979
10/1/1980
5/1/1982
12/1/1983
7/1/1985
2/1/1987
9/1/1988
4/1/1990
11/1/1991
6/1/1993
1/1/1995
8/1/1996
3/1/1998
10/1/1999
5/1/2001
12/1/2002
7/1/2004
2/1/2006
9/1/2007
4/1/2009
11/1/2010
6/1/2012
1/1/2014
8/1/2015
3/1/2017
10/1/2018
In such a constant downward trend that has lasted for 4 decades, it is hard to believe that, by the year of
2019, there were still many “stand-by” buyers waiting for an even lower interest, who would start to buy in
2020.
Furthermore, it is reasonable to assume that absolute level of interest rate does not alter demand. What
matters is the marginal change, i.e., how lower (or higher) the rate is in comparison to the same period
before.
The next graph (created by UC Asset based on publicly available date) shows that marginal change of
mortgage rate in 2020 was not the greatest. Marginal change in 2009 is considerably larger than in 2020,
and the marginal change in 2019 is slightly larger. And marginal change in 2012 is only slight smaller.
UC Asset Limited Partnership. Address: 2299 Perimeter Park Drive, Suite 120, Atlanta , GA 30341, USA; Website: www.ucasset.com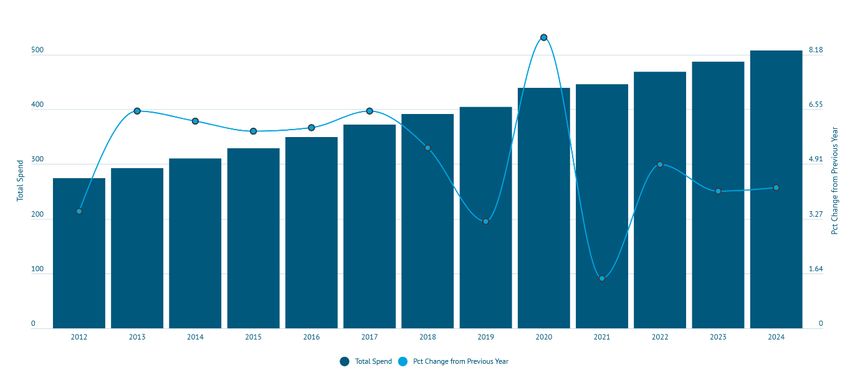
Figure 5: Marginal change of 30 year mortgage rate

              1.5

               1

              0.5

               0

             -0.5

               -1

             -1.5

               -2
                                                                           5/1/2010
                    1/1/2007
                               9/1/2007
                                          5/1/2008
                                                     1/1/2009
                                                                9/1/2009

                                                                                      1/1/2011
                                                                                                 9/1/2011
                                                                                                            5/1/2012
                                                                                                                       1/1/2013
                                                                                                                                  9/1/2013
                                                                                                                                             5/1/2014
                                                                                                                                                        1/1/2015
                                                                                                                                                                   9/1/2015
                                                                                                                                                                              5/1/2016
                                                                                                                                                                                         1/1/2017
                                                                                                                                                                                                    9/1/2017
                                                                                                                                                                                                               5/1/2018
                                                                                                                                                                                                                          1/1/2019
                                                                                                                                                                                                                                     9/1/2019
                                                                                                                                                                                                                                                5/1/2020
                                                                                                                                                                                                                                                           1/1/2021
If our theory on marginal rate change is correct, the demand in 2020 should not be much stronger than in
2009, 2019 or even in 2012. But 2020 demand was, in fact, much stronger. Therefore, there must be
other factors that contributed to the extraordinary rise of house-buying demand in 2020, other than the
low interest rate.

    4.   Strong Demand Was An Unexpected Consequence of COVID Pandemic

Back in July 2020, our team have come up of a theory, that the COVID Pandemic would motivate people,
perhaps in an “unreasonable” manner, to purchase better and bigger houses.

Because of COVID, people have been spending an unprecedented amount of time in their residence,
sometimes feeling “trapped”. The longer they feel “trapped”, the stronger will be their desire to improve their
current space, or simply “get a better one.”

Our argument is supported with evidence from the home improvement industry. In 2020, there was a
significant increase in home renovation activities, which can be measured by the growth of the home
improvement product market. According to Home Improvement Research Institute (HIRI), the growth rate
of home improvement product sales reached a historical high in 2020, higher than any previous years and,
based on the projection of HIRI, will be higher than the next 5 years. (See Figure 6)

UC Asset Limited Partnership. Address: 2299 Perimeter Park Drive, Suite 120, Atlanta , GA 30341, USA; Website: www.ucasset.com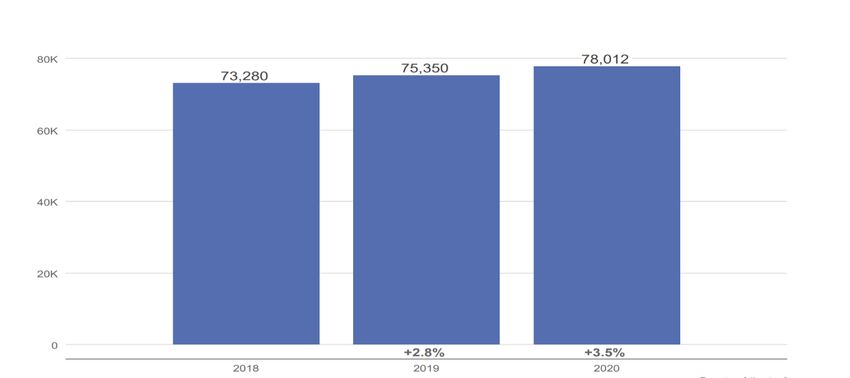
Figure 6: Size and Growth Rate of Home Improvement Products Market
                (Source: HIRI. Data after 2020 are projections)

Moreover, this historically fast growth was mostly pushed by consumer demands, i.e., individual
homeowners. According to HIRI, 71% of 2020’s home improvement products were sold to consumers.
These are most likely DIY renovations done by homeowners. Only 29% were sold to professionals (such
as investors like us). This is very different from other years past, when approximately about half or more
home improvement products were sold to professional renovators.

In short, consumers, because of long period of “shield-at-home”, intended to do much more DIY
improvements to their exist homes. It is reasonable to assume that the same mentality would drive up
consumers’ desire to buy new homes.

By the time of third quarter of 2020, many industry experts and analysts had come to the same conclusion
as ours. In September, an article on CNBC (Consumer News and Business Channel) said that “Exceptional
demand for new and existing homes, brought on by the stay-at-home culture of the coronavirus pandemic” 1 In
October, Daryl Fairweather, chief economist at real estate brokerage firm Redfin (NASDAQ: RDFN),
claimed publicly:

“In many markets, the sales were driven by demand for suburban properties by millennial and first-time buyers as
work-from-home policies became the standard across many industries.” 2

In November, Realtor.com published a survey targeting millennials, who are currently the largest group of
home buyers. The survey found that “the COVID-19 pandemic has made nearly half of millennial home
shoppers speed up their home buying timeline” : 3

    •    Of survey respondents, 75% of millennials have been working remotely since the COVID pandemic hit. Of
         those respondents, 63% said they plan on purchasing a home because of their ability to work remotely.
    •    Nearly half of millennial respondents -- 49% -- reported COVID has pushed them to buy a home sooner
         than their original timeline.

1
  https://www.cnbc.com/2020/09/24/coronavirus-new-home-sales-crush-expectations-but-the-supply-is-running-
out.html
2
  https://fortune.com/2020/10/20/real-estate-coronavirus-pandemic-home-buying-zillow-redfin/
3
  https://www.realtrends.com/blog/new-research-who-is-todays-millennial-home-buyer

UC Asset Limited Partnership. Address: 2299 Perimeter Park Drive, Suite 120, Atlanta , GA 30341, USA; Website: www.ucasset.com
If this is true, we shouldn’t expect that such a strong demand will be sustainable. Richard Barton, the CEO
of online real estate marketplace Zillow.com (NASDAQ: ZG), said in October that “We can’t expect that
kind of thing to continue.” In fact, Zillow projected that home sales are “expected to peak this fall then taper
off through 2021, though still staying above pre-pandemic levels.” 4 To mirror this projection, HIRI also
projected a slow-down of home improvement product sales in 2021. Particularly, they project that consumer
demands will have a sharp drop.
5. Rising Building Cost Nullified Investment Return
This pandemic-driven hike of demand may lead industry outsiders to believe that 2020 has been great for
residential property investors. Unfortunately, this was likely not true for many professional investors like us,
because building cost rose much faster.
Figure 9: Lumber board (LB1) price ($/1000 board feet)
(Source: Chicago Mercantile Exchange)
Lumber is the most used materials in residential construction in north America. According to the data from
Chicago Mercantile Exchange, lumber future price had already risen dramatically in 2017 and 2018. Its
highest point in 2018 was 50% higher than its previous historical high in 2013. After dollar value stabilized
and the US-Canada trade dispute solved, lumber price had dropped back to a reasonable level in 2019.
But then the pandemic hit.
Mostly due to the pandemic, lumber price had another huge surge in 2020. According to the lumber future,
one thousand board feet price surpassed $945 in August 2020. This is more than 50% higher than its 2018
peak, and more than 120 % higher than its 2013 peak. In comparison to its 2016 low point, when UC Asset
was founded, the current lumber price is over 4 times more expensive.
4
https://fortune.com/2020/10/20/real-estate-coronavirus-pandemic-home-buying-zillow-redfin/
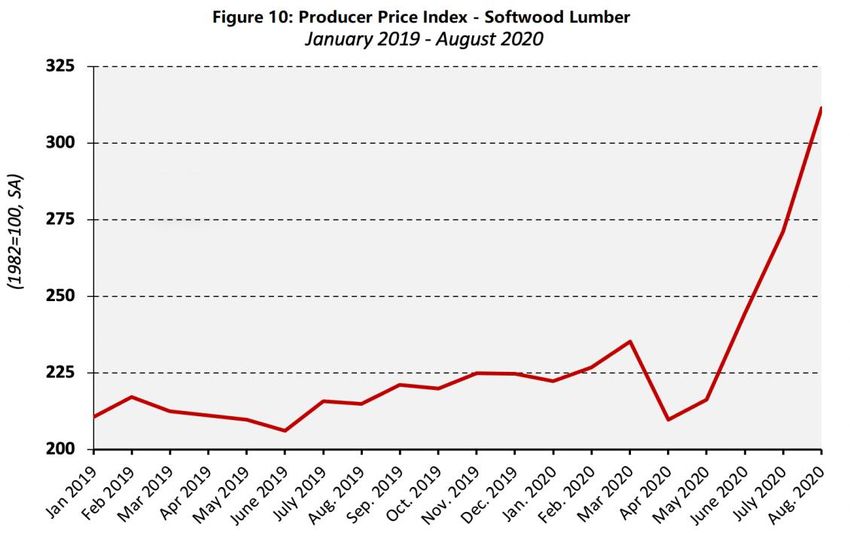
UC Asset Limited Partnership. Address: 2299 Perimeter Park Drive, Suite 120, Atlanta , GA 30341, USA; Website: www.ucasset.comThe Producer Price Index of Soft Lumber, run by National Association of Home Builders (NAHB), verified
the huge hike of lumber price in 2020. According to NAHB, in the single month of August 2020, lumber
price rose by 14.9%. Prices have increased nearly 50% since April, the largest four-month gain in the history
of the unadjusted data series which dates back to 1949.
How the COVID pandemic caused a lumber price hike? Some possible reasons include:
• Shield-at-home prompted more homeowners to renovate/remodel their houses, including many
DIY projects, which increased the demand for building materials.
• Businesses like restaurants and bars had to expand their outdoor space to meet the government
requirements in order to stay open, thus many outdoor structures needed to be built.
• Weaker dollar, linked to the low FED rate in response to the pandemic, increased the price of
many imported construction materials.
• Factories were closed or not run at full capacity due to pandemic, thus decreased the supply of
building materials.
Besides the rise of building material cost, labor cost also rose considerably during the pandemic.
Furthermore, administration cost and time cost rose, because many administrative team and government
agencies did not operate in full capacity.
Overall, for many investors to include us, the rising construction costs have eaten the profit gain from the
rising house price, and in some cases have actually made the profit margin thinner.
This may also explain the fact that, despite rising demand for new homes, we don’t see a surge of supplies.
The gap between demand and supply has caused a continuous drop of house inventories. According to
National Association of Realtors (NAR), “In December 2020, inventory was at 1,070,000 active properties
listed on the market. This is down 16.4% from November 2020 (1,280,000). Compared with December of
2019 (1,390,000), inventory levels were down a marked 23.0%. This is a record-setting low since 1999,
when NAR started tracking the data.”
UC Asset Limited Partnership. Address: 2299 Perimeter Park Drive, Suite 120, Atlanta , GA 30341, USA; Website: www.ucasset.comWhy does inventory keep dropping?
We believe that many investors had halted expanding investment into more homebuilding. This has been
our line of thinking as well.
6. Commercial Property Value Went Variant During The Pandemic
While residential property showed universal appreciation during the pandemic, commercial properties
varied a lot in terms of their performance under COVID-19. The below chart shows the YoY change of sales
price by the fourth quarter of 2020.
Figure 11: YoY % Change of
Commercial Sales Price in 2020 Q4.
Source: National Association of
Realtors (NAR)
Overall, commercial properties were in a bearish market, but different assets varied a lot. Land and
industrial properties did well, while hotel/hospitality and mall properties suffered a remarkable loss, and
offices and strip center retails also performed poorly.
This is very likely a direct consequence of the pandemic. People have cut down their traveling, reduced
their nightlife, shifted to on-line shopping and worked from home. These changes in social and work
behaviors were heavily reflected in the depreciation of certain commercial property values.
The big questions is: Are those changes of behavior long-term/permanent, or are they temporary? If people
will return to their “old norm” after COVID, we will potentially witness a price rebound of those depreciated
commercial properties. However, some changes may represent a future “new norm”. They had started
before COVID, and the pandemic only accelerated these long-term trends.
UC Asset Limited Partnership. Address: 2299 Perimeter Park Drive, Suite 120, Atlanta , GA 30341, USA; Website: www.ucasset.comAn example of this can be the new trend of working remotely, or working from a home office space. Before
the pandemic, Kate Lister, a workplace expert, estimated in 2019 that “56% of the U.S. workforce holds a
job that is compatible (at least partially) with remote work”. The pandemic sped up the shift from office
workspace to home workspace. According to a report by the NATIONAL BUREAU OF ECONOMIC
RESEARCH(June, 2020), about 40% of both large and small firms expect that 40% or more of their workers
who switched to remote work during the crisis will stay doing remote work after the crisis. i.e. at least 16%
of American workers will switch to working at home at least 2 days/week permanently.
Similar points may be made about shopping malls and movie theaters. It is possible that some people will
forever shift to online shopping and streaming services, and malls and movie theaters may never fully regain
their lost business.
On the other hand, some social activities, such as dining and clubbing, may rebound after COVID. People’s
need and desire to social will not disappear, and may get stronger after a long time deprivation from social
life.
7. SHOC: Shared Home-Office Community
Perhaps another permanent trend is happening to the hospitality industry. There is an undeniable shift from
conventional hotels to shared accommodation.
Hotels are among the highest commercial properties that depreciated during the pandemic, due to the sharp
drop of travelers. The chart below shows such drop:
Figure 12: Hotel Occupancy Dramatically Dropped in Metro Atlanta
We believe this may accelerate the shift from conventional hotels to technology driven shared-
accommodation spaces, such as Airbnb, Vrbo and Homeaway. There is a similar correlation between
conventional taxi businesses and the new shared-ride companies like Uber (NYSE: UBER) and Lyft.
UC Asset Limited Partnership. Address: 2299 Perimeter Park Drive, Suite 120, Atlanta , GA 30341, USA; Website: www.ucasset.comSo far, shared accommodations have replaced a fair share of vocational resorts. But conventional hotels who serve business travelers have held their ground. Before COVID-19, conventional hotels in the central business districts or around airport hubs were doing extremely well. In metro Atlanta which is a hub to both domestic and international business travelers, occupancy rate of business hotels stayed about 80% even 90%. As we mentioned above, COVID-19 has expedited a transition in corporate work habits resulting in many people focusing on home office spaces. Based on a research conducted by UC Asset, this trend will prompt travelers to choose home-office style shared-accommodations over conventional hotels. However, there are several factors that are preventing business travelers from patronizing shared accommodations and abandoning conventional business hotels, such as the lack of a business center, as well as other facilities. To address those concerns, we have come up with the concept SHOC, standing for Shared Home-Office Community. In comparison to conventional hotel rooms, SHOC are equipped with home-office facilities such as hi-speed internet, video conferencing, easy access to office accessories such as printers and scanners, and other tools to empower today’s business travelers. But it also presents the personalized charm, including home-style full-equipped kitchen, to serve travelers with a home office away from home. Further, we believe that the concept of SHOC can be very useful to renovate communities. In many metro cities, there are distressed residential communities adjacent to airports or central business districts (CBDs). Those communities cannot be renovated by simply building new houses. Businesses and the income associated with new businesses must be introduced into those communities. SHOC builders are not only renovating houses, but also turning those houses into income-generating businesses for local residents. UC Asset Limited Partnership. Address: 2299 Perimeter Park Drive, Suite 120, Atlanta , GA 30341, USA; Website: www.ucasset.com
CONCLUSION

2020 is a unique year for real estate investors. The world was hit by COVID pandemic and the economy of
the States crippled. Commercial properties performed relatively poorly, and some categories of commercial
properties took a big hit, due to the decrease of business and social activities. Meanwhile, residential
properties experienced an extraordinary value soaring, which, according to our analysis as well as opinions
of industry leaders from Redfin (NASDAQ: RDFN), Realtor.com, and Zillow.com (NASDAQ: ZG), was an
unexpected consequence of the pandemic. After a long period of shielding-at-home, people developed
stronger desires to improve their live space, by either remodeling their existing house or buying a new
house. Thus, the dramatic increase of purchase power for residential properties is likely not sustainable.
Meanwhile, the fast rising of building cost has nullified investors’ profit in building or renovating houses,
despite the rising house price.

Based on our observation, UC Asset has adopted a conservative strategy since early summer in 2020. We
halted new builds, focusing on finishing existing projects, and held back sales of our inventory as we
projected that they could be sold later for better prices. Starting from late fall, we began to sell a few
properties to reduce our inventory, and yes, we did sell them at better prices. We plan to sell more properties
and reduce our inventory to a very lower level by summer of 2021.

We have increased our cash reserve. We have been following the development of the commercial property
market very carefully, because we believe the dynamics of the commercial market and submarkets are
creating great opportunities for savvy investors.

We are also pursuing our SHOC strategy avidly. We believe that SHOC is a revolutionary model to renovate
communities and disrupt conventional hotel business. UC Asset has made successful investments into
home renovations in distressed communities. With the very few pilot projects, we made over 50%
annualized return on a single sale. With the innovative model of SHOC, we will be able to change the life
of communities and deliver better returns to our investors.

SHOC is based on a concept that represents the future for all communities. It will combine residential and
commercial spaces, and bring back the lifestyle that we homo sapiens had enjoyed for tens of thousands
of years before the industrial age. That lifestyle is: we will live where we work. A community in which people
live where they work, is more efficient, more environmental, more productive, and more human.

UC Asset Limited Partnership. Address: 2299 Perimeter Park Drive, Suite 120, Atlanta , GA 30341, USA; Website: www.ucasset.com
You can also read