Scarcity Pricing in ERCOT - Resmi Surendran Sr. Manager, Wholesale Market Operations and Analysis William W. Hogan, Harvard University Hailong ...
←
→
Page content transcription
If your browser does not render page correctly, please read the page content below
Scarcity Pricing in
ERCOT
Resmi Surendran
Sr. Manager, Wholesale Market Operations and Analysis

William W. Hogan, Harvard University
Hailong Hui, Electric Reliability Council of Texas
Chien-Ning Yu, ABB Inc.

FERC Technical Conference
June 27-29, 2016
ERCOT Region
    •    ~90% of Texas load ~75% land
          •   24 million consumers

    •    406,500 circuit miles of high-voltage
         transmission                                                                              220 MW with SPP
                                                                                                          600 MW with SPP

                                                                        30 MW with CFE

    •    77,000 megawatts (MW) capacity for peak                        at Eagle Pass

                                                                          100 MW with CFE

         demand                                                           at Laredo
                                                                                         300 MW with CFE at McAllen

          •   550 generation resources
          •   ~16GW Wind with ~17% capacity included
          •   288MW solar

    •    69,877 MW peak demand (Aug.10, 2015)
          •   Peak Wind 14,023 MW (February 18, 2016)
          •   Wind penetration record: 48.28 percent (March 23, 2016)

    •    ~$35 billion Market
          •   ~1,400 active Market entities

PUBLIC                                                                                                                  2
Market Design Discussions                                                     Generators Earn Less at High Reserve Margins
                                                                                  $250

 Brattle recommended market design options                                        $200
                                                                                                     Gas Turbine
                                                                                                     Operating Margins
                                                                                  $150

                                                                         $/kW-y
                                                                                                                              Levelized Cost of
                                                                                                                              New Gas Turbine
 •       Energy Only Market                                                       $100
                                                                                                                                                     Missing
                                                                                                                                                     Money
                                                                                   $50
          –   Pure energy-only with market based reserve margin
                                                                                    $0
          –   Energy-only with adders to support target reserve margin

                                                                                         4%
                                                                                              5%
                                                                                                   6%
                                                                                                        7%
                                                                                                             8%
                                                                                                                  9%

                                                                                                                                                      15%
                                                                                                                                                            16%
                                                                                                                                                                  17%
                                                                                                                       10%
                                                                                                                             11%
                                                                                                                                   12%
                                                                                                                                         13%
                                                                                                                                               14%
                                                                                                                  Reserve Margin
          –   Energy-only with backstop procurement at minimum margin level
                                                                                  8%                                                     13.75%
                                                                              “Investment                                                 Target
 •       Capacity & Energy Markets                                            Equilibrium                                                Reserve
                                                                               ” Reserve                                                 Margin
          – Mandatory resource adequacy requirements for load serving entities Margin

          –   Resource adequacy requirement with centralized capacity market                       From Brattle presentation based on a
                                                                                                   $9,000 price cap and scarcity pricing
                                                                                                   without ORDC

PUBLIC                                                                                                                                               3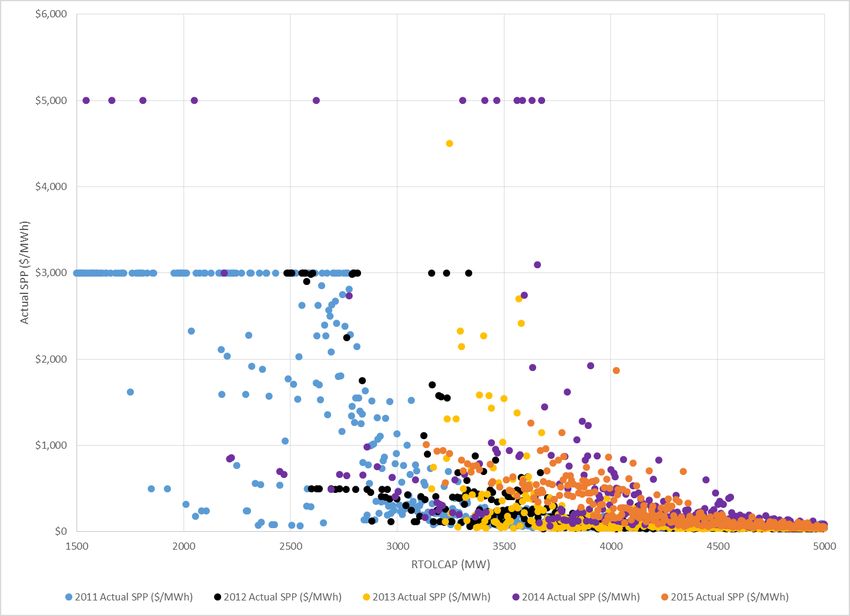
Nodal Policy Changes

   • System Wide Offer Cap raised to
      • $4,500/MWh - Aug 1, 2012
      • $5,000/MWh - June 1, 2013
      • $7,000/MWh - June 1, 2014
      • $9,000/MWh - June 1, 2015

   • Implemented an Operating Reserve Demand Curve (ORDC) with the
     Value of Lost Load equal to $9,000/MWh effective June 1, 2014

PUBLIC                                                          4
Scarcity Pricing in Real-Time Market

         The Real Time prices determined by Security Constraint Economic Dispatch
         (SCED) would be increased by the ‘Real-Time Reserve Price’ which is
         determined based on remaining reserves in the system and a predefined
         Operating Reserve Demand Curve (ORDC) to reflect the incremental value of
         scarce operating reserves.
             The value of ORDC at any given level of available operating reserves is determined as the Loss
             of Load Probability (LOLP) at that reserve level multiplied by Value of Lost Load (VOLL)

             The RT price adder is an increasing function that values the remaining reserves as a function of
             the total generation in the system, sum of base points, offline Non-Spin, RRS from Load
             Resources, and Resources that can be started and available in 30 minutes

         Reserves in Real-Time are paid based on the ‘Real-Time Reserve Price’ and
         reserves awarded in the Day-Ahead Market but are dispatched for energy in
         Real-Time are charged the ‘Real-Time Reserve Price’

PUBLIC                                                                                                          5
Loss of Load Probability (LOLP)
LOLP would be determined based on a mean (μ) and standard deviation (σ)
of the error in system reserves forecasted at the end of Adjustment Period for
the hour with respect to the reserves available in RT (HRUC reserves – RT
reserves)
Due to normal distribution of errors, LOLP which is equivalent to probability
of occurrence of an event of magnitude greater than the remaining reserve
[P(Y ≥ x)], is determined as 1- (½ + ½[erf((x-μ)/√(2σ^2))] ) for each reserve
(x MW) level
Seasonal and time of day specific LOLPs would be created to capture the
potential differences between the different time periods and risk levels that
occur throughout the year.
PUBLIC 6Operating Reserve Demand Curve (ORDC)
VOLL
Price of Reserves ($/MWh)
For each season, 6 ORDC curves will be created for 6 time
of day blocks each of 4 hours with VOLL at $9000 and
minimum contingency level at 2000MW
0 2000 4000 6000 8000
Available Reserves (MWs)
VOLL = Value of Lost Load
PUBLIC 7Tight Days: Aug 4th – 10th 2015 PUBLIC 8
SCED ORDC On-Line Reserve and Price Adder
                                            June 2014 -                  2015

                            Data

                                             May 2015
     June
        July
      August


                     ORDC Settlements
       $134 M
     $5 M
      $79 M
     $309M


                   Average Online Reserve
                                               $0.51
     $0.21
     $3.51
     $16.51

                        Price (Peak)


PUBLIC                                                                                  9
Actual Price Vs Reserve Capacity PUBLIC
Back-casted Price Vs Reserve Capacity

PUBLIC
Reliability Deployment Price Adders
    • ERCOT implemented a pricing run to mitigate the price
      reversals due to
         – Must take capacity (0-LDL) of RUC commit Resources

         – Must take capacity (0-LDL) of RMR commit Resources

         – Blocky MWs of ERS deployments

         – Blocky MWs of Load Resource deployments

    • Increase in energy cost identified in the pricing run will be
      added to the RTLMPs and Resources will be paid lost
      opportunity make whole payments.

PUBLIC                                                          12
Load Participation in SCED
• Load Resources capable of following 5-minute SCED instructions
• Existing or new single-site Controllable Load Resources (CLRs)
• Aggregate Load Resources (ALRs) composed of multiple sites within
single ERCOT Load Zone (subset of CLR)
• Will not support direct participation by third-party DR QSEs
• SCED will honor LR’s telemetered ramp rates
• QSEs with LRs in SCED will submit Bids to buy (not Offers to sell)
• ‘Bid to buy’ creates settlement outcomes equivalent to the
“volumetric flow” LMP minus G methodology, while avoiding need
for ERCOT to “send back” the DR value to the LSE
• Bid will modify the SCED demand curve and have ability to set price
• SCED demand will be adjusted to accommodate LR participation
PUBLIC 13Brattle Study Results
• Brattle study with the ORDC in place showed the
following Reserve Margins
Market Based Equilibrium 11.5%
for 0.1 LOLE 14.1%
Reliability Based for 2.4 LOLH 9.1%
for 0.001% EUE 9.6%
• ERCOT’s current target reserve margin is 13.75%
May 2016 2017 2018 2019 2020 2021
CDR
18.2% 25.4% 23.2% 22.4% 21.6%
PUBLIC
14Questions? PUBLIC 15
Market Conditions (2011 to 2015)
     Year            Peak Load     EEA               Duration          Issues                          More Issues
                     (MW)                            >$3,000

     2011            68,379        10 Energy         HubAvg SPP at     Up to 4000MW firm load shed     Two Emergency Interruptible
                                   Emergency Alert   or above $3,000   on Feb2nd (~ 7hrs)              Load Service deployments
                                   (EEA) and 12      for 16.75 hours                                   Feb 2nd -3rd : 467.7 MW
                     (8/3/2011)    watch for PRC                                                       Aug 4th : 440.2 MW
                                   issued

     2012            66,626        No EEA events     HubAvg SPP        One watch for Physical          High load growth in west
                                                     never at or       Responsive Capability (PRC)     Texas causing one major
                                                     above $3,000      below 2500 MW due to the        congestion and consistent
                     (6/26/2012)                                       tripping of two large           price separation between hub
                                                                       generating units on July 30th   & load zone

     2013            67,245        No EEA events     HubAvg SPP at
                                                     or above $3,000
                                                     for 0.5 hours
                     (8/7/2013)

     2014            66,454        2 EEA events in   HubAvg SPP at     High prices occurred in the     Three Load Resource group
                                   January           or above $3,000   winter months                   deployments: 2 on 1/6 (546.4
                     (8/25/2014)                     for 1.25 hours                                    MW and 536.2 MW) and 1 on
                                                                                                       1/18 (875 MW)

     2015            69,877        No EEA events     HubAvg SPP                                        RRS deployment from load on
                                                     never at or                                       7/29 (21.8 MW)
                     (8/10/2015)
                                                     above $3,000

     2016            70,014
     Forecast (per
     May 2015 CDR)

16
PUBLIC
Monthly Average Hub Price PUBLIC 17
ERCOT Market Heat Rates

18
PUBLIC
May 2016 CDR

                                            Report on the Capacity, Demand and Reserves in the ERCOT Region

                                                                      Summer Summary: 2017-2026
Load Forecast, MW:                                                                       2017     2018     2019     2020     2021     2022     2023     2024      2025     2026
   Total Summer Peak Demand (based on normal weather)                                  71,416   72,277   73,663   74,288   74,966   75,660   76,350   77,036    77,732   78,572
    less: Load Resource providing Responsive Reserve                                   -1,153   -1,153   -1,153   -1,153   -1,153   -1,153   -1,153   -1,153    -1,153   -1,153
    less: Load Resource providing Non-Spinning Reserve                                      0        0        0        0        0        0        0        0         0        0
    less: Emergency Response Service (10- and 30-min ramp products)                    -1,507   -1,507   -1,507   -1,507   -1,507   -1,507   -1,507   -1,507    -1,507   -1,507
    less: TDSP Standard Offer Load Management Programs                                   -208     -208     -208     -208     -208     -208     -208     -208      -208     -208
   Firm Peak Load, MW                                                                  68,548   69,409   70,795   71,420   72,098   72,792   73,482   74,168    74,864   75,704

Resources, MW:                                                                           2017     2018     2019     2020     2021     2022     2023     2024      2025     2026
   Installed Capacity, Thermal/Hydro                                                   65,990   66,165   65,325   65,325   65,325   65,325   65,325   65,325    65,325   65,325
   Switchable Capacity, MW                                                              2,972    2,972    2,972    2,972    2,972    2,972    2,972    2,972     2,972    2,972
     less: Switchable Capacity Unavailable to ERCOT, MW                                  -300     -300     -300     -300        0        0        0        0         0        0
   Available Mothballed Capacity, MW                                                      805      805      805      805      805      805      805      805       805      805
   Capacity from Private Use Networks                                                   4,292    4,540    4,536    4,465    4,436    4,496    4,496    4,486     4,486    4,486
   Non-Coastal Wind, Peak Average Capacity Contribution (12%)                           1,693    1,693    1,693    1,693    1,693    1,693    1,693    1,693     1,693    1,693
   Coastal Wind, Peak Average Capacity Contribution (55%)                               1,015    1,015    1,015    1,015    1,015    1,015    1,015    1,015     1,015    1,015
   Solar Utility-Scale, Peak Average Capacity Contribution (80%)                          230      230      230      230      230      230      230      230       230      230
   RMR Capacity to be under Contract                                                        0        0        0        0        0        0        0        0         0        0
   Operational Generation Capacity, MW                                                 76,697   77,120   76,276   76,205   76,476   76,536   76,536   76,526    76,526   76,526

   Capacity Contribution - Non-Synchronous Ties, MW                                       577      577      577      577      577      577      577      577       577      577
   Planned Thermal Resources with Signed IA, Air Permits and Water Rights, MW           1,400    6,207    7,185    7,425    7,425    7,425    7,425    7,425     7,425    7,425
   Planned Non-Coastal Wind with Signed IA, Peak Average Capacity Contribution (12%)      838    1,083    1,167    1,167    1,167    1,167    1,167    1,167     1,167    1,167
   Planned Coastal Wind with Signed IA, Peak Average Capacity Contribution (55%)          305      619      619      619      619      619      619      619       619      619
   Planned Solar Utility-Scale, Peak Average Capacity Contribution (80%)                1,177    1,412    1,412    1,412    1,412    1,412    1,412    1,412     1,412    1,412
   Total Capacity, MW                                                                  80,995   87,019   87,238   87,407   87,678   87,738   87,738   87,728    87,728   87,728

   Reserve Margin                                                                      18.2%    25.4%    23.2%    22.4%    21.6%    20.5%    19.4%    18.3%     17.2%    15.9%

   PUBLIC                                                                                                                                                      19
April 2016 GIS
Fuel
Type Screening
Study
Screening
Full
Study
Full
Study
IA
Executed
IA
Executed
Grand
Total
(MW)* Study
w/
PL
(MW) w/
PL
(MW) (MW) FIS
Pending
(MW)***
(MW)** (MW)
Gas-‐AllOther 200 0 3,712 0 4,017 1,591 9,520
Gas-‐CombinedCycle 1,480 0 3,283 0 6,984 1,715 13,462
Total
Gas 1,680 0 6,995 0 11,001 3,306 22,982
Nuclear 0 0 0 0 0 0 0
Coal 0 0 0 0 240 0 240
Wind 2,328 0 11,684 0 5,847 5,092 24,951
Solar 1,540 0 3,957 0 956 1,309 7,762
Biomass 0 0 0 0 0 0 0
Storage 0 0 320 0 324 0 644
Petroleum
Coke 0 0 0 0 0 0 0
Total 5,548 0 22,956 0 18,368 9,707 56,579
*
Confidential
project
i nterconnection
requests
per
Protocol
Section
1.3.1.1(l).
If
capacity
for
a
single
project
i s
reported
i n
the
column,
the
capacity
value
**
Public
project
i nterconnection
requests;
waiver
of
confidential
i nformation
received
by
ERCOT
("Public
Letter").
***
Redacted
project
c apacity
from
c olumn
E
i s
excluded
from
the
Grand
Totals.
PUBLIC 20Changing Resource Mix
Other Renewables
0.9% 0.008%
Cogen Coal
11% 22.4%
Coal Gas-Steam
Nuclear 14.8%
8% 25%
Gas-CT/CC
5%
Renewables
Late 1990s 2015 13.8%
Gas-CT/CC Cogen
36.5% 5.3%
Other
Gas-Steam Nuclear 1.4%
50% 5.7%
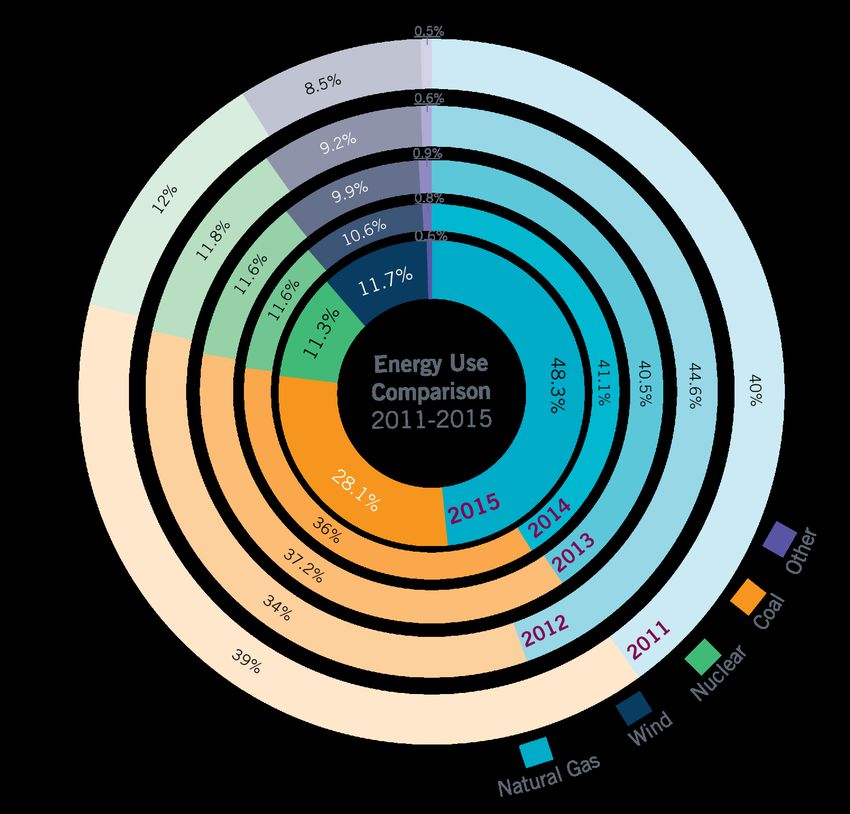
PUBLIC 21Energy Use Comparison PUBLIC 22
Wind Power Queue

                   • Texas is #1 in the U.S. in wind capacity.
                   • Capacity is more than twice the amount of #2 Iowa
                   • If ERCOT Region was a separate country, we’d be #6
                     in the world in wind generation capacity
                   • Peak penetration 48.28%, 3/23/16, 1:10 a.m.
                   • Peak generation 14,023 MW 2/18/16, 9:20 p.m.

PUBLIC                                                               23
Utility Scale Solar Queue PUBLIC 24
Business Case for Utility Scale Solar?

                                         Note: Does not
                                         include DC Tie
                                         imports

PUBLIC                                               25
Business Case for Roof Top Solar?
Mon., Aug. 10, 2015
5:00 PM
ERCOT Load: 69,659 MW
Temperature in Dallas: 107°
Thursday,
March 12, 2015
5:00 PM Residential
ERCOT Load: 32,955 MW 50.4%
Temperature in Dallas: 69°
~37,000 MW of
weather-sensitive
load -- 53% of peak
Residential
26.2% Small Commercial
24.9% • Customer class breakdown
Small Commercial is for competitive choice
29.0% areas; percentages are
extrapolated for munis and
co-ops to achieve region-
Large C&I wide estimate
Large C&I 24.7% • Large C&I are IDR Meter
44.8% Required (>700kW)
• 15-minute settlement
interval demand values
3/16/2015 IE 17:00 8/10/2015 IE 17:00
PUBLIC 26DG snapshot as of Dec. 31, 2015
Total Generation Fleet
From Competitive Choice TDSP annual reports to PUC, plus estimated NOIE DG
DG Capacity based on these reports: 1,101 MW
Capacity from Generation Resources based on Dec. 2015 CDR: 79,280 MW
Units 50kW. NOIEs are not required to report unregistered DG to ERCOT unless >50kW and injects to grid.
PUBLIC 27ERCOT’s 2 primary goals for DERs
• Data Collection
– ERCOT has outlined what data it believes it will need to ensure future
reliability as DER penetration begins to impact the bulk power grid
– Mainly, accurately mapping DERs to the transmission grid
• Market Access
– Integrating some (especially larger) DERs into the energy and Ancillary
Services markets can improve efficiency
– 3 potential categories:
• DER Minimal: Business as usual, what we have today
• DER Light: Passive participation (no ERCOT dispatch) but settled at
the Nodal (local) wholesale price, rather than at the average price at
the Load Zone
– Would require separate metering of gross load and gross
generation
• DER Heavy: Active participation in Energy and AS, much like
Generation Resources today
– Would require:
» Separate metering of gross load and gross generation
» Significant real-time data to ERCOT
PUBLIC 28Reliability Challenges for Solar
• Volatility and uncertainty of fuel source
– Uncertainty in ramp requirements
– Frequency excursions
– Congestion management problems
• Lack of Visibility, Controllability and Dispatchability
– Uncertainty on transmission-level congestion management;
– Load Forecast accuracy
– Uncertainty in Ancillary Service needs
– Less accurate inputs to the State Estimator and Load Adaptation
– Inaccurate Load Distribution Factors (LDFs)
• Evolving state of voltage and frequency standards
– Lower reactive power
– Lower voltage control
– Reduced dynamic response to faults
– Coordination of system restoration
PUBLIC 29Source: http://www.vox.com/2015/6/19/8808545/wind-solar-grid-integration PUBLIC 30
Reliability Challenges From Wind
         •   Large frequency deviations
         •   Inadequate transmission for projected wind growth
         •   Constraint management under high & low wind
         •   Maintaining transient stability
         •   Constraint oscillation
         •   Voltage issue
         •   Increased volatility in prices
         •   Higher ancillary service requirement
         •   Reduced inertial response

PUBLIC                                                           31
Solar Energy Investment Tax Credit (ITC)
Extended
• The Act extends the 30% ITC for solar power facilities, previously available for such facilities
placed in service on or before December 31, 2016, to such facilities where construction
commences on or before December 31, 2019 and which are placed in service before 2024.
• For solar facilities whose construction commences after December 31, 2019, the ITC
decreases. Projects that
– (i) commence construction during 2020 and are placed in service before 2024 are eligible for an ITC of
26%,
– (ii) commence construction during 2021 and are placed in service before 2024 are eligible for an ITC
of 22% and
– (iii) commence construction after 2021 or are placed in service after 2023 are eligible for an ITC of
10%.Changing from a deadline based solely on placement in service to one focused on
commencement of construction was intended to provide facility developers with greater certainty,
although the retention of an outside, hard, placed-in-service deadline of December 31, 2023 will
provide an incentive for developers to follow through to completion once they have satisfied the
“begun construction” guidelines previously released by the Internal Revenue Service. (Technically,
these guidelines will need to be updated by the Service to reflect the dates contained in the new
legislation.)
– Source: 32
http://www.windpowerengineering.com/policy/five-things-you-need-to-know-about-the-
extension-of-the-itcptc/
PUBLICWind Energy Production Tax Credit (PTC)
Extended
• The Act restores PTCs for wind power projects that begin construction before
2020.
• Like the solar ITC, PTCs will be subject to a ratchet down beginning in 2017.
• Projects that begin construction before 2017 are eligible for PTCs for sales of
electricity equal to 1.5 cents per kilowatt, as adjusted for inflation. (For sales
occurring in 2015, the applicable inflation-adjusted rate is 2.3 cents per kilowatt.)
– Thereafter, PTCs will be reduced by (i) 20% for projects beginning construction in 2017;
– (ii) 40% for projects beginning construction in 2018; and
– (iii) 60% for projects beginning construction in 2019.
– These extensions are retroactive to January 1, 2015; thus projects beginning construction in
2015 qualify. It should be noted that, because the PTC is generally available over a 10-year
credit period, the impact of the credit phase-out will be felt over the entire 10-year period in
which the PTCs are available.
33
PUBLICPTC/ITC Option Extended
• The Act extends the right for “qualified investment credit facilities” (as
defined in Code Section 48(a)(5)(C)), including wind power projects, to
opt for an ITC equal to 30% of qualified costs in lieu of PTCs.
• For qualified investment credit facilities other than wind projects, the
election is available for those facilities whose construction has
commenced prior to January 1, 2017.
• In the case of wind power projects, the construction commencement
deadline is extended to January 1, 2020, provided that
– (i) for wind projects beginning construction in 2017, the ITC is reduced to
24%
– (ii) for wind projects beginning construction in 2018, the ITC is further
reduced to 18% and
– (iii) for projects beginning construction in 2019, the ITC is limited to 12%.
34
PUBLICProposed Future Ancillary Services (FAST)
Current Proposed
Regulation Up Regulation Up
Fast-Responding Regulation Up Fast-Responding Regulation Up
Mostly unchanged
Regulation Down Regulation Down
Fast-Responding Regulation Fast-Responding Regulation
Down Down
Fast Frequency Response 1
Fast Frequency Response 2
Responsive Primary Frequency Response
Contingency Reserves 1 SCED-dispatched
Contingency Reserves 2 Manually dispatched
Supplemental Reserves 1 SCED-dispatched
Non-Spin
Supplemental Reserves 2 Manually dispatched
Synchronous Inertial
Response Ongoing development
PUBLIC 35Proposed Responsive Reserves Changes
Types of Descriptions of Products
Products
Fast Frequency Fast Frequency Response (FFR) provides a full MW response within 30 cycles (half a second), slowing
Response 1 (FFR 1) the frequency decay and allowing sufficient time for PFR-capable resources to respond. A resource
providing FFR1 must be able to sustain a full response for maximum of 10 minutes and should fully
restore within 10 minutes of receiving ERCOT’s recall instruction or continuous 10 minutes of
deployment, whichever comes first.
Fast Frequency A response from a resource that is automatically self-deployed and provides a full response within 30
Resource 2 (FFR2) cycles after frequency meets or drops below a preset threshold. FFR may also be manually deployed
and full response must be provided within 10 minutes. FFR Resources based on their sustainability and
ability to restore may participate in sub-group FFR1 or FFR2. A resource providing FFR2 must be able to
sustain a full response until ERCOT issues a recall instruction or the resource no longer has a
responsibility to provide the service, whichever comes first. The resource must be able to fully restore its
FFR2 responsibility within 90 minutes after receiving ERCOT’s recall instruction.
Primary Frequency PFR operates within the first few seconds following the initiating event and is fully delivered within 12 to
Response (PFR) 14 seconds and thus has significant implications on the rate of change of frequency (RoCoF) during
sudden power imbalance.
Contingency Reserves 1 Contingency Reserve provided by Resources available for deployment in SCED, e.g. Generation
(CR1) Resources and Controllable Load Resources (CLR). Can be synchronized and ramped to a specific
output level within 10 minutes.
Contingency Reserves 2 Contingency Reserve provided by Resources not available for deployment in SCED, e.g. non-
(CR2) controllable “blocky” Load Resources. Can be synchronized and ramped to a specific output level within
10 minutes.
PUBLIC 36Proposed Non-Spin Changes
Types of Descriptions of Products
Products
Supplemental Reserves Generation Resources (SR1) that are Off-Line and capable of: Being synchronized and ramped to a
1 (SR 1) specified output level within 30 minutes; and Running at a specified output level for at least one hour; or
Controllable Load Resources (SR1) qualified for Dispatch by Security-Constrained Economic Dispatch
(SCED) and capable of: Ramping to an ERCOT-instructed consumption level within 30 minutes; and
Consuming at the ERCOT-instructed level for at least one hour.
Supplemental Reserves Non-Controllable Load Resources (SR2) which are manually deployed and are capable of: Delivering
2 (SR 2) their demand response within 30 minutes; and Sustaining the response for at least one hour. Once
recalled, Resource providing SR2 should be capable of restoring its SR2 responsibility, within 180
minutes for it to be qualified as SR2.
Synchronous Inertial SIR is stored kinetic energy that is extracted from the rotating mass of synchronous machines following
Response (SIR) a disturbance in a power system. SIR is not included in the proposed future AS framework and the draft
NPRR.
PUBLIC 37Load Participation in SCED
• Eligibility to participate: LSE QSEs representing Load Resources capable of
following 5-minute SCED base point instructions
§ Existing or new single-site Controllable Load Resources (CLRs)
ü SCED qualification will be a new attribute for redefined CLR
§ Aggregate Load Resources (ALRs) composed of multiple sites within
single ERCOT Load Zone (subset of CLR)
• Will not support direct participation by third-party DR QSEs
• Will not support DR with temporal constraints or block energy bids
§ If LR’s bid is on the margin, base point instructions could require LR to
move up or down incrementally every 5 minutes to any level between
its LPC and MPC
§ SCED will honor LR’s telemetered ramp rates
PUBLIC 38Load Participation in SCED(cont.)
• QSEs with LRs in SCED will submit Bids to buy (not Offers to sell)
§ Bids will reflect LR’s willingness to consume “up to” a specified five-
minute Load Zone LMP
§ May be a curve or a MW bid at single strike price
• Bid will modify the SCED demand curve and have ability to set price
§ SCED Generation to be Dispatched (GTBD) will be adjusted to
accommodate LR participation
§ This will ensure proper price formation and reduce the likelihood of
oscillating dispatch instructions
• Bids from LRs capped at the System Wide Offer Cap
§ This is to avoid stranded AS and PRC
• ‘Bid to buy’ creates settlement outcomes equivalent to the “volumetric
flow” LMP minus G methodology endorsed by TAC, while avoiding need
for ERCOT to “send back” the DR value to the LSE
• SCED will dispatch LRs for power balance and congestion management
using the applicable Load Zone Shift Factor
PUBLIC 39Load Participation in SCED(cont.)
• LR benefits and opportunity:
§ Avoided cost of consumption above specified price
§ Price certainty due to ERCOT dispatch
§ Eligibility to provide Non-spin
ü Treated similarly to Offline Generation providing Non-spin
ü Energy Bids will be released to SCED within 20 minutes
following ERCOT deployment of Non-spin
§ Eligibility to receive ORDC payments/charges
ü ORDC price adders will be paid to QSE for any un-deployed
SCED capacity in excess of AS responsibility
ü QSE will be charged for AS capacity converted to energy by
ERCOT
• Market impacts:
§ LR Bids may set price in the RTM
§ No make-whole payments
§ No load ratio share uplifts to market for DR value
PUBLIC 40LiSCED-SCED Objective & Power Balance
SCED optimization will minimize cost of dispatch of supply and maximize revenue
from demand while meeting Power Balance
Minimize { Sum(OfferPricegen * BasePointgen) – Sum(BidPriceCLR * BasePointCLR) }
• BasePointgen is instruction on how much to produce
• BasePointCLR is instruction on how much to consume
• NPFCLR is current telemetered real power consumption
• All Resources can follow 5 minute SCED Base Points
• Power Balance Constraint:
Supply=Demand
Supply = Sum (BasePointgen)
Demand = GTBD = Inelastic Demand + Elastic Demand
Inelastic Demand = GTBD - Sum(NPFCLR)
Elastic Demand = Sum (BasePointCLR)
Sum (BasePointgen) = GTBD - Sum(NPFCLR) + Sum (BasePointCLR)
PUBLIC 41LiSCED: CLR with Bid to Buy
$/MWh
Demand Curve
t,t+25 t+15 Supply Curve
t+20 t+5
t+10
300
200
50
MW
59 K 60 K 62 K
PUBLIC 42You can also read