A Usability Inspection Expert System based on HE, GRY and GST
←
→
Page content transcription
If your browser does not render page correctly, please read the page content below
A Usability Inspection Expert System based on HE, GRY and GST
                                     Chunwei Chen

           A Usability Inspection Expert System based on HE, GRY and GST
                                           Chunwei Chen
          Department of Technological Product Design, Ling Tung University, Taiwan, R.O.C.,
                                     chenschool@yahoo.com.tw

                                                                Abstract
          Usability is a key ingredient of a successful product. A method for quickly and accurately
      capturing usability problems is important for the product development process. This study proposes a
      Usability Inspection Approach (UIA) to evaluate the usability problems of a product. We chose a
      walker as our case study. The UIA adopts the “heuristic evaluation method (HE)”, “grey structural
      modeling (GSM)” and “grey system theory (GST)” in evaluating a usability problem process. The
      HE is used to generally determine the usability problems of a product, the GSM is used to precisely
      establish the representation relationship among the inspected usability problems from HE and the
      GST is used to effectively weigh the importance of the usability problems. Furthermore, for practical
      concerns, a user-friendly usability expert inspection system was developed based on the proposed
      UIA.

                   Keywords: Usability, Usability Problem Inspection, Heuristic Evaluation Method,
                                          Grey Structural Modeling, Grey System Theory

      1. Introduction
          Currently, usability is an increasingly important factor that influences the success or failure of a
      product. Whether a product is easy to learn or use can determine a consumer’s choice between two
      similar but competing products. Emphasizing usability in the product development process is not only
      a “need” but also a “must” for every company.
          The term usability was originally derived from the term “user friendly” [2-3]. However, the term
      “user friendly” has acquired a host of undesirable vague and subjective connotations [4]. Therefore, the
      term ‘‘usability’’ was suggested to replace the term “user friendly” [2-3].
          Usability inspection is performed when evaluating the performance of a product. At present, the
      main challenges for usability inspection are accurately depicting and subsequently capturing a
      product’s usability problems. As such, this study aims to present a Usability Inspection Approach
      (UIA) to accurately evaluate usability problems. The UIA is based on the “heuristic evaluation
      method (HE)”, “grey structural modeling (GSM)” and “grey system theory (GST)”. To facilitate the
      usability of our proposed evaluating model, we developed a user-friendly usability inspection expert
      system. With this expert system, product designers can easily evaluate a product’s usability and
      develop new products based on the obtained information.
          The structure of this study is as follows: Section 2 gives a background review of exiting usability
      inspection methods. Section 3 illustrates the methodology. Section 4 explains the implementation
      details of the UIA. Section 5 presents the proposed usability inspection expert system. Finally,
      conclusions are given in Section 6.

      2. Background Review of Exiting Usability Inspection Methods
          Zhang [31] identified three types of usability inspection methods: testing, inspection and inquiry
      [28]. The usability testing method is an approach used to provide direct information about how people
      use systems and their exact problems with a specific interface/product. The usability testing approach
      requires that representative users work on typical tasks using the system or the prototype. The
      evaluators use the results to see how the user interface supports the users when performing their tasks.
      The testing methods include the coaching method [13], co-discovery learning [8, 13, 15], performance
      measurement [13, 17], the question-asking protocol (Dumas and Redish, 1993), remote testing [13, 16],
      retrospective testing [13], the teaching method [21] and the thinking aloud protocol [13].

International Journal of Intelligent Information Processing(IJIIP)
Volume3. Number1. March 2012.
doi: 10.4156/IJIIP.vol3.issue1.1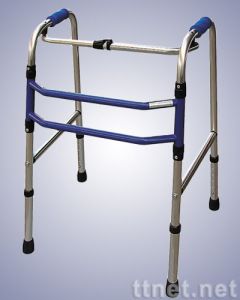
A Usability Inspection Expert System based on HE, GRY and GST
                         Chunwei Chen

    The usability inspection method is an approach for identifying usability problems and improving
the usability of an interface/product design by checking it against established standards. The usability
inspection approach requires usability specialists or software/product developers, users and other
professionals to examine and judge whether each element of a user interface or prototype follows
established usability principles. Commonly used inspection methods include heuristic evaluation [14],
cognitive walkthrough [16, 18, 19, 27], feature inspection [14], pluralistic walkthrough [5],
perspective-based inspection [29, 30] and standards inspection/guideline checklists [28].
    A usability inquiry requires usability evaluators to obtain information about users’ likes, dislikes,
needs and their understanding of the system by talking to them, observing them using the system for
actual work (not for the purpose of usability testing) or letting them answer questions verbally or in
written form. Some inquiry methods include field observation [13], interviews/focus groups [13],
surveys [1], logging actual use [13] and proactive field study [13].
    Holzinger [9] provided a comparison of the aforementioned usability inspection methods in
accordance with five specific dimensions (Table 1). These are applicably in phase, required time,
required users, required evaluators, required equipment, required expertise and intrusiveness.
According to the comparison and the definitional description of the exiting usability inspection
methods, it is clear that most of the exiting methods only focus on the technologies with widely
inspecting various usability problems rather than evaluating the type and the order of importance of the
inspected problems. This makes that accurately recording and subsequently reporting usability
problems become a challenge for usability inspection. To solve the problems of exiting inspection
methods, a promoted usability inspection method combining the hybrid technologies of typically
inspecting usability and an analysis of the type and the order of importance of the inspected problems
is greatly needed.

        Table 1. Comparison of exiting usability inspection methods (source: Holzinger [9])
                  Heuristic     Cognitive        Action     Thinking        Field       Question-
                 Evaluation    Walkthrough Analysis          Aloud      Observation       naires
Applicably In        all             all         design      design     final testing        all
   Phase
Required Time       low          medium           high        high        medium            low
Needed Users       none            none           none         3+            20+            30+
  Required           3+              3+            1-2          1             1+              1
 Evaluators
  Required          low             low           low         high        medium            low
 Equipment
  Required        medium            high          high      medium          high            low
  Expertise
  Intrusive          no              no            no         yes            yes             no

     In this study, a Usability Inspection Approach (UIA) based on the “heuristic evaluation (HE)”,
“grey structural modeling (GSM)” and “grey system theory (GST)” is generally proposed. For UIA,
GST is adopted to analyze the importance of usability problems due to its superiority in evaluating
the importance order of data. GSM is used because of its ability to accurately analyze the
representation of data. Finally, the HE is used for the wildness of its reporting of usability problems.

3. Methodology
    Heuristic Evaluation (HE) is the most common usability inspecting method. It involves having
usability specialists judge whether each product follows established usability principles [13, 14]. The
original approach of HE is for each individual evaluator to inspect the product alone. The evaluators
are allowed to communicate and aggregate their findings only after all of the evaluations have been
completed. There are different versions of HE, for example, some have cooperative characteristics.
The heuristics must be carefully selected so that they specifically reflect the inspected system.
A Usability Inspection Expert System based on HE, GRY and GST
                          Chunwei Chen

Usually 3–5 expert evaluators are necessary (increasing the cost of the technique); less-experienced
people can perform an HE, but the results are not as good. However, HE using non-experts is
appropriate at times depending on who is available to participate. In this study, an HE is used to
report the usability problems of an evaluated product.
    Grey Structural Modeling (GSM) is s system modeling approach based on grey theory [10-12].
GSM shares many of its features with ISM (Interpretive Structural Modeling) and FSM (Fuzzy
Structural Modeling), which often resolve problems into several elements (factors). GSM allows one
to draw a directed graph (i.e., digraph) of m elements by using three parameters: distinguish
coefficient ζ, which decides the basic composition of the digraph; class coefficient θ, which gives the
hierarchy; and path coefficient ψ, which gives an ordered pair of element arrows (Figure 1). GSM
handles not only causal binary relations but also the observed value when causality is unknown. The
GSM scheme has the following advantages: (1) it is compatible with ISM and FSM; (2) it is not only
able to deal with data with a binary relation but also observed data; and (3) it is possible to avoid a
cyclic path or loop in the digraph. In this study, GSM is used to analyze the representative
relationship of usability problems using its directed graph.

       Figure 1. GSM procedure of given elements space to hierarchy (source: Yamaguchi , [10])

    GST [6-7] was developed to verify the relationships among factors in an observable system in
which the information available is uncertain and incomplete. It has been successfully used in a wide
range of fields to use incomplete known information to explore unknown information. In this study,
we adopt the GM(1,N) model of GST to solve the relative influence weighting of usability problems
on products’ images where the collected data are essentially grey.
   The details of three aforementioned schemes used in this study are given in the following.

3.1.Grey Structural Modeling

    GSM is based on grey theory [10-12] and was developed from ISM. ISM is a simple system
modeling approach that uses only 0 and 1 as casualty values of given elements. The basic premise of
an ISM is to decompose the problem (i.e., the user’s practical experience and knowledge) into several
elements (factors) (Warfield, 1976). Because the ISM technique is founded in graphic theory, the
relationships among the decomposed elements of a problem can be transformed into a hierarchical
directed graph (i.e., digraph) [22-25]. Nagai [12] found that a digraph is difficult to draw using ISM if
some causalities remain unknown. However, the digraph can be drawn according to an order from the
reference sequence known as the grey relational grade. Therefore, GSM is proposed to resolve
problems from given un-causality elements. In GSM, the classes and paths of a digraph both use the
grey relational grade. The general format of a GSM model is
A Usability Inspection Expert System based on HE, GRY and GST
Chunwei Chen
a11 a12 a m1
a a m 2
A 21
a 22
a ij
a m1 a m2 a mn
(1)
where i, j 1,2, , m , si Rs j aij 1, si R s j aij 0
This matrix provides an initial impression of how and in what order the risk factors (i.e., usability
problems) might ultimately be correlated. It is constructed by asking questions like “Do you prefer
ij 1 ij 0
Factor ei to Factor ej?” If the answer is “Yes”, then ; otherwise ; and if not sure,
ij 0 1 .
xi si
Definition 1. Let be an inspected vector of as relationship information. This vector is
described as
xi (ai1 , ai 2 , , aij , , aim ) T
(2)
When GSM is used on an observed value and not a relationship, observation items are added to
given system.
Definition 2. Let T be a set of observation items, and t is an element of T . The observed value
xik is given by the ordered pair ( s i , t k ) S T , and the inspected vector xi is described as
x i ( xi1 , xi 2 , , xik , , x in ) T
(3)
where k 1,2, , n .
Definition 3. Reference vector x0 , which is the top (goal or destination) of a given system is
described as follows:
x0 ( x01 , x02 , , xon )T (4)
where n m use inspected vectors Def. 1,
nm use inspected vectors Def. 2.
Grey relational analysis is one of the important methods in GSM. This study uses
Nagai-Yamaguchi’s grey relational analysis because GSM is required to determine the topology of
given factors and place them into the digraph. A localized grey relational grade is given as follows:
max x0 xi
x0 xi
i
0i
max x0 xi
min x0 xi
i i (5)
where : Distinguish coefficient ( 1 ) is
n
x y
x y
i i
i 1
(6)
globalization grey relational grade is also given as
xi x j
ij 1
max max xi x j
i j
(7)
both grey relational analyses are consistent with the following three properties.
1. x 0
2. x x ,
where R
x y x y
3.
The steps for drawing the digraph are shown as follows:
Step 1. Let G be a digraph that is created with GSM and described as
G {C , P} (8)A Usability Inspection Expert System based on HE, GRY and GST
Chunwei Chen
where
C: Hierarchical Class Set
P: Path Set.
GSM has two procedures that are used to obtain C and P.
s, j
Step 2. The set Ci , which has elements as candidates of same hierarchical class, is called a
C
hierarchical class set. Each i is given as follows
Ci {si eij }
(9)
where : Class coefficient (0 1) ,
eij 0i 0 j , 0 eij 1, eii 0
(10)
Proposition 1. Every Ci has at least one unique element.
s
Proof: Each Ci has at least an element i . eii is always consistent, although 0
C Q
Step 3. For the two sets Ci and j , a multi-hierarchical class set ij is defined as
Qij Ci C j
(11)
C
Step 4. Each element of i is placed if the following two conditions are satisfied.
1. card { } min
C Cj
2. i for all j
Every given element has an order from x0 , according to the localized grey relational grade. In
Def. 5, m hierarchical class sets equal to given elements are obtained, such as {C1, C2 , , Cm }
si , s j e 0 j
where are same hierarchical class if ij because 0i . Any s is included over 2
Q
classes if ij .
Ci of Ci C j is removed in advance. Ci , which is consistent with Step 4, does not have Q
or card { Q } is minimal, then all elements of Ci are placed in the same hierarchical class. A
hierarchy of each class is considered with the localized grey relational grade. The placed element is
emptied from each class, and the next placed class is found according to the continuity of Def. 7. The
stop condition of this process is
m
C i
i 1 (12)
( si , s j ) S S
Step 5. Path set P is a set of the ordered pair and has directive paths (arrows) as
follows:
P {( si , s j ) ij , 0 j 0 j }
(13)
where
: Path coefficient (0 1)
: Grey relational matrix, which is obtained by a globalization grey relational analysis as
11 12 1m
22 2 m
21
ij
m1 m 2 mm (14)
Proposition 2. A path set P is obtained uniquely with path coefficient .
0 ij 1
Proof: Every element of grey relational matrix becomes , and every diagonal element
always becomes ii 1 . Therefore, path set P is obtained uniquely though ψ =1.A Usability Inspection Expert System based on HE, GRY and GST
Chunwei Chen
Step 6. The ordered pair ( si , sk ) is called a grey transitive pair if the following condition is satisfied
( s , s ), ( s j , sk ), ( si , sk )
for the three pairs i j .
( *i * j ) ( * j * k ) ( *i * k )
(15)
where the grey transitive pair is required to be consistent with the transitive law as shown in the
following:
1. Reflexive law:
*i *i xi xi
2. Anti-symmetrical law:
ij ji xi x j , x j xi xi x j
3. Transitive law:
*i * j , * j *k *i *k
xi x j , x j xk xi xk
where i j k
3.2.Grey System Theory
GST is based on the assumption that a system is uncertain and that the information regarding the
system is insufficient to build a relational analysis or to construct a model to characterize the system
[6-7]. The grey system sets each stochastic variable as a grey quantity that changes within a given
range. It does not rely on a statistical method to deal with the grey quantity. It deals directly with the
original data and searches the intrinsic regularity of the data [20, 26]. The GST includes the following
fields: (a) grey generating, (b) grey relational analysis, (c) grey forecasting, (d) grey decision making,
and (e) grey control.
In the grey system, the irregular data are transformed into new data sets with strong regularity by
using a data generation scheme called the accumulated generating operation (AGO). When the data
are accumulated more often, the data series can be more evidently described by the exponential
function.
The general format of the grey system model is
d M x1( i ) ( k ) d M 1 x1( i ) ( k )
M
a1 M 1
aM x1( i ) ( k )
dt dt
b2 x2( i ) ( k ) b3 x3( i ) ( k ) bN x (Ni ) ( k ) , (16)
where M is the order of the differential equation and N is the number of the types of the data.
Equation (1) is called a grey dynamic model and is commonly denoted as GM(M,N). The coefficients
of the model are estimated by the least-squares method. In this research, the GM(1,N) model is used
to describe the weighting influence of usability problems that are determined from HE.
(0 )
Considering the sequences xi ( k ) in which x1( 0 ) ( k ) are the target factors in the system
(0 ) (0 ) (0 )
(dependent variables, i.e., product images) and where x2 ( k ), x3 ( k ),..., x N ( k ) represent
the major influence factors in the system (independent variables, i.e., usability problems), the
GM(1,N) model can be defined as
N
x1( 0 ) ( k ) a1 z1( 1 ) ( k ) b j x(j1 ) ( k ) , k=1,2,3,…,n. (17)
j 2
The manipulation procedures for GM(1,N) are as follows.
Step 1. Build the initial sequences:
xi( 0 ) ( k ),i 1,2 ,3 , N and k=1,2,3,…,n. (18)
Step 2. Generate the new sequences xi( 1 ) ( k ) using the AGO method based on the above initial
sequences:A Usability Inspection Expert System based on HE, GRY and GST
Chunwei Chen
( i ), x ( 0 ) ( i ), , x ( 0 ) ( i )} , (19)
1 2 3 n
AGO { x ( 0 ) } x ( 1 ) { x ( 0 ) ( i ), x
(0 )
i 1 i 1 i 1 i 1
where
k
x (j 1 ) ( k ) x ( 0 ) ( i ) , j=1,2,3,…,N. (20)
i 1
Step 3. Assume the following first-order differential equation holds true:
d x1( 0 ) ( k )
ax1( 1 ) ( k ) b2 x2 ( k ) b3 x3 ( k ) bN x N ( k )
(1) (1) . (1) (21)
dt
Step 4. Solve Eq. (21) using difference approximation and combine it with Eq. (22) to yield
N
x1( 0 ) ( k ) az1( 1 ) ( k ) b j x (j 1 ) ( k ) , (22)
j 2
where
z1( 1 ) ( k ) 0.5 x1( 1 ) ( k ) 0.5 x1( 1 ) ( k 1 ) . (23)
Rearrange Eq. (24) in matrix form as
YN Bâ , (24)
where
YNT x1( 0 ) ( 2 ) x1( 0 ) ( 3 ) x1( 0 ) ( 4 ) x1( 0 ) ( n ) , â T a b2 b3 bN ,
and
z1( 1 ) ( 2 ) x2( 1 ) ( 2 ) x (N1 ) ( 2 )
(1) . (25)
z ( 3 ) x2 ( 3 ) x N ( 3 )
(1) (1)
B 1
z ( n ) x ( n ) x ( n )
( 1 ) ( 1 ) ( 1 )
1 2 N
^
Step 5. Estimate a by using the least-squares error method as
^
a ( BT B )1 BT YN . (26)
Therefore, the influence ranking of the major sequences on the target sequences can be found by
comparing the norm values of b2 ~ bN .
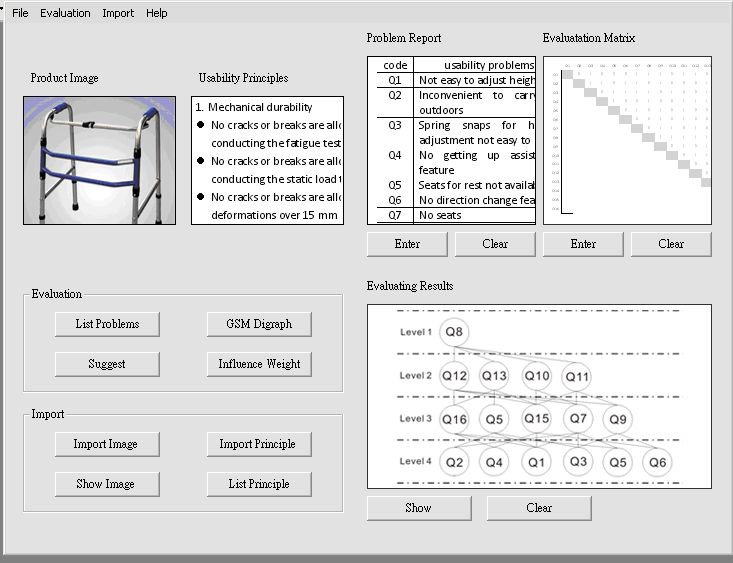
3.3.Usability Inspection Expert System
The procedure of our proposed hybrid Usability Inspection Expert System (UIES) in conjunction
with HE, GSM and GST is presented in Figure 2. Initially, the evaluated product is presented as a
black and white picture on the left side of the screen, and the usability principles are shown on the
right side of the product image. Subsequently, according to the usability principles, the product
design expert begins to key in the usability problems of the target product into the right side of the
screen. Meanwhile, the drawn usability problems are automatically coded, and the usability problems
relation evaluation matrix and the inflence weight evaluation matrix are also set. Then, the product
design expert begins to evaluate the problems’ representation relationships as well as their
importance order using an evaluation matrix. These evaluation data are further applied to GSM and
GST schemes to establish the usability problems directed graph and the influence weight of the
usability problems. In the end, UIES suggests the key usability problems in accordance with the
directed graph and the influence weight using the following princple: when the problem has a higher
postion in the usability problems directed graph and has a greater influenece weight, the problem
becomes increasingly more representative and important.A Usability Inspection Expert System based on HE, GRY and GST
Chunwei Chen
Figure 2. Hybrid Usability Inspection Expert System (UIES)
Table 2. Usability principles of walker
1. Mechanical durability
No cracks or breaks are allowed for any components of the walker when conducting the fatigue test
in compliance with Section 4.3.
No cracks or breaks are allowed for any components of the walker when conducting the static load
test in compliance with Section 4.4.
No cracks or breaks are allowed for any legs of the walker or permanent deformations over 15 mm
measured from the end when conducting the static load test for the leg strength in compliance with
Section 4.5.
2. Stability
The plane angle of a tipped walker should not be less than 10.0 degrees when conducting the
forward tipping stability test in compliance with Section 4.6.
The plane angle of a tipped walker should not be less than 7.0 degrees when conducting the
backward tipping stability test in compliance with Section 4.7.
The plane angle of a tipped walker should not be less than 3.5 degrees when conducting the lateral
tipping stability test in compliance with Section 4.8.
As reciprocating walkers can’t meet the requirements for lateral stability, manufacturers need to
evaluate risk analysis of instability and provide proper guidance and warnings of use limitations.
3. Operability
The maximum width of walkers for home use shall not be more than 650 mm.
The walking width of reciprocating walkers shall not be less than 90% of the maximum width.
4. Grips
The width of grips should be between 20 mm and 50 mm.
Note: this regulation is not applicable to handgrips.
Grips should be replaceable and easy to clean.A Usability Inspection Expert System based on HE, GRY and GST
Chunwei Chen
5. Legs and stoppers
Manufacturers should provide a design of stoppers on the ends of the legs and they won’t be passed
through by the legs under expected circumstances of use. Refer to Section 3.1.
Stoppers should be replaceable.
Stoppers should not discolor the walking ground by visual inspections.
A diameter of 35 mm at least should be maintained between the stoppers and the area on the walking
ground they contact, which can be verified by visual inspections.
6. Adjustment device
The maximum allowable extension has to be specified for adjustment of each height.
Upon completion of the fatigue test in Section 4.6, the folding/height adjustment device has to be
operated in the way the manufacturer claims.
Walkers of the folding type need to be locked in use mode after opening.
7. Material and final processing
In consideration of the purposes of walkers and possible contact of the care givers with the walkers,
transportation and storage of walkers and the bio-compatibility of the materials that come into
contact with human bodies shall be evaluated in compliance with CNS14393-1 (Biological
evaluation of medical devices - Part 1: Evaluation and testing).
4. Usability Inspection Apporach Procedures: A Case Study
4.1.Usability Problems Reporting
(1) Experimental evaluators
The experimental study involved 5 experimental evaluators who have 10-15 years of experience
in product development. The evaluators’ average age is 41.4 years.
(2) Experimental samples
Here, we chose an existing walker (Figure 3) as our experimental sample (demonstration target).
However, the proposed methodologies can be applied to other products.
(3) Usability principles
Figure 3. Experimental sampleA Usability Inspection Expert System based on HE, GRY and GST
Chunwei Chen
We adopted CNS (Chinese National Standard) 15307 for the walkers (Table 2) as our usability
principles. There were twenty design principles.
(4) Usability problem reporting
First, each individual evaluator, by him/herself, noted the usability problems of the experimental
sample in accordance with the 20 usability principles. After all of the evaluations of the five
evaluators were completed, the reported usability problems were coded and listed in a table. For the
experimental sample, the walker, sixteen usability problems were reported (shown in Table 3).
Table 3. Usability problems of walker
code usability problems Code usability problems
Q1 Not easy to adjust height Q9 A slightly bigger size for outdoor
use
Q2 Inconvenient to carry to Q10 Easy to tip sideways
outdoors
Q3 Spring snaps for height Q11 Loose joints after use for a long time
adjustment not easy to clip
Q4 No getting up assistance Q12 Loose nuts of joints
feature
Q5 Seats for rest not available Q13 Inconvenient to use at night
Q6 No direction change feature Q14 No lighting
Q7 No seats Q15 No reflective stickers for safety
Q8 Seats for rest not available Q16 Can’t go up or down the stairs
(5) Representation evaluation matrix
To analyze the representation of those reported usability problems, the representation evaluation
matrix (Figure 4) was established, using the matrix set as in Eq. (1). Then, all of the evaluators
manipulated the representation evaluation matrix by answering questions such as, “Do you prefer the
usability problem ei be replaced in terms of the usability problem ej?” If the answer is “Yes”, then
ij 1 ij 0
; otherwise, . Figure 5 shows the initial impression results of the 16 usability
problems.
Q1 Q2 Q3 Q4 Q5 Q6 Q7 Q8 Q9 Q10 Q11 Q12 Q13 Q14 Q15 Q16
Q1
Q2
Q3
Q4
Q5
Q6
Q7
Q8
Q9
Q10
Q11
Q12
Q13
Q14
Q15
Q16
Figure 4. Formate of representation evaluation matrix and importance order evaluation matrixA Usability Inspection Expert System based on HE, GRY and GST
Chunwei Chen
(6) Importance order evaluation matrix
For the importance order evaluation, the importance order evaluation matrix should also be
established using Eq. (1). The evaluators used a 7-point scale (1-7; 1 is the least important and 7 is
the most important) of the SD method to evaluate the importance of the usability problems. Figure 6
shows the importance order result for the walker.
4.2.Directed Graph Drawing
According to the aforementioned grey relational analysis model and the representation evaluation
results (shown in Figure 5), the usability problems directed graph can be drawn using Eq. (8) - Eq.
(15). Figure 6 shows the directed graph of the 16 usability problems. Figure 7 shows that X 8 is the
most representative usability problem of the walker.
Q1 Q2 Q3 Q4 Q5 Q6 Q7 Q8 Q9 Q10 Q11 Q12 Q13 Q14 Q15 Q16
Q1 0 1 0 0 0 1 1 1 0 1 1 0 0 0 0
Q2 1 1 0 1 1 0 1 0 0 0 1 0 0 1
Q3 0 1 1 1 1 0 1 0 0 1 0 0 1
Q4 1 0 0 1 0 0 1 1 1 1 1 0
Q5 0 1 0 1 0 1 0 0 1 1 0
Q6 0 0 1 0 1 0 0 1 1 0
Q7 0 1 1 0 1 0 1 1 0
Q8 1 1 1 1 1 0 0 1
Q9 0 1 0 1 1 0 0
Q10 0 1 1 0 1 0
Q11 0 0 0 0 1
Q12 0 1 1 1
Q13 1 1 0
Q14 1 1
Q15 0
Q16
Figure 5. Initial impression results of representation evaluation matrix for walker
Figure 6. The GSM digraph of the 16 usability problems
4.3. Influence Ranking
According to the aforementioned GM(1,N) model and the important order evaluation result
(shown in Figure 7), and by using all of the usability problems X1~X16 as the original variables
(0)
x 2( 0 ) ~ x 17
and the product image as the dependent variable x1( 0 ) , the influence coefficient
matrix â can be obtained from Eq. (19). For the experimental sample ( Y1 ), the influence weighting
of the 16 usability problems is obtained as b1 =9.83, b2 =-8.82, b3 =-8.01, b4 =-3.12, b5 =-5.41,
b6 =3.18, b7 =11.19, b8 =-12.56, b9 =11.2, b10 =-7.13, b11 =-10.82, b12 =6.52, b13 =-9.71,
b14 =-11.08, b15 =-8.19 and b16 =9.32. By normalizing each value via the formulaA Usability Inspection Expert System based on HE, GRY and GST
Chunwei Chen
7
r* ( X j ) b j / bi , the resultant rank sequence of the usability problems can be obtained:
i 1
r ( X8) r* ( X12) r* ( X11) r* ( X 3) r( X 4) r( X 7) r( X 5)r* r( X17) r* ( X 9) r* ( X1)
*
r* ( X 6) r( X16) r( X14) r* ( X10) r* ( X 2) r* ( X 6) r( X13).
From the above rank sequence results, it is seen that usability problem ( X 8 ) has the greatest
influence on the walker.
Q1 Q2 Q3 Q4 Q5 Q6 Q7 Q8 Q9 Q10 Q11 Q12 Q13 Q14 Q15 Q16
Q1 1 2 3 4 2 1 3 3 4 5 5 4 3 2 1
Q2 2 1 1 2 3 4 4 5 5 4 3 2 2 4
Q3 3 3 2 4 2 2 3 1 1 1 2 3 3
Q4 1 5 4 5 2 1 1 1 2 2 3 3
Q5 1 1 6 1 2 2 2 2 3 4 4
Q6 2 5 4 5 6 7 5 6 2 1
Q7 6 2 3 2 6 4 4 4 3
Q8 1 1 2 3 1 1 2 1
Q9 1 1 1 2 2 3 4
Q10 4 4 5 2 1 1
Q11 1 1 1 1 1
Q12 1 2 2 1
Q13 2 3 4
Q14 1 1
Q15 1
Q16
Figure 7. Iinitial impression results of importance order evaluation matrix for walker
5. Usability Inspection Expert System
Based on the previously described novel approach, we developed a Usability Inspection Expert
System (UIES). The UIES provides both knowledge acquisition and expert system execution
interfaces. In the UIES, the interface (Figure 8) was built using VB software; the database was
designed using SQL software. This UIES is mainly built for helping user product designers to easily
perform usability problem evaluations. The developed UIES includes a major interface (Figure 9).
The details of the UIES are described as follows.
_
Figure 8. UIESA Usability Inspection Expert System based on HE, GRY and GST
Chunwei Chen
Figure 9. Major interface of UIES
(1) Usability Problems Reporing
In the major interface of UIES, the user first chooses the function “Evaluation”, then the product
image box and usability principles box show a representation of the evaluated product and the
referenced principles. Subsequently, the product designer keys in the usability problems into a
problem report box and pushes the “Enter” button. The usability problems are automatically recorded.
The recorded usability problems are listed and coded when the user pushes the “List Problems” and
“Code Problems” buttons.
(2) Reported Usability Problems Evaluation
To complete the usability problems inspection, the evaluation of the reported problems’
representation and importance order is essential. The UIES also provides convenient “Representation
Evaluation” and “Importance Evaluation” functions that allow the user to easily complete their
usability inspection. The procedures are described as follows. First, the user should choose the
function “Representation” command in the “Evaluation” menu. If the “GSM Digraph” button is
clicked, the hierarchical digraph of the usability problems is drawn and shown in the evaluating
results box. Subsequently, when the user selects the “Importance” command in the “Evaluation”
menu, the influence weight of usability problems is calculated. The influence weight is also shown in
the evaluating results box if the “Influence Weight” button is pushed. According to the hierarchical
digraph and the influence weight, the UIES provides a suggestion for the key usability problems if
the user clicks the “Suggest” button in the evaluation frame. Accordingly, a product designer can
modify and incorporate their solution for important usability problems into the draft of the product to
create a new prototype.A Usability Inspection Expert System based on HE, GRY and GST
Chunwei Chen
6. Conclusion
This work proposed a hybrid UIA that integrates HE, GSM and GST to effectively and accurately
evaluate the usability problems of a product. Based on the modeling results, a UIES was also built.
The conclusions of this study are as follows.
(1) The proposed methodology includes GSM, which embodies the hierarchical and structural
classification functions and provides good representation evaluation.
(2) The proposed methodology includes GST, which can provide important order evaluations of
usability problems on product images. Using GST, reluctant usability problems can be omitted,
thereby enhancing the usability evaluating speed while maintaining evaluation accuracy.
(3) To help product designers with the further refinement and incorporation of creativity or
innovation, a hybrid UIES was developed based on the UIA.
(4) According to the proposed UIES, the designer can easily capture the customer’s usability needs
and evaluate how large the gap between a customer’s viewpoint and a designed product usability
should be.
(5) The results of this study provide useful hybrid insights for designing a product from its usability
problems towards the user’s usability needs. Although a walker was chosen as an illustration of
the approach, the methodology can be applied to other types of products with various usability
problems.
References
[1] Alreck, P.L., Settle, R.B., “The Survey Research Handbook”, Irwin Professional Publishing,
Chicago, IL., 1994.
[2] Bevan, N., “Measuring usability as quality of use”, Journal of Software Quality, vol.4, no.1,
pp.115–140, 1995a.
[3] Bevan, N., Usability is quality of use. In: Anzai, Ogawa (Eds.), “Proceedings of the 6th
International Conference on Human Computer Interaction”, Elsevier, North-Holland, 1995b.
[4] Bevan, N., Kirakowski, J., Maissel, J., What is usability? In: Bullinger, H.J. (Ed.), “Proceedings
of the 4th International Conference on Human–Computer Interaction”, Elsevier, North-Holland,
1991.
[5] Bias, R. The pluralistic usability walkthrough: coordinated empathies. In: Nielsen, J., Mack, R.
(Eds.), “Usability Inspection Methods”, John Wiley and Sons, New York, NY, 1994.
[6] Deng, J.L. “Grey Systems”, China Ocean Press, Beijing, 1988.
[7] Deng, J.L., “Introduction to Grey system theory”, The Journal of Grey System Theory, vol.1,
no.1, pp.1-24, 1989.
[8] Dumas, J.S., Redish, J.A., Practical Guide to Usability Testing. Ablex Publishing, Norwood, NJ,
1993.
[9] Hartson, H.R., Castillo, J.C., Kelso, J., Kamler, J., Neale, W.C., “Remote evaluation: the
network as an extension of the usability laboratory”, Proceedings of CHI’96 Human Factors in
Computing Systems, 1996.
[10] Nagai, M., Yamaguchi, D., “Elements on Grey System Theory and Applications”. Kyoritsu
Shuppan, Tokyo, 2004.
[11] Nagai, M., “Methodology of System Analysis and Design”, Kogaku-Kenkyusha, Tokyo, 1995.
[12] Nagai, M., Yamaguchi, D., Li, G.D., Mizutani, K., “New System Modeling Method Based on
Grey Theory”, IPSJ SIG Technical Report, 2005(40), AL- 101-9, pp.59-66, 2005.
[13] Nielsen, J., “Usability Engineering”, Academic press, San Diego, CA., 1993.
[14] Nielsen, J., Heuristic evaluation, In: Nielsen, J., Mack, R.L. (Eds.), “Usability Inspection
Methods”, John Wiley and Sons, New York, NY, 1994.
[15] Rubin, J., Testing Two Participants at a Time. “Handbook of Usability Testing”, John Wiley and
Sons, New York, NY, 1994.A Usability Inspection Expert System based on HE, GRY and GST
Chunwei Chen
[16] Rowley, D.E., Rhoades, D.G., “The cognitive walkthrough: a fastpaced user interface evaluation
procedure”, In: CHI ’92 Proceedings, 1992.
[17] Soken, N., Reinhart, B., Vora, P., Metz, S., “Methods for Evaluating Usability”, Honeywell,
1993.
[18] Tirapat, T., Achalakul, T., "Usability Assessment for Hyperlink Methods", JCIT: Journal of
Convergence Information Technology, Vol. 2, No. 1, pp ~ 54, 2007.
[19] Toptsis , A A., Emilrazan, J., “Cognitive and Usability Perspectives in Software Platform
Libraries”, Journal of Next Generation Information Technology, Vol. 1, No. 2, pp. 25 ~ 34, 2010.
[20] Tseng, F.M., Tzeng, G.H., Yuan, B., “The comparison of four kinds of prediction methods:
ARIMA, Fuzzy Time Series, Fuzzy Regression Time Series, and Grey Forecasting- An example
of the production value forecast of machinery industry in Taiwan”, 1997 Second Conference on
Grey Theory and Applications, 1997.
[21] Vora, P., Helander, M., A teaching method as an alternative to the concurrent think-aloud method
for usablity testing. In: Anzai, Y., Ogawa, K., Mori, H. (Eds.), “Symbiosis of Human and
Artifact”, 1995.
[22] Warfield, J.N., “On arranging elements of a hierarchy in graphic form”, IEEE-SMC(3),
pp.121–132, 1973.
[23] Warfield, J.N., “An introduction to the application of interpretive structural modeling”,
Proceedings of the IEEE, vol.63, no.3, 397–404, (1975).
[24] Warfield, J.N., “Societal Systems: Planning, Policy and Complexity”, Wiley, New York, 1976.
[25] Warfield, J.N., “A Science of Generic Design: Managing Complexity Through System Design,
Intersystems”, Salinas, CA, 1990.
[26] Wen, K.L., “Grey Systems: Modeling and Prediction”. Yang's Scientific Research Institute,
Tucson, 2004.
[27] Wharton, C., Rieman, J., Lewis, C., Polson, P., The Cognitive walkthrough: a practitioner’s
guide. In: Nielsen, J., Mack, R.L. (Eds.), “Usability Inspection Methods”, John Wiley and Sons,
New York, NY, 1994.
[28] Wixon, D., Jones, S., Tse, L., Casaday, G.., Inspections and design reviews: framework, history,
and reflection. In: Nielsen, J., Mack, R.L. (Eds.), “Usability Inspection Methods”, John Wiley
and Sons, New York, NY, 1994.
[29] Zhang, Z., Basili, V., Shneider-man, B., “An empirical study of perspective-based usability
inspection”, In: Proceedings of the Human Factors and Ergonomics Society 42nd Annual
Meeting, Chicago, 1998a.
[30] Zhang, Z., Basili, V., Shneider-man, B., “Perspective-based usability inspection”, In:
Proceedings of the Usability Professionals’Association Conference, Washington, DC, 1998b.
[31] Zhang, Z. “Overview of usability evaluation methods”, Available from
http://www.cs.umd.edu/~zzj/UsabilityHome.html, 2001.You can also read