INVESTOR PRESENTATION - Q1 2021 Owen Mahoney President and CEO Shiro Uemura CFO - NEXON
←
→
Page content transcription
If your browser does not render page correctly, please read the page content below

INVESTOR PRESENTATION
      Owen Mahoney President and CEO   Shiro Uemura CFO
Q1 2021
      May 12, 2021 NEXON Co., Ltd.

                                                © 2021 NEXON Co., Ltd. All Rights Reserved.   1
CEO Highlights

                 © 2021 NEXON Co., Ltd. All Rights Reserved.   2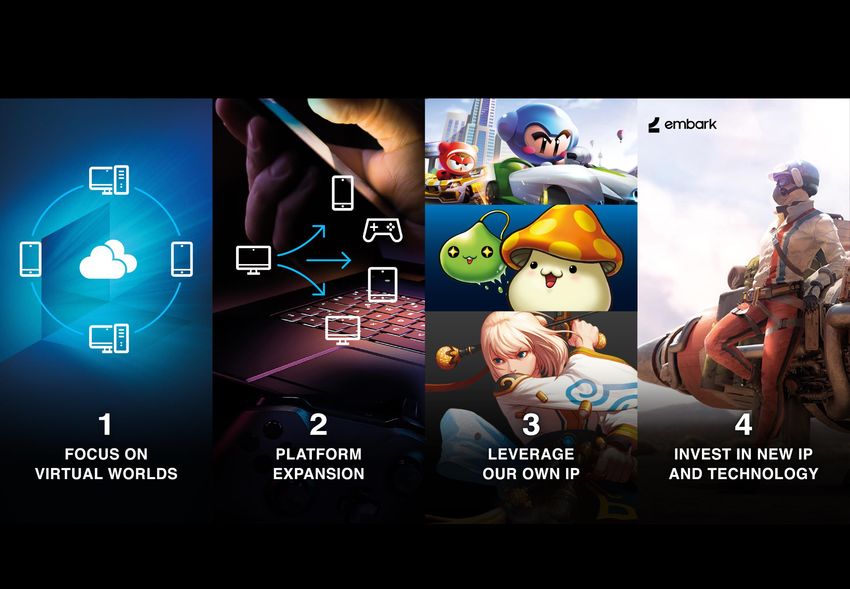
CEO Message Summary

                                                                                                                      -       Driven by the strength of Virtual Worlds
     1                       Delivered strong Q1
                                                                                                                      -       Up 7% as-reported; up 3% in constant currency1

                                                                                                                      -       Steady, if non-linear, growth over years and decades
                             Virtual Worlds offer long-term
     2                       revenue growth
                                                                                                                      -       Nexon is uniquely advantaged with teams experienced
                                                                                                                              in building and growing Virtual Worlds

                             Step-function growth                                                                     -       Preparing launches of new Virtual Worlds like Mobile
                                                                                                                              Dungeon&Fighter, KartRider: Drift and new games from
     3                       opportunities with new
                             Virtual Worlds
                                                                                                                              our Embark Studios
                                                                                                                      -       These provide step-change potential for earnings growth

                                                                                                                      -       Lapping the success of 2020 will be challenging
                                                                                                                      -       Anticipate short-term declines as the world exits the
                             Near-term trends affected by
     4                       several factors
                                                                                                                              pandemic, depending on the region and game
                                                                                                                      -       Committed to providing greater transparency on value
                                                                                                                              probabilities for in-game purchases

1 Constant currency is a non-GAAP measure used to show performance unaffected by fluctuations in foreign currency exchange rates. Constant-currency basis amounts are calculated using the average foreign
  currency exchange rates for the comparable period in the prior year and applied to the current period. As an example, we calculate royalty revenues from China Dungeon&Fighter by applying the same CNY/USD,
  USD/KRW and KRW/JPY exchange rates from last year's same fiscal quarter.
                                                                                                                                                                                                                 © 2021 NEXON Co., Ltd. All Rights Reserved.   3
CFO Highlights

                 © 2021 NEXON Co., Ltd. All Rights Reserved.   4
Q1 2021 Results

                  © 2021 NEXON Co., Ltd. All Rights Reserved.   5
Q1 2021 Result Highlights
Revenue as Planned. Year-over-year Growth Driven by Strength of Major Franchises

Revenues                                                                                             Operating Income                                                         Net Income2
• In-line with expectations. Outperformance in China,                                                Exceeded our outlook primarily driven by                                 Exceeded outlook primarily driven by an ¥18.1
  North America & Europe, and Rest of World1 was                                                     lower-than-planned costs including                                       billion FX gain on U.S. dollar-denominated cash
  offset by below-guidance growth in Korea                                                           payment gateway fee and marketing                                        deposits
                                                                                                     expenses
• Y/Y growth driven by MapleStory, The Kingdom of
  the Winds: Yeon and KartRider Rush+ was partially
  offset by China Dungeon&Fighter

(Unit: ¥ millions, except per share data)                                                                                                                      (Unit: ¥ billions)
                                                                                                                                                                                                                                            2
                                                 Q1 2020                    Q1 2021 Outlook                     Q1 2021              YoY %                              Revenues                Operating Income             Net Income

Revenues                                              ¥82,762             ¥82,770         ~         ¥89,129         ¥88,313                 7%
       3
  PC                                                    65,725              60,326        ~          64,571          65,768                 0%                                       88.3
                                                                                                                                                                     82.8
  Mobile                                                17,037              22,444        ~          24,558          22,545                32%
Operating income                                        41,543              35,265        ~          41,922          43,321                 4%
                  2
Net income                                              49,911              26,019        ~          30,920          46,034               (8%)
                                                                                                                                                                                                                         49.9           46.0
                                                                                                                                                                                                 41.5      43.3
Earnings per share                                        56.57               29.33       ~           34.85            51.86

Exchange rates
    100 KRW/JPY                                            9.15                 9.45                   9.45              9.52               4%
    CNY/JPY                                               15.62               16.00                   16.00            16.33                5%
    USD/JPY                                             108.92              104.17                   104.17          105.90               (3%)                     Q1 2020          Q1 2021     Q1 2020   Q1 2021      Q1 2020        Q1 2021

1 “Rest of World” includes other Asian countries as well as Central and South American countries.              3 PC revenues include other revenues besides PC online games and mobile games.
2 Net income refers to net income attributable to owners of the parent.

                                                                                                                                                                                                             © 2021 NEXON Co., Ltd. All Rights Reserved.   6
Q1 2021 Revenue Breakdown
All Regions Excluding China Grew Y/Y; Korea was Below Our Outlook

Q1 2021 Financial Results                                                                                                                                  Q1 2021 Revenue Breakdown
(Unit: ¥ millions)
                                                                                       Q1 2021                         YoY % Change

                                                                             As-              Constant              As-             Constant
                                                       Q1 2020                                                                                                                   5%
                                                                           Reported          Currency
                                                                                                         4        Reported         Currency
                                                                                                                                                4
                                                                                                                                                                        5%
    Revenue by Region         1                                                                                                                                       4%
                                                                                                                                                                                                                        26%
     Korea                                                ¥39,744               ¥50,167          ¥48,219                  26%               21%
     China                                                  33,499               25,798            24,883               (23%)             (26%)
     Japan                                                   1,567                  3,382           3,304               116%              111%                                   Region1                                            Platform
     North America and Europe                                4,168                  4,814           4,868                16%               17%                   29%                             57%
     Rest of World2                                          3,784                  4,152           4,020                10%                6%
    Nexon Total                                             82,762               88,313            85,294                   7%               3%                                                                                                      74%

    Revenue by Platform
     PC3                                                    65,725               65,768            63,431                   0%             (3%)
     Mobile                                                 17,037               22,545            21,863                 32%               28%
                                                                                                                                                                Region1                                              Platform
    Nexon Total                                             82,762               88,313            85,294                   7%               3%
                                                                                                                                                                     Korea 57%                                           PC3 74%
                                                                                                                                                                     China 29%                                           Mobile 26%
    FX Rate
       100 KRW/JPY                                             9.15                 9.52             9.15                   4%                                       Japan 4%
       CNY/JPY                                               15.62               16.33              15.62                   5%                                       North America & Europe 5%
       USD/JPY                                             108.92               105.90            108.92                  (3%)                                       Rest of World2 5%

1 Based on regions where the revenue originates; not a representation of revenues           4 Constant currency is a non-GAAP measure used to show performance unaffected by               5 For the KPIs (MAU, Pay Rate and ARPPU) of PC online
  according to Nexon entities.                                                                fluctuations in foreign currency exchange rates. Constant-currency basis amounts are           games, please refer to appendix of this presentation.
                                                                                              calculated using the average foreign currency exchange rates for the comparable period in
2 “Rest of World” includes other Asian countries as well as Central and South
                                                                                              the prior year and applied to the current period. As an example, we calculate royalty
  American countries.
                                                                                              revenues from China Dungeon&Fighter by applying the same CNY/USD, USD/KRW and
3 PC revenues include other revenues besides PC online games and mobile games.                KRW/JPY exchange rates from last year's same fiscal quarter.

                                                                                                                                                                                                                           © 2021 NEXON Co., Ltd. All Rights Reserved.   7
Q1 2021 Korea / China – Highlights
Korea                                                                                                                    China
Below outlook primarily due to MapleStory and KartRider Rush+                                                            Exceeded outlook primarily driven by Dungeon&Fighter
• PC1 revenues increased by 21% Y/Y                                                                                      • Introduced Lunar New Year update(1/21 – 4/8)
     ‐     MapleStory: Grew Y/Y driven by the well-received Winter update while                                          • Q/Q MAUs decreased due to the waning effect of Lunar New Year update
           underperforming in the latter part of the quarter. Please see the next                                        • Q/Q paying users remained flat as core paying users continue to stay in the
           page for more details
                                                                                                                           game; the number of paying users in Q1 was higher than our expectation,
     ‐     FIFA ONLINE 42: Grew Y/Y driven by the well-received Lunar New Year                                             which led to slight revenue outperformance
           package offerings and promotions
                                                                                                                         • Q/Q ARPPU and revenue increased due to typical seasonality
     ‐     Dungeon&Fighter (+13%) / Sudden Attack (+56%) : Grew Y/Y
                                                                                                                         • Y/Y MAUs and paying users decreased due to reduced user engagement as
• Mobile revenues increased by 42% Y/Y                                                                                     well as strengthened bot sanctions; ARPPU was roughly flat
     ‐     Strong contributions from The Kingdom of the Winds: Yeon, KartRider                                           • Y/Y revenue decreased due to decrease in active users and paying users
           Rush+, and FIFA MOBILE3
     ‐     Maplestory M: Grew 69% Y/Y

                                                                     YoY% change:                                                                                                                YoY% change:
  (Unit: ¥ millions)
                                                                        As Reported:                 +26%                                                                                          As Reported:                          -23%
                                                                        Constant Currency4:          +21%                                                                                          Constant Currency4:                   -26%

                                                50,526                                    50,167
         39,744                                                       41,913
                            32,797                                                                                                   33,499
                                                26,295                                                  1
                                                                                          35,285   PC                                                                                                                       25,798
                                                                      23,317
         29,240                                                                                                                                           19,219
                            22,362                                                                                                                                              15,769
                                                                                                                                                                            12,753                                                                         1
                                                                                                                                     33,047                                                                                 25,623                    PC
                                                24,231                                                                                            452 18,964 255 15,617 152 12,579 174
                            10,435                                    18,596              14,882   Mobile                                                                                                                                     175 Mobile
         10,504
      Q1 2020               Q2 2020             Q3 2020              Q4 2020             Q1 2021                                    Q1 2020               Q2 2020               Q3 2020               Q4 2020               Q1 2021

1 PC revenues include other revenues besides PC online games and mobile games.                              4 Constant currency is a non-GAAP measure used to show performance unaffected by fluctuations in foreign currency exchange rates.
                                                                                                              Constant-currency basis amounts are calculated using the average foreign currency exchange rates for the comparable period in the prior
2 Official titles are EA SPORTS™ FIFA ONLINE 4 (PC) and EA SPORTS™ FIFA ONLINE 4 M (mobile).                  year and applied to the current period. As an example, we calculate royalty revenues from China Dungeon&Fighter by applying the same
                                                                                                              CNY/USD, USD/KRW and KRW/JPY exchange rates from last year's same fiscal quarter.
3 Official title is EA SPORTS™ FIFA MOBILE.
                                                                                                                                                                                                                  © 2021 NEXON Co., Ltd. All Rights Reserved.   8
Korea MapleStory
Improving Communication and Transparency

  • In late February, MapleStory players pointed out that the                                                                                  − Announced our plan to disclose probabilities for all of our paid
        information available on our game including probabilities                                                                                 probability-based items in our major games in Korea. We have
        associated with unlocking valuable items was not clear enough                                                                             disclosed probabilities of some items and will continue to
        and that there was a lack of communication.                                                                                               disclose more going forward.

  • Related to this, the number of active users, which had stayed                                                                              − Arranged a meeting to receive feedback from key player
        high since the beginning of the quarter, declined beginning in                                                                            influencers and opened a suggestion board where the
        late February.                                                                                                                            development team can respond to questions and suggestions
                                                                                                                                                  from players.
  • We have addressed this issue and announced a policy to
        improve communication, transparency, and to maintain the trust                                                                     • Remain committed to ongoing improvements in transparency and
        of our players.                                                                                                                        communication to provide further assurance of fairness to players

        − Provided compensation to our users in March to April.

1 The letters, graphics, symbols, logos and other marks, and illustrations, characters and other works, which are shown in this material are
  trademarks, registered trademarks, copyrighted works or other legally protected materials owned by respective right holders.

                                                                                                                                                                                               © 2021 NEXON Co., Ltd. All Rights Reserved.   9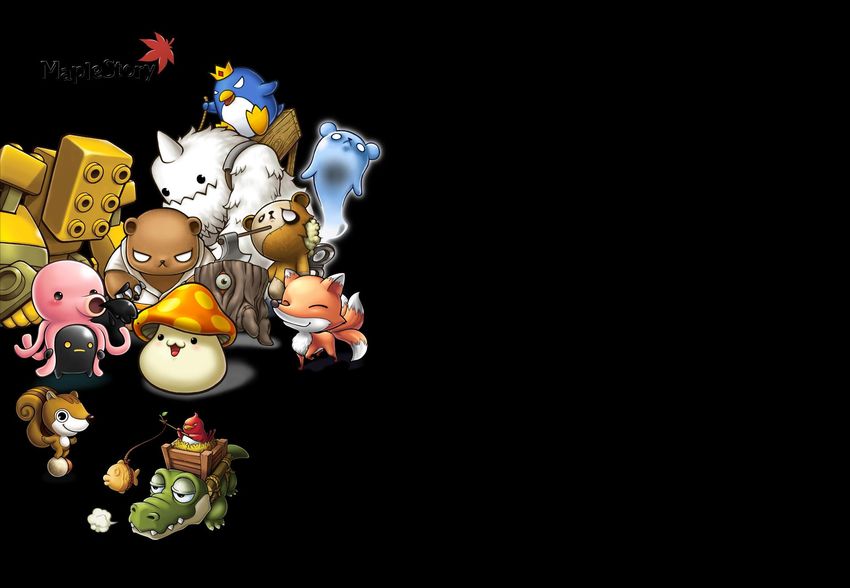
Q1 2021 Japan / North America and Europe /
 Rest of World1 – Highlights
Japan                                                                                       North America and Europe                                                            Rest of World1
Results as planned. Revenue grew over 2x Y/Y                                                Exceeded outlook driven by MapleStory and                                           Exceeded outlook driven by MapleStory
                                                                                            MapleStory M

• Benefited from Blue Archive which launched in Q1,                                         • Both MapleStory and MapleStory M revenue                                          • MapleStory‘s revenue grew 90% Y/Y
  as well as V4, FIFA MOBILE2, and TRAHA                                                      grew 136% and 78% Y/Y, respectively                                               • Benefited from KartRider Rush+
• MapleStory revenue grew 37% Y/Y                                                           • Benefited from KartRider Rush+ and V4

(Unit: ¥ millions)

  YoY% change:                                                                                   YoY% change:                                                                        YoY% change:
     As Reported:                       +116%                                                         As Reported:               +16%                                                   As Reported:                      +10%
     Constant Currency4:                +111%                                                         Constant Currency4:        +17%                                                   Constant Currency4:               +6%

                                                                                                                            5,519
                                                                                                                5,054                      5,122                                                                    4,975
                                                                                                                                                          4,814                                      4,615
                                                                                                     4,168                  1,463                                                                                                                 4,152
                                                                                                                1,171                      1,102                            3
                                                                                                                                                                                      3,784
                                                3,447           3,382                                                                                     1,399        PC                            1,484          2,097
                                                                                                      932                                                                                                                          3,149
                  2,781          2,623            774                             3                                                                                                                                                                                 3
                                                                 836         PC                                                                                                       1,775                                                       2,625        PC
                                                                                                                                                                                                                                   1,186
   1,567           942             871
                                                                                                                3,883       4,056          4,020
                                                                                                     3,236                                                3,415        Mobile                        3,131          2,878
    731                                         2,673           2,546        Mobile
                  1,839          1,752                                                                                                                                                2,009                                        1,963          1,527        Mobile
    836
 Q1 2020        Q2 2020         Q3 2020        Q4 2020        Q1 2021                                Q1 2020   Q2 2020      Q3 2020      Q4 2020        Q1 2021                     Q1 2020        Q2 2020        Q3 2020        Q4 2020        Q1 2021

 1 “Rest of World” includes other Asian countries as well as Central and South American countries.                       4 Constant currency is a non-GAAP measure used to show performance unaffected by fluctuations in foreign currency exchange rates.
                                                                                                                           Constant-currency basis amounts are calculated using the average foreign currency exchange rates for the comparable period in the
 2 Official title is EA SPORTS™ FIFA MOBILE.
                                                                                                                           prior year and applied to the current period. As an example, we calculate royalty revenues from China Dungeon&Fighter by applying the
 3 PC revenues include other revenues besides PC online games and mobile games.                                            same CNY/USD, USD/KRW and KRW/JPY exchange rates from last year's same fiscal quarter.

                                                                                                                                                                                                                             © 2021 NEXON Co., Ltd. All Rights Reserved.   10
Q2 2021 Outlook
© 2021 NEXON Co., Ltd. All Rights Reserved. 11Q2 2021 Financial Outlook
Expect Y/Y Decrease Given Tough Comparison with Q2 2020
Revenues Operating Income Net Income2
• Constant currency1 down 23% to 16% • Expect a Y/Y decrease primarily due to the Expect a Y/Y decrease primarily due to the
revenue decrease operating income decline
• Expect Y/Y decrease due to a challenging
comparison given the strong performance in • Expect increased HR costs and outsourcing costs
Q2 2020 when our topline grew 27% Y/Y on
a constant currency basis
(Unit: ¥ millions, except per share data) (Unit: ¥ billions)
Q2 2020 Q2 2021 Outlook YoY % Q2 Accumulated (High-end)
Revenues ¥64,466 ¥54,451 ~ ¥59,596 (16%) ~ (8%)
3
Revenues Operating Income Net Income2
PC 44,923 37,142 ~ 40,624 (17%) ~ (10%)
Mobile 19,543 17,309 ~ 18,972 (11%) ~ (3%)
147.2 147.9
Operating income 26,711 12,039 ~ 16,384 (55%) ~ (39%)
Net income2 19,763 8,965 ~ 12,254 (55%) ~ (38%)
Earnings per share 22.37 10.09 ~ 13.79 64.5 59.6
FX Rate Assumptions
100 KRW/JPY 8.83 9.77 9.77 11% 68.3 69.7
59.7 58.3
CNY/JPY 15.18 16.72 16.72 10% 19.8
26.7 16.4 12.3 Q2
USD/JPY 107.62 108.70 108.70 1% 82.8 88.3
4 41.5 43.3 49.9 46.0 Q1
Forex sensitivity : Every one Japanese yen move against the U.S. dollar would have the following impact on
our financials for Q2 2021 Revenues 0.51 billion yen
Operating Income 0.15 billion yen 2020 2021 2020 2021 2020 2021
1 Constant currency is a non-GAAP measure used to show performance unaffected by 2 Net income refers to net income / loss attributable to owners of the parent. 4 In most situations, the exchange rates of both the South Korean Won and the Chinese
fluctuations in foreign currency exchange rates. Constant-currency basis amounts are Yuan are linked to the U.S. Dollar. For simplicity, forex sensitivity is calculated based on
calculated using the average foreign currency exchange rates for the comparable period in 3 PC revenues include other revenues besides PC online games and mobile games the assumption that Korean Won and Chinese Yuan move similarly against Japanese
the prior year and applied to the current period. As an example, we calculate royalty Yen when there is an exchange rate movement in U.S. Dollar and Japanese Yen.
revenues from China Dungeon&Fighter by applying the same CNY/USD, USD/KRW and
KRW/JPY exchange rates from last year's same fiscal quarter. © 2021 NEXON Co., Ltd. All Rights Reserved. 12Q2 2021 Korea / China Outlook
Korea China
Expect constant-currency2 revenues to decrease Y/Y primarily due to Expect Dungeon&Fighter’s revenue to decrease Y/Y
MapleStory, Dungeon&Fighter, V4 and KartRider Rush+
• PC1: Expect to decrease Y/Y • Down 28% to 17% on a constant currency basis2, excluding the impact
of 2.3 billion yen one-off royalty revenue adjustment in last Q2
‐ MapleStory: Expected to decrease Y/Y in comparison with 151% Y/Y growth
in Q2 2020 on a constant currency basis2 • Introduced Labor Day Update(4/22); scheduled to introduce the 13th
Anniversary update (June)
‐ Dungeon&Fighter: Expect to decrease Y/Y due to tough comps in last Q2
• Current active users and paying users in April have further decreased
‐ FIFA ONLINE 43 / Sudden Attack: Expect to increase Y/Y
since Q1; expect its revenue to decrease year-over-year, accordingly
• Mobile: Expect to be roughly flat Y/Y4
‐ Expect to benefit from The Kingdom of the Winds: Yeon and to increase in
FIFA ONLINE 4 M5 and MapleStory M
‐ Expect Y/Y decreases in V4 and KartRider Rush+, both of which had strong
performances in last Q2 following their launches
(Unit: ¥ millions)
Q2 2020 Q2 2021 Outlook YoY % Change Q2 2020 Q2 2021 Outlook YoY % Change
Constant Constant
Actual Low-end High-end As-Reported Actual Low-end High-end As-Reported
Currency2 Currency2
32,797 31,619 ~ 33,775 (4%) ~ 3% (13%) ~ (7%) 19,219 13,523 ~ 15,594 (30%) ~ (19%) (37%) ~ (27%)
33,775 Q2
32,797 19,219
15,594 Q2
39,744 50,167 Q1 33,499 25,798 Q1
2020 2021 2020 2021
(High-end) (High-end)
1 PC revenues include other revenues besides PC online games and mobile games 3 Official titles is EA SPORTS™ FIFA ONLINE 4 (PC).
2 Constant currency is a non-GAAP measure used to show performance unaffected by fluctuations in foreign currency exchange rates. Constant- 4 Year-over-year expectation on a constant currency basis
currency basis amounts are calculated using the average foreign currency exchange rates for the comparable period in the prior year and applied
to the current period. As an example, we calculate royalty revenues from China Dungeon&Fighter by applying the same CNY/USD, USD/KRW and 5 Official titles is EA SPORTS™ FIFA ONLINE 4 M (mobile). © 2021 NEXON Co., Ltd. All Rights Reserved. 13
KRW/JPY exchange rates from last year's same fiscal quarter.Q2 2021 Japan / North America and Europe /
Rest of World1 Outlook
Japan North America and Europe Rest of World1
Expect revenues to decrease Y/Y Expect revenues to decrease Y/Y Expect revenues to decrease Y/Y
• Expect to benefit from FIFA MOBILE2, • Expect a Y/Y decrease in Choices • Expect Y/Y revenue declines from KartRider
Blue Archive and V4 • Expect MapleStory’s revenue to be flattish Y/Y Rush+ (launched in Q2 2020) and V4 (launched
• Expect these to be more than offset by a on top of 173%4 Y/Y growth in Q2 2020 in Taiwan, Hong Kong, and Macau in Q1 2020)
• Expect MapleStory’s revenue to slightly increase
decrease in TRAHA due to a tough
comparison following its Q2 2020 launch Y/Y on top of 217%4 Y/Y growth in Q2 2020
(Unit: ¥ millions)
Q2 2020 Q2 2021 Outlook YoY % Change Q2 2020 Q2 2021 Outlook YoY % Change Q2 2020 Q2 2021 Outlook YoY % Change
As- Constant As- Constant As- Constant
Actual Low-end High-end Actual Low-end High-end Actual Low-end High-end
Reported Currency3 Reported Currency3 Reported Currency3
2,781 2,354 ~ 2,680 (15%) ~ (4%) (20%) ~ (9%) 5,054 3,998 ~ 4,418 (21%) ~ (13%) (23%) ~ (15%) 4,615 2,957 ~ 3,129 (36%) ~ (32%) (41%) ~ (38%)
5,054 4,418 Q2
4,615 3,129 Q2
2,680 Q2
2,781
3,382 Q1 4,168 4,814 Q1 3,784 4,152 Q1
1,567
2020 2021 2020 2021 2020 2021
(High-end) (High-end) (High-end)
1 “Rest of World” includes other Asian countries as well as Central and South American countries. 3 Constant currency is a non-GAAP measure used to show performance unaffected by fluctuations in foreign currency exchange rates.
Constant-currency basis amounts are calculated using the average foreign currency exchange rates for the comparable period in the
2 Official title is EA SPORTS™ FIFA MOBILE. prior year and applied to the current period. As an example, we calculate royalty revenues from China Dungeon&Fighter by applying the
same CNY/USD, USD/KRW and KRW/JPY exchange rates from last year's same fiscal quarter.
4 Year-over-year growth on a constant currency basis
© 2021 NEXON Co., Ltd. All Rights Reserved. 14Q2 2021 Operating Income & Cost Outlook
(Unit: ¥ billions)
Y/Y Operating Income Comparison (High-end) Decreased revenues
Increased HR costs1 related to:
4.9 • Increased stock option costs
• Introduction of the new compensation policy
in Korea
4.8
0.8 0.3 Increased outsourcing costs
1.1
Decreased marketing costs. Expect
26.7 decreased new title launches compared
with Q2 2020
16.4 Others include:
• Increased cloud servicing fee
• Increased royalty costs
• Decreased PG fees
1
Operating Income Revenue decrease HR costs Outsourcing costs Marketing costs Others Operating Income
2020 Q2 2021 Q2
(High-end)
1 HR costs includes HR cost (COGS), HR cost (SG&A) and R&D (SG&A).
© 2021 NEXON Co., Ltd. All Rights Reserved. 152021 China Dungeon&Fighter Update Schedule
Period Tier 1 Content Update 2020 2021
Lunar New Year Update January 14th January 21st
Q1
Level Cap Release March 19th N/A
Labor Day Update April 23rd April 22nd
Q2
Anniversary Update June 18th June
Summer Update July 16th TBD
Q3
National Day Update September 22nd TBD
Q4 Winter Update N/A TBD
Indicates financially important updates
* 2021 update schedule is subject to change depending on various operational factors
© 2021 NEXON Co., Ltd. All Rights Reserved. 16Pipeline1 KOREA CHINA JAPAN
PC ONLINE MOBILE
NORTH AMERICA & REST OF THE
WORLD
CONSOLE
Creative by COSMOS
Mobile Dungeon&Fighter 2 KartRider: Drift2 Embark Studios
KonoSuba: God's Blessing TALESWEAVERM2 MABINOGI MOBILE2 DNF Duel 2,4
on this Wonderful World! Fantastic Days
KurtzPel Dynasty Warriors 9 Project BBQ 2,3 OVERKILL2,5
Mobile2
1 Chart is illustrative excerpt of pipeline. 4 Tentative title 6 The letters, graphics, symbols, logos and other marks, and illustrations, characters and
other works, which are shown in this material are trademarks, registered trademarks,
2 Games based on original IP. 5 PC 3D side-scrolling action RPG based on Dungeon&Fighter copyrighted works or other legally protected materials owned by respective right holders
universe.
3 PC 3D action RPG based on Dungeon&Fighter universe.
© 2021 NEXON Co., Ltd. All Rights Reserved. 17Appendix
© 2021 NEXON Co., Ltd. All Rights Reserved. 18Financials
© 2021 NEXON Co., Ltd. All Rights Reserved. 19Summary of Results and Key Operational Metrics
(Unit: ¥ millions, except per share data)
Q1 2020 Q2 2020 Q3 2020 Q4 2020 Q1 2021 YoY%
(By Region)
Korea ¥39,744 ¥32,797 ¥50,526 ¥41,913 ¥50,167 26%
China 33,499 19,219 15,769 12,753 25,798 (23%)
Japan 1,567 2,781 2,623 3,447 3,382 116%
North America and Europe 4,168 5,054 5,519 5,122 4,814 16%
1
Rest of World 3,784 4,615 4,975 3,149 4,152 10%
(By Platform)
PC 2 65,725 44,923 46,343 38,958 65,768 0%
Mobile 17,037 19,543 33,069 27,426 22,545 32%
Revenue 82,762 64,466 79,412 66,384 88,313 7%
Operating income 41,543 26,711 27,607 15,589 43,321 4%
Net income (loss) 3 49,911 19,763 16,330 (29,784) 46,034 (8%)
Earnings per share 56.57 22.37 18.45 (33.60) 51.86
FX rate
100 KRW/JPY 9.15 8.83 8.95 9.36 9.52 4%
CNY/JPY 15.62 15.18 15.35 15.78 16.33 5%
USD/JPY 108.92 107.62 106.22 104.51 105.90 (3%)
KPI (Excluding Mobile)
MAU (millions) 27.1 23.9 20.4 17.3 16.4 (39%)
Pay Rate 15.4% 15.3% 15.7% 17.7% 19.7%
ARPPU (as-reported) 9,031 5,897 7,133 5,965 10,516 16%
1 “Rest of World” includes other Asian countries as well as Central and South American countries.
2 PC revenues include other revenues besides PC online games and mobile games.
3 Net income / loss refers to net income / loss attributable to owners of the parent.
© 2021 NEXON Co., Ltd. All Rights Reserved. 20COGS and SG&A1
(Unit: ¥ millions)
FY2020 FY2021
Q1 Q2 Q3 Q4 Q1
Total Cost of Revenue 1 ¥15,343 ¥14,574 ¥19,266 ¥19,826 ¥18,699
Royalty 2 5,738 5,074 9,618 7,406 7,977
HR cost (COGS) 3 6,443 6,429 6,241 8,929 7,281
Other (COGS) 4 3,162 3,071 3,407 3,491 3,441
Total SG&A 1 20,614 22,922 29,659 30,516 26,317
HR cost 3,907 4,260 3,968 6,912 6,582
PG fee 5 6,696 7,486 12,311 8,881 8,299
R&D 3,907 4,093 4,490 4,054 4,976
Marketing/advertising expenses 2,836 4,326 5,852 7,401 3,132
Depreciation and amortization 1,299 1,236 1,319 1,398 1,453
Other 1,969 1,521 1,719 1,870 1,875
Other Income 6 1,197 101 294 204 124
Other Expense 7 6,459 360 3,174 657 100
Includes: impairment loss 6,063 251 3,015 326 19
1 Breakdown of COGS and SG&A are unaudited. 4 Other (COGS) primarily consists of depreciation and 5 PG fee in SG&A includes commissions made to 6 Other Income includes other non-operating income,
amortization of assets related to existing games, external payment gateway companies when users reversal of deferred revenue, gain on sale of properties,
2 Royalty includes royalties paid to third-party developers in order for connection fees (mainly comprised of co-location and purchase in-game items in PC Online games that we gain on change in equity.
us to obtain the right to publish their games. datacenter fees, internet bandwidth and access fees), service. It also includes mobile carrier-related
and the costs of purchasing and maintaining our commissions we pay regarding our Japanese mobile 7 Other Expense includes other non-operating expenses, loss on
3 HR cost includes salaries, bonuses and benefits for our live servers and computer equipment. browser games, commissions we pay to sale/disposal of properties, loss on impairment of tangible fixed
game developers, who support post launch servicing, updating Apple/Google regarding our mobile native games assets, loss on impairment of intangible assets, loss on
and support for our games. globally, and platform commission fees related to impairment of other fixed assets and loss on change in equity. It
mobile browser games. also includes impairment loss of game IPs and goodwill.
© 2021 NEXON Co., Ltd. All Rights Reserved. 21P&L Below Operating Income
(Unit: ¥ millions)
FY2020 FY2021
Q1 Q2 Q3 Q4 Q1
Operating Income ¥41,543 ¥26,711 ¥27,607 ¥15,589 ¥43,321
Finance Income 1 21,918 4,598 3,748 4,646 20,995
2
Finance Costs 1,585 6,891 8,882 21,596 650
Equity profit / (loss) of affiliates,
113 260 428 (36) (91)
equity method companies
Income / (Loss) before Income Tax 61,989 24,678 22,901 (1,397) 63,575
Tax expense 12,235 5,139 6,729 28,579 17,842
Non-controlling interests (157) (224) (158) (192) (301)
Net income (loss) 3 49,911 19,763 16,330 (29,784) 46,034
1 Finance Income includes interest income primarily on cash deposits. 2020 Q1 2 2020 Q2, Q3, Q4 Finance Costs are primarily caused by FX conversion loss 3 Net income / loss refers to net income / loss attributable to owners of the parent.
and 2021 Q1 Finance Income includes FX conversion gains related to foreign related to foreign currency deposits and accounts receivable.
currency deposits and accounts receivable.
© 2021 NEXON Co., Ltd. All Rights Reserved. 22Cash Flow Statement
(Unit: ¥ millions)
3 months ended 3 months ended
March 31, 2020 March 31, 2021
Cash flows from operating activities ¥29,548 ¥17,933
Cash flows from investing activities 1,034 (32,829)
Cash flows from financing activities (4,177) (2,846)
Net increase / (decrease) in cash and cash equivalents 26,405 (17,742)
Cash and cash equivalents at beginning of fiscal year 253,636 252,570
Effect of exchange rate change on cash and cash equivalents (4,897) 8,819
Cash and cash equivalents at end of fiscal year 275,144 243,647
© 2021 NEXON Co., Ltd. All Rights Reserved. 23Balance Sheet
(Unit: ¥ millions)
December 31, March 31, December 31, March 31,
2020 2021 2020 2021
Asset Liability
Current Assets Current liabilities
Cash and cash equivalents ¥252,570 ¥243,647 Current tax liabilities 15,774 23,187
Other deposits 273,132 304,428 Current borrowings 2,094 -
Other current assets 52,830 74,876 Others 40,099 39,879
Total current assets 578,532 622,951 Total current liabilities 57,967 63,066
Noncurrent assets Noncurrent liabilities
Tangible assets 24,191 24,772 Non-current borrowings - -
Goodwill 38,425 38,909 Others 83,749 86,156
Intangible assets 14,935 14,082 Total noncurrent liabilities 83,749 86,156
Others 206,078 231,878 Total liabilities 141,716 149,222
Total noncurrent assets 283,629 309,641
Total assets 862,161 932,592 Shareholders' equity
Capital stock 22,679 24,141
Capital surplus 17,421 18,908
Treasury shares (0) (0)
Other equity interest 69,975 86,094
Retained earnings 599,807 643,624
Non-controlling interests 10,563 10,603
Total equity 720,445 783,370
Total liabilities and total equity 862,161 932,592
© 2021 NEXON Co., Ltd. All Rights Reserved. 24P&L by Reporting Segment1
(Unit: ¥ millions)
FY2020 FY2021
Q1 Q2 Q3 Q4 Q1
Japan
Revenue from external customers ¥895 ¥1,069 ¥985 ¥1,367 ¥1,340
Segment profit/(loss) (655) (624) (634) (2,425) (2,285)
Korea
Revenue from external customers 76,336 57,889 73,107 59,443 81,502
Segment profit/(loss) 47,724 27,962 31,872 19,281 45,606
China
Revenue from external customers 903 584 709 862 1,049
Segment profit/(loss) 653 295 411 532 736
North America
Revenue from external customers 3,714 4,544 4,220 4,429 4,075
Segment profit/(loss) (461) (102) (446) (254) 262
Others
Revenue from external customers 914 380 391 283 347
Segment profit/(loss) (461) (567) (709) (1,084) (1,023)
Adjustments
Revenue from external customers - - - - -
Segment profit/(loss) 5 6 (7) (8) 1
Total
Revenue from external customers 82,762 64,466 79,412 66,384 88,313
Segment profit/(loss) 46,805 26,970 30,487 16,042 43,297
1 Representation based on location of Nexon’s entities; not based on regions where the revenue originates.
© 2021 NEXON Co., Ltd. All Rights Reserved. 25NJ Corporate Entity Financial Statement1 (1)
(Unit: ¥ millions)
Income Statement FY2014 FY2015 FY2016 FY2017 FY2018 FY2019 FY2020
Revenue ¥7,987 ¥5,815 ¥5,208 ¥5,927 ¥7,024 ¥6,016 ¥5,411
Cost of revenue 3,679 3,117 3,134 3,438 3,510 3,249 2,681
Gross profit 4,308 2,698 2,074 2,489 3,514 2,767 2,730
SG&A 7,585 6,470 6,736 6,941 9,447 7,910 7,893
Operating profit / (loss) (3,277) (3,772) (4,662) (4,452) (5,933) (5,143) (5,163)
Non-operating income 28,335 19,163 636 5,049 15,646 32,565 47,902
Includes: dividend income 24,613 18,869 22 4,612 15,025 30,313 46,460
Non-operating expenses 526 1,246 1,826 1,969 9,352 4,063 2,802
Ordinary income / (loss) 24,532 14,145 (5,852) (1,372) 361 23,359 39,937
Extraordinary income 244 6,443 852 58 109 635 189
Extraordinary losses 18,717 6,897 39,573 9,643 138 77 647
Income / (loss) before income taxes 6,059 13,691 (44,573) (10,957) 332 23,917 39,479
Tax expense 4,656 5,519 (201) 234 755 1,520 2,327
Net income / (loss) 1,403 8,172 (44,372) (11,191) (423) 22,397 37,152
1 Excerpt of NEXON Co., Ltd.'s standalone financial statements included in Annual Securities Report (Yuuka Shouken Houkokusho).
Please note NEXON Co., Ltd.'s standalone financial statements are based on J-GAAP (Nexon Group's consolidated financial
statements are based on IFRS).
© 2021 NEXON Co., Ltd. All Rights Reserved. 26NJ Corporate Entity Financial Statement1 (2)
(Unit: ¥ millions)
December 31, December 31, December 31, December 31, December 31, December 31, December 31,
Balance Sheet
2014 2015 2016 2017 2018 2019 2020
Current assets ¥46,760 ¥70,444 ¥52,632 ¥42,946 ¥55,209 ¥45,374 ¥85,462
Includes: cash and cash equivalents 30,711 68,997 49,531 41,868 53,096 43,100 83,523
Non-current assets 101,337 38,190 6,438 5,494 4,836 17,630 17,851
Property, plant and equipment 222 200 74 7 3 1 6
Intangeble assets 60 66 - - - - -
Investments and other assets 101,055 37,924 6,364 5,487 4,833 17,629 17,845
Total assets 148,097 108,634 59,070 48,440 60,045 63,004 103,313
Current liabilities 16,345 3,506 2,341 1,796 2,303 2,037 2,085
Non-current liabilities 23,154 498 448 457 415 363 469
Total liabilities 39,499 4,004 2,789 2,253 2,718 2,400 2,554
Shareholder's equity 98,122 99,779 50,669 41,230 50,838 53,133 92,510
Capital stock 52,332 56,227 3,307 9,183 14,199 17,757 22,470
Capital surplus 42,192 36,087 88,621 43,021 36,846 39,981 21,720
Includes: other capital surplus 40,000 30,000 86,064 34,588 23,397 22,974 21,720
Retained earnings 3,598 7,465 (41,259) (10,974) (206) 22,614 48,320
Includes: other retained earnings 2,724 6,160 (41,476) (11,191) (423) 22,397 48,103
Treasury shares - - (0) - (0) (27,219) (0)
Valuation and translation adjustments 6,536 246 77 (10) (21) (28) (21)
Subscription rights to shares 3,940 4,605 5,535 4,967 6,510 7,499 8,270
Total net assets 108,598 104,630 56,281 46,187 57,327 60,604 100,759
December 31, December 31, December 31, December 31, December 31, December 31, December 31,
Statement of changes in equity (excerpt)
2014 2015 2016 2017 2018 2019 2020
Payment of dividends (4,372) (4,305) (4,352) - - - (4,418)
Acquisition of treasury shares (10,000) (10,000) (5,000) (10,000) (1) (27,218) (2,783)
Cancellation of treasury shares 10,000 10,000 5,000 10,000 - - 30,002
1 Excerpt of NEXON Co., Ltd.'s standalone financial statements included in Annual Securities Report (Yuuka Shouken Houkokusho).
Please note NEXON Co., Ltd.'s standalone financial statements are based on J-GAAP (Nexon Group's consolidated financial
statements are based on IFRS).
© 2021 NEXON Co., Ltd. All Rights Reserved. 27Number of Employees by Reporting Segment
March 31, June 30, September 30, December 31, March 31,
Full-time employees 2020 2020 2020 2020 2021
Japan 294 278 266 268 265
Korea 5,210 5,224 5,331 5,107 5,143
China 209 208 210 210 213
North America 408 429 383 385 342
Others 240 276 314 318 334
Total 6,361 6,415 6,504 6,288 6,297
© 2021 NEXON Co., Ltd. All Rights Reserved. 28Historical Financials
North America and
(Unit: ¥ billions)
Europe 2
7% Rest of World
Revenue by Region1 293.0 6%
Korea China Japan North America and Europe Rest of World2 16.5
253.7 248.5 19.9 Japan
234.9 11.4 10.4 3%
13.2
9.8 21.5 19.5
12.1
190.3 183.1 17.1
14.1 13.9 81.2
172.9 4.4
2.7 12.5 6.4
4.1
155.3 7.9 11.4
21.0 16.9 FY2020
8.0 29.9 133.0 112.2
115.4 Revenue by
4.4 108.4 36.4
75.4 74.2 China Region1
7.8 67.0 Korea
19.2 165.0 28% 56%
63.9
48.4 89.8
65.4 77.0 74.2 80.5 73.8
28.7 43.0
4 4
FY12 FY13 FY14 FY15 FY16 FY17 FY18 FY19 FY20
293.0
Revenue by Platform 253.7 248.5
234.9 97.1
PC3 Mobile
54.9 60.6
190.3 183.1 51.4
172.9 Mobile
155.3 42.0 33%
34.2 43.3
28.4
FY2020
108.4 Revenue by
8.2 198.9 196.0 Platform
183.5 188.0
148.3 139.8 PC3
127.0 138.7
100.2 67%
4 4
FY12 FY13 FY14 FY15 FY16 FY17 FY18 FY19 FY20
1 Based on regions where the revenue originates; not a 3 PC revenues include other revenues besides PC 5 Nexon Group has made a change to a part of its regional
representation of revenues according to Nexon entities. online games and mobile games. segmentation of revenue from external customers from Q1
2020. The numbers for the past years
2 “Rest of World" includes other Asian countries as well as Central 4 FY16 and FY19 grew Y/Y on a constant currency basis.
and South American countries.
© 2021 NEXON Co., Ltd. All Rights Reserved. 29Key Titles by Region1
Korea China Japan N. America and Europe Rest of World2
MapleStory The Kingdom of the Winds: Yeon Dungeon&Fighter Blue Archive Choices: Stories You Play MapleStory
EA SPORTSTM FIFA ONLINE 4 EA SPORTSTM FIFA ONLINE 4 M MapleStory MapleStory MapleStory MapleStory M
Dungeon&Fighter V4 Counter Strike Online V4 MapleStory M KartRider Rush+
PC3 5%
5%
MOBILE 4%
26%
Sudden Attack MapleStory M
Korea 57% FY2021 Q1 FY2021 Q1
China 29% Region1 Platform
29% 57%
Japan 4%
North America & Europe 5% 74% PC3 74%
Mabinogi KartRider Rush+ Rest of World2 5% Mobile 26%
PC3 MOBILE
1 Based on regions where the revenue originates; not a representation of revenues according to Nexon entities. 3 PC revenues include other revenues besides PC online games and mobile games.
2 “Rest of World" includes other Asian countries as well as Central and South American countries. 4 The letters, graphics, symbols, logos and other marks, and illustrations, characters and other works, which are
shown in this material are trademarks, registered trademarks, copyrighted works or other legally protected
materials owned by respective right holders
© 2021 NEXON Co., Ltd. All Rights Reserved. 30NEXON IP
© 2021 NEXON Co., Ltd. All Rights Reserved. 31Dungeon&Fighter
LTD Overview
Launched 2005
Over 700 million registered users worldwide
Life-to-date gross revenue well over $15 billion USD
Gross revenue several billion dollars more than life-to-date box
office of Star Wars and Harry Potter series; more than double
the revenue of the entire Avengers series1
Constantly evolving for 15 years with new characters,
skills and communities
Easy-to-learn, hard-to-master accessibility, action-packed
gameplay and iconic, pixelated art make Dungeon&Fighter
one of the world’s most popular and enduring game franchises
1 Life-to-date global box office revenues as of May 11th, 2021 sourced from BoxOfficeMojo.com
2 The letters, graphics, symbols, logos and other marks, and illustrations, characters and other works, which are shown in
this material are trademarks, registered trademarks, copyrighted works or other legally protected materials owned by
respective right holders
© 2021 NEXON Co., Ltd. All Rights Reserved. 32MapleStory Franchise
LTD Overview
Launched 2003
Over 180 million registered users worldwide.
Player registrations equal to 45% of Korean population
Life-to-date franchise revenue over $3 billion USD
Combined PC and mobile revenue exceeds global box office of
the movie franchise Frozen – one of Disney’s biggest1
An easy-to-learn, hard-to-master MMORPG with cross-cultural
appeal that has been growing players and revenue over 18 years.
Players love personalizing their characters
Revenue Revenue
Korea MapleStory Korea MapleStory M
Year Year
2003 2020 2016 2020
1 Life-to-date global box office revenues as of May 11th, 2021 2 The letters, graphics, symbols, logos and other marks, and illustrations, characters and other works, which are
sourced from BoxOfficeMojo.com shown in this material are trademarks, registered trademarks, copyrighted works or other legally protected materials
owned by respective right holders
© 2021 NEXON Co., Ltd. All Rights Reserved. 33KartRider Franchise
LTD Overview
Launched 2004
Registered users over 380 million
PC platform alone
Over half of all Korean population; over 45% of Taiwanese
population has played the game
Combined PC and mobile Life-to-date gross revenue over
$0.9 billion
A fast-paced online casual racing game with easy-to-learn,
hard-to-master UI, and a universe of compelling characters
which can be stylized to the player’s taste
1 The letters, graphics, symbols, logos and other marks, and illustrations, characters and other works, which are shown in this
material are trademarks, registered trademarks, copyrighted works or other legally protected materials owned by respective
right holders
© 2021 NEXON Co., Ltd. All Rights Reserved. 34Sudden Attack
LTD Overview
Launched 2005
Registered users over 23 million
Life-to-date revenue over $0.5 billion
Highly accessible online First-Person Shooter with fast,
visceral action
1 The letters, graphics, symbols, logos and other marks, and illustrations, characters and other works, which are
shown in this material are trademarks, registered trademarks, copyrighted works or other legally protected
materials owned by respective right holders
© 2021 NEXON Co., Ltd. All Rights Reserved. 35The Kingdom of the Winds
Franchise LTD Overview
Launched 1996
Registered users over 26 million
World’s longest-running graphic MMORPG.
Over 25 year service period
Mobile version launched on July 15 2020.
Highest ranking #1 on iOS and #2 on AOS
A popular and enduring MMORPG based on historical comic
about the Goguryeo Dynasty
1 The letters, graphics, symbols, logos and other marks, and illustrations, characters and other works, which are shown in this
material are trademarks, registered trademarks, copyrighted works or other legally protected materials owned by respective
right holders
© 2021 NEXON Co., Ltd. All Rights Reserved. 36Mabinogi
LTD Overview
Launched 2004
Registered users over 20 million
Life-to-date revenue over $0.6 billion
MMORPG with life-oriented content and contemporary music,
fashion, and cooking. Highly differentiated from existing battle-
focused games that saturate the market
1 The letters, graphics, symbols, logos and other marks, and illustrations, characters and other works, which are
shown in this material are trademarks, registered trademarks, copyrighted works or other legally protected materials
owned by respective right holders
© 2021 NEXON Co., Ltd. All Rights Reserved. 37NEXON’s Business
© 2021 NEXON Co., Ltd. All Rights Reserved. 38Global Leader in Virtual Worlds
Nexon is Well-positioned to Benefit from the Paradigm Shift in the Entertainment Industry
Immersive
Offline Online
Light
1 The letters, graphics, symbols, logos and other marks, and illustrations, characters and other works, which are shown in this material are 2 The categorization of the games shown in this material is based on our own view. It
trademarks, registered trademarks, copyrighted works or other legally protected materials owned by respective right holders. may not necessarily reflect the common views in the market.
© 2021 NEXON Co., Ltd. All Rights Reserved. 39Nexon Focus
1 The letters, graphics, symbols, logos and other marks, and illustrations, characters and other works, which are shown in this material are
trademarks, registered trademarks, copyrighted works or other legally protected materials owned by respective right holders.
© 2021 NEXON Co., Ltd. All Rights Reserved. 40Solid Foundation. Significant Opportunities for Growth
Big Growth Opportunities Layered on Top of Core Business
REVENUE
Opportunity
Solid
Foundation
YEAR
1 The letters, graphics, symbols, logos and other marks, and illustrations, characters and other works, which are shown in this material are
trademarks, registered trademarks, copyrighted works or other legally protected materials owned by respective right holders.
© 2021 NEXON Co., Ltd. All Rights Reserved. 41Mental Model of Virtual Worlds
Virtual Worlds Can Grow Over a Period of Years Despite the Near-term Ups and Downs
REVENUE TRADITIONAL GAMES VIRTUAL WORLDS
TIME
© 2021 NEXON Co., Ltd. All Rights Reserved. 42Virtual Worlds: Center of Future Entertainment
Increased User Engagement Into Our Virtual Worlds
Playtime per User for Our Major PC Franchises1 in Korea
2015 2016 2017 2018 2019 2020
1 Aggregation of MapleStory, Dungeon&Fighter, EA SPORTS™ FIFA ONLINE 4, EA SPORTS™ FIFA ONLINE 3, Sudden Attack, The Kingdom of the Winds,
KartRider and Mabinogi in Korea
© 2021 NEXON Co., Ltd. All Rights Reserved. 43Glossary of Terms
Term / Abbreviation Meaning
AOS is a sub-genre of the real-time strategy genre, in which two teams of players compete with each other in discrete
AOS
games, with each player controlling a single character through an RTS-style interface.
FPS (first person shooter) A game in which the player plays from the point of view of the game character in three-dimensional graphics
A game that is usually played from a third-person on perspective, in which the player controls vast numbers of in-game
RTS (real-time strategy)
characters in a tactical scenario
MMORPG An online role-playing game that has a “massive” number (usually several hundred or more) of players who play
(massively multiplayer online role playing game) concurrently
Monthly total number of users who logged in and played Nexon’s PC online games.
MAU MAU in this presentation is the quarterly average of such numbers. Nexon’s PC online games include game developed and
(monthly active user) serviced by Nexon group, games developed by Nexon group and serviced by non-Nexon group publishers, and game
developed by non Nexon group acquired publishing rights.
The amount obtained by dividing monthly PC online game gross revenues by the number of monthly paying users. ARPPU
ARPPU
in this presentation is the quarterly average of such numbers. Gross revenues used in the calculation are in-game sales,
(average revenue per paying user) and exclude other revenues included in PC revenues such as sales from PC café time charge.
Pay Rate The percentage rate obtained by dividing the number of monthly paying users by the number of monthly active users. Pay
rate in this presentation is calculated using the quarterly average of such numbers.
The maximum number of users concurrently accessing a game at a particular moment. MCCU is generally used to
MCCU (maximum concurrent users) measure the popularity of a game
A trial version (beta version) of a game offered for a certain period of time to a limited number of users or groups. A Limited
Closed Beta Test (CBT) Beta Test in an even smaller-scale trial mode of a game with fewer numbers of users or group
A trial version (beta version) of a game a certain period of time without restrictions on participation.
Open Beta Test (OBT) OBT is usually conducted after CBT.
Tier One Update Large scale update to existing PC games typically launched in Q1 or Q3 around peak season
Tier Two Update Smaller update to existing PC games released throughout the year
Games that are designed to be played continuously for hours and enable thousands of concurrent users to interact with
Immersive Games each other in real time. Our games are architected to evolve over years., in contrast to packaged goods games, which
often have finite story lines and comparatively less open-ended player engagement.
© 2021 NEXON Co., Ltd. All Rights Reserved. 44Disclaimer
This presentation is prepared to offer reference information about NEXON group to the investors and is intended to generally provide
investors and analysts with financial and operational information about Nexon, but not to solicit or recommend any sale or purchase of
stock or other securities of Nexon. NEXON Co., Ltd. (“Nexon”) has not verified and would assume no responsibility for the accuracy,
appropriation, or completeness thereof. This presentation does not contain all relevant information relating to Nexon or the sale of its
shares, including, without limitation, the information that would be stated under the captions “Risk Factors”, “Management’s Discussion
and Analysis of Financial Condition and Results of Operations” and “Business” in an annual report. Any investment decision with
respect to any shares of Nexon should be made solely upon the basis of the information contained in the disclosure documents and is
qualified in its entirety by reference to the detailed information appearing in the disclosure documents.
This presentation includes non-GAAP and non-IFRS financial measures, including but not limited to key performance indicators, as well
as ratios calculated on the basis thereof. These non-GAAP and non-IFRS financial measures should not be considered in isolation or as
a substitute for the most directly comparable financial measures included in our consolidated financial statements and presented in
accordance with IFRS.
This presentation includes forward-looking statements. In some cases, you can identify forward-looking statements by terms such as
“anticipate”, “assume”, “believe”, “estimate”, “expect”, “forecast”, “may”, “plan”, “potential”, “predict”, “seek”, “should”, or “will”, or by
other similar terminology. These statements discuss expectations, identify strategies, contain projections of Nexon’s financial condition
or results of operations or state other forward-looking information. The forward-looking statements in this presentation are subject to
various risks, uncertainties and assumptions about Nexon’s business and results of operations. The expectations expressed in these
forward-looking statements may not be achieved, and actual results could differ materially from and be worse than expectations.
Potential risks and uncertainties that could cause actual results to differ materially from expectations include, without limitation:
© 2021 NEXON Co., Ltd. All Rights Reserved. 45Disclaimer
• Continued growth and popularity of Nexon’s key titles;
• Nexon’s ability to maintain favorable relationships with key licensing partners;
• Nexon’s continued ability to offer games in China, through local partners or otherwise;
• Nexon’s ability to compete effectively in the online games industry;
• Nexon’s ability to address hacking, viruses, security breaches and other technical challenges;
• Fluctuations in currency exchange rates;
• Nexon’s ability to maintain and further develop its brand name;
• Effective acquisition of new companies, businesses, technologies and games from third parties and the possibility of recognizing impairment
losses;
• Continued growth of the online games market, including the underlying infrastructure, and free-to-play/item-based revenue generation
model;
• Nexon’s ability to adapt to new technologies;
• Nexon’s ability to enter into licensing arrangements for third-party titles on terms favorable to it;
• Effective defense of Nexon’s intellectual property; and
• Legislative, regulatory, accounting and taxation changes in the countries in which Nexon operates.
Nexon does not intend, and disclaims any duty, to update or revise any forward-looking statements contained in this presentation to
reflect new information, future events or otherwise.
We caution you not to place undue reliance on the forward-looking statements contained in this presentation.
© 2021 NEXON Co., Ltd. All Rights Reserved. 46Q2 2021 Earnings Release Schedule
Q2 2021 financial results are scheduled for release on
Wednesday, August 11th, 2021.
Nexon management is scheduled to host an earnings conference call for investors, analysts and the media on the same day.
Details of the earnings conference call will be available on our IR website about a month prior to the release.
© 2021 NEXON Co., Ltd. All Rights Reserved. 47© 2021 NEXON Co., Ltd. All Rights Reserved. 48
You can also read