USDA: Lake Waco/Bosque River Initiative Future Growth Projections for the Lake Waco/Bosque River Watershed - TIAER
←
→
Page content transcription
If your browser does not render page correctly, please read the page content below
USDA: Lake Waco/Bosque River
                         Initiative

Future Growth Projections for the
         Lake Waco/Bosque River
                      Watershed
                                                                             Nancy Easterling

WP0005

May 2000

Texas Institute for Applied Environmental Research
Tarleton State University •Box T0410 •Tarleton Station •Stephenville, Texas 76402
254.968.9567 • FAX 254.968.9568
Acknowledgements
The research on which this report is based was financed by the U.S. Department of
Agriculture, Natural Resources Conservation Service.
Dr. Larry Hauck, Assistant Director of Research at TIAER, provided guidance and
insight in preparing this document. Representatives from cities in the Bosque River
watershed met on several occasions to review material needed for this report and
provided important feedback. Don Gosdin, Artist Illustrator at TIAER, prepared the
map in Figure 1. Tommie Nielsen, former Research Assistant at TIAER, calculated the
historical number of cows in Erath and Hamilton counties using milk production
data.
2Abstract
The Texas Institute for Applied Environmental Research (TIAER) completed future
growth projections for the USDA Lake Waco-Bosque River Initiative. A twenty year
planning horizon was selected as appropriate for future growth estimates of potential
pollution sources in this central Texas watershed. Sectors for which future growth
was estimated include wastewater treatment plants (WWTPs), dairy farms, urban
growth, and row crops. These sectors represent the watershed’s major potential
contributors of phosphorus, the pollutant of concern in the Bosque River watershed.
Texas Water Development Board estimates of future population growth served as the
basis for growth projections of WWTP discharge and urban population. Regression
equations based on historical milk production records enabled growth projections for
cows in the watershed. Estimates of row crop acreage were based on geographic
information system analysis of changes in historical thematic satellite images.
Regulatory limits exist for WWTP effluent and dairy cow numbers. The currently
permitted maximum amounts of wastewater effluent and dairy cows in the
watershed were found to be greater than growth estimates for the year 2020. Urban
population growth is estimated to increase by 31 percent while row crop production
is not expected to increase by the year 2020. To accommodate additional growth in the
watershed, notably in the municipal and industrial areas, an allotment of 10 percent
of the current WWTP discharge is projected. These projections will be used in the
modeling efforts and other analyses for the USDA Lake Waco/Bosque River
Initiative.
34
Contents

Future Growth Projections for the Lake Waco/Bosque River Watershed . . . . . . . . . . . 11
Introduction . . . . . . . . . . . . . . . . . . . . . . . . . . . . . . . . . . . . . . . . . . . . . . . . . . . . . . . . . . . . . . . . . . . . . . . . . . . . 11
Planning Horizons for Future Growth Projections. . . . . . . . . . . . . . . . . . . . . . . . . . . . . . . . . . . . . . . . . . . . 13
Urban NPS/Population Projections . . . . . . . . . . . . . . . . . . . . . . . . . . . . . . . . . . . . . . . . . . . . . . . . . . . . . . . . 13
Wastewater Treatment Plant Effluent Projections . . . . . . . . . . . . . . . . . . . . . . . . . . . . . . . . . . . . . . . . . . . . 14
Projections of Dairy Cow Population in the Bosque River Watershed . . . . . . . . . . . . . . . . . . . . . . . . . . . 16
         Method Used to Determine Historical BRW Cow Numbers . . . . . . . . . . . . . . . . . . . . . . . . . . . . 17
         Method Used to Estimate Current BRW Cow Population . . . . . . . . . . . . . . . . . . . . . . . . . . . . . . 18
         Method Used to Predict BRW Cow Numbers. . . . . . . . . . . . . . . . . . . . . . . . . . . . . . . . . . . . . . . . . 20
Projections of Row Crop Production in the Bosque River Watershed. . . . . . . . . . . . . . . . . . . . . . . . . . . . 22
Projections of Unallocated Municipal/Industrial Contributions to the Bosque River Watershed . . . . 23
Summary . . . . . . . . . . . . . . . . . . . . . . . . . . . . . . . . . . . . . . . . . . . . . . . . . . . . . . . . . . . . . . . . . . . . . . . . . . . . . . . 24
References . . . . . . . . . . . . . . . . . . . . . . . . . . . . . . . . . . . . . . . . . . . . . . . . . . . . . . . . . . . . . . . . . . . . . . . . . . . . . . 25
Appendix A. City of Waco Population and WWTP Projections for the BRW Area . . . . . . . . . . . . . . . . 27
Appendix B. WWTP Effluent Projection Calculations . . . . . . . . . . . . . . . . . . . . . . . . . . . . . . . . . . . . . . . . . 29
Appendix C. Additional Details of Determining Cow Numbers . . . . . . . . . . . . . . . . . . . . . . . . . . . . . . . . 31

                                                                                                                                                                5
Future Growth Projections for the Lake Waco/Bosque River Watershed 6
Tables

Table 1: Population Projections, Revisions and Projected Growth . . . . . . . . . . . . . . . . . . . . . . . . . . . . . . 14
Table 2: Daily Average BRW WWTP Discharge Limits . . . . . . . . . . . . . . . . . . . . . . . . . . . . . . . . . . . . . . . 15
Table 3: Estimated Number of Cows in Erath and Hamilton Counties, 1985 - 1998 . . . . . . . . . . . . . . . 17
Table 4: Estimated Number and Annual Growth Rate of BRW Cows in Erath and Hamilton Counties,
        1985-1998 . . . . . . . . . . . . . . . . . . . . . . . . . . . . . . . . . . . . . . . . . . . . . . . . . . . . . . . . . . . . . . . . . . . . . . . 18
Table 5: Estimated Number of BRW Cows, 1998 . . . . . . . . . . . . . . . . . . . . . . . . . . . . . . . . . . . . . . . . . . . . 20
Table 6: Projected BRW Cow Numbers Based on 1994-98 Regression Equation . . . . . . . . . . . . . . . . . . 22
Table 7: Changes in BRW Row Crop Acres, 1977 to 1996 . . . . . . . . . . . . . . . . . . . . . . . . . . . . . . . . . . . . . 23
Table 8: Summary of Future Growth Projections for the BRW . . . . . . . . . . . . . . . . . . . . . . . . . . . . . . . . . 24
Table A-1: WWTP Effluent Discharge Projections for the City of Waco Located in the BRW . . . . . . . 28
Table B-1: Population Growth Rate Calculations. . . . . . . . . . . . . . . . . . . . . . . . . . . . . . . . . . . . . . . . . . . . . 29
Table B-2: WWTP Discharge Projections. . . . . . . . . . . . . . . . . . . . . . . . . . . . . . . . . . . . . . . . . . . . . . . . . . . . 30
Table C-1: Figures Used in Estimating the Number of BRW Cows in 1998. . . . . . . . . . . . . . . . . . . . . . . 32

                                                                                                                                            7
Future Growth Projections for the Lake Waco/Bosque River Watershed 8
Figures

Figure 1: The Bosque River Watershed and Lake Waco . . . . . . . . . . . . . . . . . . . . . . . . . . . . . . . . . . . . . . . 12
Figure 2: Graph and Regression Equation of Estimated BRW Cow Numbers, 1985-1998. . . . . . . . . . . 21
Figure 3: Graph and Regression Equation of Estimated BRW Cow Numbers, 1994 - 1998. . . . . . . . . . 21

                                                                                                                 9
Future Growth Projections for the Lake Waco/Bosque River Watershed 10
Future Growth Projections for the
Lake Waco/Bosque River
Watershed
Introduction
The North Bosque River, which flows approximately 125 miles from Erath county,
Texas, to Lake Waco, has been included for several years on the Clean Water Act sec-
tion 303(d) list of impaired water bodies. The river is comprised of two segments,
1226 and 1255, which have been classified by the Texas Natural Resource Conserva-
tion Commission (TNRCC). Both segments are cited for nutrient enrichment and
other pollutants. The Texas Institute for Applied Environmental Research (TIAER) at
Tarleton State University is working with the Bosque River Advisory Committee
(BRAC) to consider control or reduction in nutrient loadings in the North Bosque
River and to Lake Waco. The research and stakeholder process is occurring through a
USDA-funded project entitled the Lake Waco/Bosque River Initiative (USDA Initia-
tive).
Factors that can contribute pollutant loads to the system are examined in the USDA
Initiative. An important, though difficult, factor in assessments and allocations of
nutrient loadings is future contributions. Future contributions are typically estimated
by observing historical growth trends in sources and projecting them into the future.
Projections of future growth are by definition inexact, with the more distant projec-
tions typically representing less accurate estimates. Projections of 20 years are often
made, which is the horizon used for future growth projections for the USDA Initia-
tive.
Due to concerns about the holistic nature of a watershed’s response to environmental
influences, the BRAC decided to include the entire Bosque River watershed (BRW) in
the future growth projections. This added segment 1246 (the South and Middle
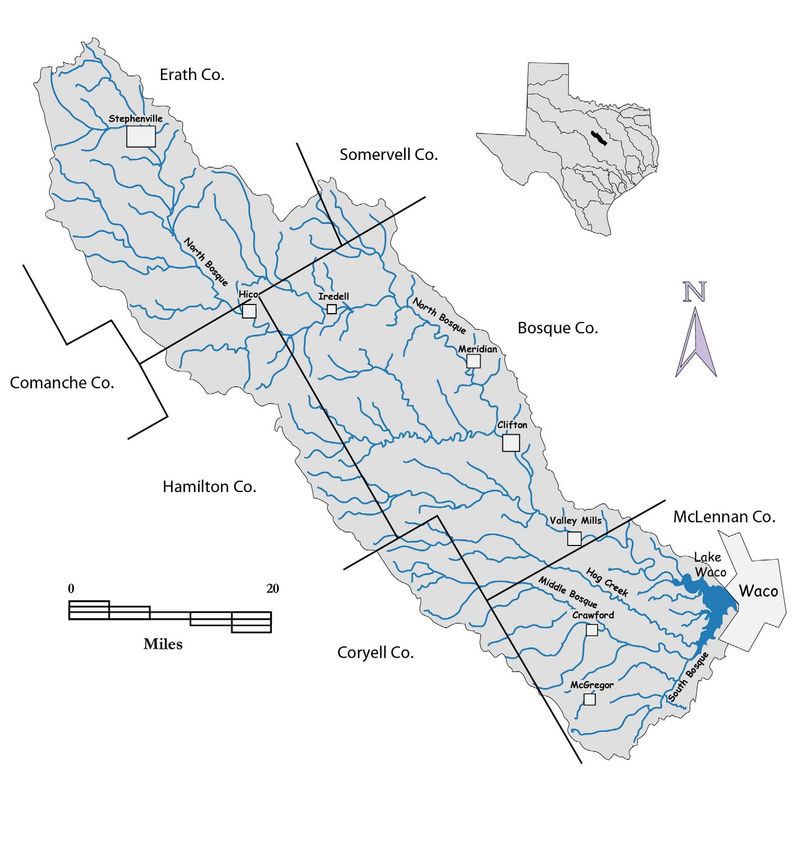
Bosque watersheds) and segment 1225 (Lake Waco). Figure 1 shows the cities, major
rivers and boundaries of the BRW.
The USDA Initiative addresses elevated levels of phosphorus. Data from years of
research in the Bosque River watershed indicate that phosphorus is the nutrient that
limits (or controls) growth of aquatic plants in the Bosque River watershed. Long
term TIAER studies indicate that orthophosphate phosphorus (PO4-P) has a stronger
statistical relationship with aquatic plant growth in the North Bosque River than does
total phosphorus, the other common form of phosphorus measured in the Bosque
River system.
11Future Growth Projections for the Lake Waco/Bosque River Watershed
Anthropogenically derived sources of PO4-P in the watershed include urban non-
point source runoff, wastewater treatment plants (WWTPs), dairy operations, and
row crop production. Effluent from manufacturing and industrial facilities in the
watershed is received and treated by local WWTPs. No industrial producers are per-
mitted to independently discharge wastes into the watershed. In addition to waste-
water treatment plants and dairies, four other facilities in the Bosque River watershed
hold TNRCC permits to dispose of wastes. These facilities include a limestone manu-
facturing facility, a milk products plant, a small mobile home park and a livestock
auction barn. Because these four facilities have no discharge permits and do not rep-
resent major potential sources of phosphorus, they are not included in the projections
of future contributions of phosphorus.
The purpose of this paper is to project future growth of anthropogenic sources that
are being considered in phosphorus loading considerations within the USDA Initia-
tive. The future growth projections will be used in the computer model simulations as
part of the evaluation process of the project. The conclusions presented in this paper
have been agreed to by the BRAC.
Figure 1: The Bosque River Watershed and Lake Waco
12Future Growth Projections for the Lake Waco/Bosque River Watershed Future Growth Projections
Planning Horizons for Future Growth Projections
To provide a basis for future growth projections, a planning horizon must be deter-
mined. Often a 20-year planning horizon is used by TNRCC in their wasteload (point
source) allocation process. The planning horizon should encompass a reasonable
period in which to achieve the desired endpoints (in-stream water quality) and pro-
vide ample allowance for future growth to provide for protection of in-stream desig-
nated uses in the future. For the USDA Initiative, a 20-year planning horizon was
selected. The bases of this 20-year time frame are the following: (1) reduction of ele-
vated phosphorus levels on fields receiving dairy wastes can be a multi-year process
and 20 years should provide for substantial reductions in soil phosphorus on these
application fields, and (2) this time period represents a reasonable and often used
compromise between a projection extending too far into the future and a short-
sighted planning horizon which is invalidated by future growth before the endpoints
are achieved.
Urban NPS/Population Projections
Estimates of future population are used to predict urban nonpoint source (NPS) pol-
lution as part of computer modeling efforts. The Texas Water Development Board
(TWDB) estimates future population growth for cities and communities throughout
Texas in order to predict changes in demand for water. A detailed description of the
process used by TWDB to estimate population growth can be found at
www.twdb.state.tx.us.
The mayor, utilities director, and/or other representatives from each of the eight BRW
cities were asked to review and provide input on the TWDB population projections.
The cities of Clifton and Stephenville submitted revised projections to the BRAC;
these revisions have also been submitted to the TWDB. The City of Hico submitted
revised population projections to the BRAC based on growth in number of electric
meter connections. The City of Waco, only part of which is located within the BRW,
provided growth estimates for the BRW portion of its population. Table 1 shows the
population estimates for BRW cities for the years 2000, 2010 and 2020.
13Future Growth Projections for the Lake Waco/Bosque River Watershed
Table 1: Population Projections, Revisions and Projected Growth
2000 2010 2020 Growth Rate
City
Populationa Population Population (2000-2020)
Cliftonb 3,557 3,961 4,268 20%
Crawford 667 653 632 -5%
Hicob 1,380 1,400 1,417 3%
Iredellc 433 508 581 34%
McGregor 5,228 5,670 5,845 12%
Meridian 1,504 1,603 1,791 19%
Stephenvilleb 16,060 18,638 21,103 31%
Valley Mills 1,090 1,107 1,118 3%
Wacob,d 34,494 40,965 47,435 38%
TOTAL 64,413 74,505 84,190 31%
a. Projections were developed by TWDB, except as noted
b. Estimates were provided by city representatives
c. Estimates for Iredell, not available from TWDB, are based on 1998 Texas
Almanac population and TWDB’s non-urban growth rate for Bosque
county.
d. Estimates for the part of Waco within the Lake Waco drainage area;
additional details of Waco’s population projection are found in Appendix
A.
Wastewater Treatment Plant Effluent Projections
TNRCC records indicate that only municipal wastewater treatment plants (WWTPs)
are permitted to discharge in the Bosque River watershed; no industrial facilities hold
permits to discharge wastes in the BRW. Estimates of future WWTP effluent are used
to predict point source pollution as part of computer modeling efforts. WWTPs are
limited by regulation as to the volume of effluent that may be discharged daily and
the concentration of key constituents in that effluent. Wastewater discharge is related
to the number of people and industrial and manufacturing entities that use the sys-
tem. The population projections presented in Table 1 were used to estimate the
changes in wastewater discharge in the BRW.
WWTP effluent from the city of Waco is discharged downstream of BRW and Lake
Waco into the Brazos River basin. Waco’s effluent thus does not impact the amount of
WWTP effluent in the BRW. Several residential developments are expected within the
City of Waco’s jurisdiction, but are located outside present wastewater collection sys-
tems. The City of Waco has already committed funding to connect these planned
developments to collection systems that will transport the wastewater out of the
14Future Growth Projections for the Lake Waco/Bosque River Watershed Future Growth Projections
watershed to the treatment facility for the City of Waco. Presently it is unlikely that
package wastewater treatment plants will be required at these developments. If pack-
age wastewater treatment plants are required, they will not be used beyond the year
2002, according to City representatives. Details of potential package WWTPs for Waco
are presented in Appendix A.
The TNRCC issues permits to WWTPs, designating a daily average effluent discharge
limit. Table 2 shows the daily average discharge limit, in million gallons per day
(MGD), for each of the eight permitted WWTPs in the BRW. Each WWTP submits to
the TNRCC monthly discharge data, including an average of the measured daily dis-
charges for that month. The monthly averages of daily discharges for each WWTP
were averaged for the period January 1997 through December 1998 to obtain a daily
average discharge for each WWTP. Daily average discharges are shown beside the
TNRCC permit flow limit in Table 2.
Table 2: Daily Average BRW WWTP Discharge Limits
Recent Average Discharges and Estimated 2010 and 2020 Discharges
Daily Avg Recent Daily Estimated Estimated
WWTP Discharge Average Discharge in Discharge in 2020 Discharge as
Portion of
Facility Limita Dischargeb 2010 c 2020c Discharge Limit
(MGD) (MGD) (MGD) (MGD)
Cliftond 0.650 0.303 0.345 0.372 57%
Crawford 0.026 0.009 0.009 0.009 33%
Hico 0.200 0.086 0.088 0.089 44%
Iredell 0.050 0.024 0.029 0.033 66%
McGregor 1.100 0.727 0.802 0.827 75%
Meridiane 0.450 0.157 0.204 0.251 56%
Stephenville 3.000 1.939 2.322 2.629 88%
Valley Mills 0.360 0.101 0.102 0.103 29%
TOTALf 5.836 3.345 3.901 4.313 74%
a. From TNRCC wastewater discharge permits
b. Based on self-reporting flow data from 1997 to 1998
c. Based on estimates of population growth rates in Table 1, applied beginning
in 1998.
d. Clifton’s discharge limit represents a requested amendment from the current
0.400 MGD
e. Meridian expects a large increase in industrial use
f. Total does not include a potential WWTP for Cranfills Gap, which is not
permitted and which would impact the 2020 total MGD by less than one
percent; see Appendix B for more details
The percentage growth projected for each city (Table 1) was applied to that city’s
wastewater treatment plant effluent, except as noted, in order to predict WWTP efflu-
15Future Growth Projections for the Lake Waco/Bosque River Watershed
ent discharge in 2010 and 2020. Appendix B contains details of the growth projections
for wastewater treatment plant effluent.
The TWDB currently projects decreased water use throughout Texas, especially for
industrial water users, due to the development and increasing use of water saving
devices. Basing future WWTP effluent on changes in water use, in addition to future
population growth, would have produced lower effluent projections. In order to
allow sufficient growth potential for WWTPs serving BRW municipalities, projections
of future WWTP effluent were based on percentage increases in population.
City representatives reviewed the WWTP projections and provided input. The city of
Clifton is in the process of building a new wastewater treatment plant, and the figures
for Clifton reflect the proposed permit limits. The city of Meridian anticipates indus-
trial growth in their region, and therefore had larger estimates than those based on
population increases alone. The WWTP effluent projections for 2010 and 2020 are
shown in Table 2. In addition, the discharge projected for 2020 is shown in Table 2 as a
percentage of the current regulatory discharge limit.
For future effluent projections, the greater of the projected WWTP discharge and the
permitted WWTP discharge limit should be used. According to these projections,
none of the WWTPs in the BRW will exceed their TNRCC permit limit by 2020. There-
fore, the WWTP effluent projection used will be each WWTP’s permitted daily aver-
age discharge, which totals 5.836 MGD.
Projections of Dairy Cow Population in the Bosque River
Watershed
Dairy farming is a major industry in the BRW, potentially contributing a large propor-
tion of the nutrient loading to Lake Waco. Change in the number of dairy cows in the
watershed constitutes an important part of future growth projections. Projection of
the future BRW dairy cow population is based on the assumption that future growth
will proceed at the same rate as previous growth. Analysis of historical cow numbers
can be used to produce a regression equation which describes the past growth rate
and can be used to predict future growth. The projection estimate requires the follow-
ing basic steps:
(a) determination of historical numbers of BRW cows,
(b) determination of the current number of BRW cows,
(c) calculation of a regression equation based on historical cow numbers, and
(d) application of the equation to the current number of BRW cows for the desired
number of years in the future.
Neither the historical BRW cow numbers nor the current BRW cow population are
available. Estimates of these two data sets were derived from existing data, as
explained below.
16Future Growth Projections for the Lake Waco/Bosque River Watershed Future Growth Projections
Method Used to Determine Historical BRW Cow Numbers
The best available source of long term data on BRW cow numbers is milk production
data published monthly in The Milk Market Administrators Report. Cow numbers
were estimated by dividing the total pounds of milk produced in the month by the
average pounds produced per cow per day (55 pounds of milk per cow per day,
according to The Milk Market Administrators Report guidelines) then dividing by the
number of days in the month. This approximates the number of lactating cows, which
is multiplied by the commonly accepted value of 1.2 to approximate total herd size
(lactating and dry cows). See Appendix C for details on this calculation. The cow
numbers calculated for each month were averaged to produce the mean number of
cows for each year of record. It should be noted that the number of cows on individ-
ual dairies fluctuates from day to day and season to season. Therefore, a goal of deter-
mining exact cow numbers is not appropriate and is superseded by efforts to estimate
average numbers of cows.
Milk production data are recorded by county rather than by watershed. Because all
but two BRW dairies are located in Erath and Hamilton counties, milk production fig-
ures for those two counties were used to estimate the cow population in past years.
While reliable milk production data are available for Erath county since at least 1980,
complete data for Hamilton county are available only since 1985. For this study, 1998
is the latest year with a complete set of data. Table 3 shows the estimated number of
cows in both counties, as calculated from milk production data for the period of inter-
est.
Table 3: Estimated Number of Cows in Erath and Hamilton Counties, 1985 - 1998
Year # Cowsa Year # Cowsa
1985 31,733 1992 72,412
1986 33,648 1993 81,437
1987 40,049 1994 92,050
1988 51,147 1995 94,644
1989 59,068 1996 100,289
1990 66,474 1997 96,290
1991 67,775 1998 97,939
a. Based on milk production data from The Milk
Market Administrators Report
Many Erath and Hamilton dairies are located outside the BRW in adjacent water-
sheds, so it was necessary to determine the percentage of the counties’ cows located
within the BRW. This was accomplished by dividing the estimated number of cows in
the watershed in 1998, excluding the two dairies outside Erath and Hamilton coun-
ties, by the 1998 total for both counties. The number of BRW cows in Erath and
Hamilton counties during 1998 was estimated, as explained in the next section, to be
17Future Growth Projections for the Lake Waco/Bosque River Watershed
39,938. This number was divided by the 1998 total number of Hamilton and Erath
county cows (97,939, shown in Table 3) to yield the percentage of Hamilton and Erath
county cows which are located in the BRW (40.8 percent). While this approach
assumes that cows in the BRW represent a constant portion of Erath and Hamilton
county cows for each year, there exist insufficient data to make any other assumption.
The calculated percentage (40.8 percent) was multiplied by the number of Erath and
Hamilton cows for each year of record (from Table 3) to estimate historical numbers
of BRW cows in Erath and Hamilton counties. These yearly estimates are presented in
Table 4, with the annual growth rate in number of cows.
Table 4: Estimated Number and Annual Growth Rate of BRW Cows in Erath and
Hamilton Counties, 1985-1998
Erath & Hamilton
BRW Annual
Year Countiesa
(# cows)b Growth Rate
(# cows)
1985 31,733 12,940
1986 33,648 13,721 6%
1987 40,049 16,332 19%
1988 51,147 20,857 28%
1989 59,068 24,087 15%
1990 66,474 27,107 13%
1991 67,775 27,638 2%
1992 72,412 29,529 7%
1993 81,437 33,209 12%
1994 92,050 37,537 13%
1995 94,644 38,595 3%
1996 100,289 40,896 6%
1997 96,290 39,266 -4%
1998 97,939 39,938 2%
a. Based on data from The Milk Market
Administrator’s Report
b. Calculated from estimated percentage of Erath
and Hamilton cows in the BRW in 1998 (40.8%)
Method Used to Estimate Current BRW Cow Population
Estimating the current number of cows in the BRW required combining data from dif-
ferent sources. First, all operating dairies in the watershed were identified using a list
18Future Growth Projections for the Lake Waco/Bosque River Watershed Future Growth Projections
of dairy addresses compiled by the Texas Department of Health (TDH) for each
county, a detailed map of the watershed boundaries, and a considerable amount of
ground-truthing. The resulting list of BRW dairies was used to search recent TNRCC
dairy inspection reports, which include the actual number of cows present on the
inspected dairy. Over one-third of all BRW dairies, however, did not have recent
TNRCC inspection reports.
TNRCC permits for concentrated animal feeding operations (CAFOs) cannot be used
to estimate actual cow numbers because most dairies have fewer cows than the maxi-
mum listed on their permit and not all dairies are required to have a permit. (Prior to
1995, dairies with fewer than 250 cows were not required to have a permit; in 1995,
that number was lowered to 200 cows.) Therefore, the actual number of cows on any
BRW dairy not recently inspected had to be estimated. The percentage of actual cows
out of the total allowable number of cows on inspected dairies was calculated and
applied to the maximum allowable on the uninspected dairies. The following steps
outline the procedure used to estimate cows on uninspected dairies:
(1) The number of cows actually present on the dairies inspected from 1997 through
1999 was totaled, using TNRCC inspection reports. The maximum allowable
number of cows on those dairies was also totaled. TNRCC CAFO permits pro-
vided the maximum allowable number for dairies with permits. For unpermitted
dairies, the maximum allowable number of cows was assumed to be either 199 or
249, depending on initial date of operation. The percentage of actual cows out of
allowable cows was calculated for the inspected dairies.
(2) To estimate the number of actual cows on the uninspected dairies, the percentage
calculated above was multiplied by the maximum allowable number of cows for
each uninspected dairy.
Table 5 presents the data used in estimating the number of BRW cows in 1998. The
first row of figures in the table presents data for BRW dairies in Erath and Hamilton
counties inspected by TNRCC from 1997 through 1999. The maximum allowable
number of cows was totaled for the 65 inspected dairies. This number had to be
adjusted to accommodate dairies located on the boundary between the Bosque and
adjacent watersheds. Because some TNRCC permits list total head while other per-
mits list milking head, the figures were also adjusted to represent total cows on all
permitted dairies. Appendix C provides details for allocation of cows on the border-
line dairies and for adjusting numbers to reflect total cows. The actual number of
cows on the first row (27,289) represents the sum from the inspection reports of the 65
inspected dairies, with cow numbers on borderline dairies being appropriately
adjusted. Dividing the total of actual cows on those dairies (27,289) by the adjusted
maximum number (42,527) yields 64.2 percent. This percentage was applied to the
maximum number of cows allowed on the uninspected BRW dairies to estimate their
actual cow numbers (second row of Table 5). Four BRW dairies are no longer operat-
ing, yet remain on TNRCC’s list of permitted dairies. Because they could legally
resume operation, they are included in the total for maximum allowable cows. Cow
numbers for the two BRW dairies located outside Erath and Hamilton counties, both
of which had been inspected, were added to the numbers for the watershed. Recent
review of TNRCC permit files show that from January-August 1999, TNRCC issued
19Future Growth Projections for the Lake Waco/Bosque River Watershed
permits for one new and two enlarged dairies, adding 1,290 more cows to the total
allowable maximum. Although other numbers reflect 1998 conditions, the BRAC
decided to include these new cows into the total in order to more accurately reflect
the number of cows currently permitted/allowed in the BRW.
Table 5: Estimated Number of BRW Cows, 1998
Maximum Adjusted for Actual
Allowable Basin & Total Actual
Compared to
Type of Dairy Number of Number of Number of
Maximum
Cows
Cowsa Cowsb Allowable
Inspected BRW dairies in Erath & 42,062 42,527 27,289 64.2%
Hamilton counties
Uninspected BRW dairies in Erath & 22,660 19,712 12,649
Hamilton counties
Out of business permitted dairiesc 2,495 2,495 0
Total in Erath and Hamilton counties 67,217 64,734 39,938
Outside Erath & Hamilton counties 1,050 1,050 545
Permitted additions (September 1999) 1,290 1,290 0
Total BRW cows 69,557 67,074 40,483
a. Maximum allowable refers both to TNRCC permit limits and the maximum allowable
for unpermitted dairies
b. Adjustments include standardizing to total cow numbers and apportioning cows on
dairies located only partially within the BRW
c. Dairies that are no longer in operation but that are still included on TNRCC’s list of
permitted dairies.
Method Used to Predict BRW Cow Numbers
The prediction of BRW cow numbers is based on the application of a regression equa-
tion, which describes historical growth in BRW cow numbers, to the current esti-
mated BRW cow population. Estimates of BRW cow populations from 1985 through
1998 were analyzed to produce a regression equation that describes the growth rate
from 1985 through 1998. A graph of the data (Figure 3) shows a flattening of the
growth rate from 1994 through 1998. In order to estimate future growth in the BRW
cow population, the best information from dairy operators on the BRAC indicated
that the more recent flattened trend (Figure 3) is a better representation of expected
future growth. The BRAC decided that the projected number of cows based on the
1994-98 regression equation was a more realistic estimate because the earlier period
represents an especially dramatic period of growth in the BRW dairy industry which
is not likely to be duplicated.
20Future Growth Projections for the Lake Waco/Bosque River Watershed Future Growth Projections
Figure 2: Graph and Regression Equation of Estimated BRW Cow Numbers, 1985-
1998
Note: Does not include the two dairies located outside of Erath and Hamilton counties
50,000
45,000
40,000
35,000
Number of Cows
30,000
25,000
20,000
15,000
y = 2339.9(x-1985)+13,480
10,000
5,000
0
1985 1987 1989 1991 1993 1995 1997 1999
Figure 3: Graph and Regression Equation of Estimated BRW Cow Numbers, 1994 -
1998
Note: Does not include the two dairies located outside of Erath and Hamilton counties
41,500
41,000
40,500
Number of Cows
40,000
39,500
39,000
38,500
y = 547.33(x-1994) +38,152
38,000
37,500
37,000
1994 1995 1996 1997 1998 1999
The regression equation can be used to calculate future numbers of cows (y) from an
initial number of cows plus the product of the desired year in the future (x) and a
21Future Growth Projections for the Lake Waco/Bosque River Watershed
coefficient derived from analysis which represents growth per year. The terms of the
equation are written in the order shown in the equations in Figures 2 and 3.
The future growth equation based on 1994-98 BRW data is as follows:
y= 547.33(x-1998) + 40,483
where x = the year of the desired projection (must be after 1998)
40,483 = estimated number of BRW cows in 1998
547.33 = coefficient which describes yearly growth rate.
Table 6 shows the estimated number of BRW cows in the years 2000, 2010 and 2020
using the equation shown above.
Table 6: Projected BRW Cow Numbers Based on 1994-98 Regression Equation
Year # cows Growth from 1998
2000 41,578 3%
2010 47,051 16%
2020 52,524 30%
Using the 1994-98 regression equation, the projected number of cows in the BRW in
2020 (52,524) is lower than the currently permitted number of cows in the watershed
(67,074). Using the larger of the projected and current permitted number of cows,
67,074 total cows are used in the project’s considerations for 20 years of future
growth.
Projections of Row Crop Production in the Bosque River
Watershed
Approximately 16 percent of the land in the BRW is used for row crops (McFarland
and Hauck, 1998). Runoff from crop fields can contain excess fertilizer, which can lead
to nutrient over-enrichment. An examination of land use percentages from 1977 and
1996 shows very little change in amount of BRW cropland during the 19 year period.
The 1977 land use data were obtained from the USDA Computer-Based Mapping Sys-
tem (CBMS) digital database of aerial photography of Bosque, Coryell, Hamilton and
McLennan counties. The 1996 data were developed by USDA Natural Resources Con-
servation Service from 1996 Landsat TM scenes. The original land use designation
combined both row crops and non-row crops, such as improved pasture, into one cat-
egory termed cropland. In order to identify just the row crops, differentiation in crop-
land type was assigned based on location in the watershed. Because of soil types and
general land use practices, any cropland acres above Hico were considered to be
improved pasture, while those below Hico were considered to be row crops.
22Future Growth Projections for the Lake Waco/Bosque River Watershed Future Growth Projections
Table 7 presents the number of acres used for row crops in each of the major sub-
watersheds of the BRW, the percentage of total acreage in the subwatershed used as
row crops, and the percentage change from 1977 to 1997. The BRAC subcommittee
reviewed the data and deemed the amount of change to not be of sufficient magni-
tude to warrant additional future growth allocation.
Table 7: Changes in BRW Row Crop Acres, 1977 to 1996
Part of Watershed Used for
Row Crop Acres
Row Crops
1977a 1996b 1977 1996 Change
Entire BRW 168,375 170,673 15.8% 16.1%Future Growth Projections for the Lake Waco/Bosque River Watershed
Summary
To estimate the future growth of potential pollution sources for the USDA Initiative,
areas of potential growth with respect to phosphorus loading in the watershed have
been examined. These areas include urban population growth, wastewater treatment
plant effluent discharge, numbers of dairy cows, acres of land used for row crop pro-
duction, and potential municipal and industrial contributions. Projected increases in
each area were estimated for an approximate 20-year horizon to the year 2020, with
intermediate projections for the year 2010.
Regulatory limits exist for wastewater treatment plant effluent and dairy cow num-
bers. Projected growth in neither area equals the current regulatory limits. Because
the potential exists for all WWTPs and dairies to increase to their authorized maxi-
mum, the sum of the effluent limits for WWTPs and the maximum number of dairy
cattle will be used as the projected levels in the year 2020. Growth in acres used for
row crop production is not anticipated to increase significantly above its current level
of 16 percent of the total watershed acres.
Currently all effluent from industrial producers in BRW is handled by local WWTPs.
In order to allow for additional future growth in the watershed, notably in the munic-
ipal and industrial areas, an allotment of 10 percent of the current WWTP effluent is
projected. This adds an estimated 0.6 million gallons of effluent per day to the system.
Future contributions to be used in the modeling efforts and other analyses for the
USDA Lake Waco/Bosque River Initiative project are shown in Table 8.
Table 8: Summary of Future Growth Projections for the BRW
2020 Change from Current
Component
Projection Conditions or Permit Limits
Total urban population 84,190 people +19,777 (31%)
Total WWTP effluent 5.836 MGD None
Total number of dairy cows 67,074 cows None
Total acres of row crops 170,673 acres None
Other point source growth 0.6 MGD effluent +0.6 MGD
24References
McFarland, Anne and Larry Hauck. 1998. Stream Water Quality in the Bosque River
Watershed, October 1, 1997 through March 15, 1997. Report No. PR9705. Stephenville
TX: Texas Institute for Applied Environmental Research, Tarleton State University.
Ramos, M. and Robert Plocheck eds. 1997. Texas Almanac 1998-1999. Dallas, TX: The
Dallas Morning News, Inc.
Texas Natural Resource Conservation Commission (TNRCC). 1999. State of Texas 1999
Clean Water Section 303(d) List (Draft). Austin, TX: TNRCC.
———. 1998. State of Texas 1998 Clean Water Section 303(d) List. Austin, TX: TNRCC.
———. 1996. State of Texas 1996 Clean Water Section 303(d) List. Austin, TX: TNRCC.
Texas Water Development Board (TWDB). 1997. Water for Texas - Today and Tomorrow,
A 1996 Consensus-Based Update to the Texas Water Plan. Vol 3, Water Use Planning
Data Appendix. Austin, TX: TWDB.
USDA. The Market Administrator’s Report: The Texas Marketing Area, New Mexico -West
Texas Marketing Area. Monthly editions from January 1985 through December 1998.
Carrollton, TX: USDA.
25Future Growth Projections for the Lake Waco/Bosque River Watershed 26
APPENDIX A

    City of Waco Population and
   WWTP Projections for the BRW
                            Area

Population Projections
Representatives from the City of Waco provided the following population figures for
the portion of Waco located within the Bosque River watershed. These projections
were prepared for them by The Texas A&M University:

 Year            1998       2015

 Population      33,200    44,200

These figures represent an increase of 11,000 people over the 17 year period, or 647
people annually, assuming growth will take place in equal amounts each year. Popu-
lation projections for 2000, 2010, and 2020 were calculated using equal annual
increases in population, as shown below.

 Year            1998      2000       2010      2015      2020

 Population      33,200    34,494    40,965    44,200     47,435

Wastewater Treatment Plant Projections
Three subdivisions are scheduled to be developed within the City of Waco’s jurisdic-
tion. Residences currently located in those areas use onsite septic systems. Permits
that would allow package wastewater treatment facilities to discharge into the BRW
have been obtained for each of the three residential developments. If the package
treatments are installed, they are not anticipated to be used past the year 2002. The
residential developments will be connected to Waco’s wastewater collection system
which discharges into the Brazos River watershed. Table A-1 shows combined daily
average flow limits, plus the daily average flow and the predicted flow for WWTP
discharge from the City of Waco into the BRW.

                                                                               27
Future Growth Projections for the Lake Waco/Bosque River Watershed
Table A-1: WWTP Effluent Discharge Projections for the City of Waco Located in
the BRW
Daily Avg Flow Estimated Flow in
Daily Avg Flow Percentage 2020 Flow as
Limit 2020
(MGD) Increase Percent of Limit
City (MGD) (MGD)
Waco 0.012 0.000 0.000 0.0% 0.0%
28APPENDIX B
WWTP Effluent Projection
Calculations
WWTP effluent projection calculations are based on population growth in the area
served by the WWTP.
(a) POPULATION GROWTH RATE: City population estimates for 2000, 2010 and
2020 were obtained from the TWDB web-site or from city representatives. The growth
rates in city population were calculated by subtracting one decade’s population from
the next decade’s population and dividing by the first decade’s population (Table B-
1).
Table B-1: Population Growth Rate Calculations
Population Growth
City 2000 2010 2020 2000-2010 2010-2020
Clifton 3,557 3,961 4,268 11.4% 7.8%
Crawford 667 653 632 -2.1% -3.2%
Hico 1,380 1,400 1,417 1.4% 1.2%
Iredell 433 508 581 17.3% 14.3%
McGregor 5,228 5,670 5,845 8.5% 3.1%
Meridian 1,504 1,603 1,791 6.6% 11.7%
Stephenville 16,060 18,638 21,103 16.1% 13.2%
Valley Mills 1,090 1,107 1,118 1.6% 1.0%
Waco 34,494 40,965 47,435 18.8% 15.8%
TOTAL 64,413 74,505 84,190 15.7% 13.0%
(b) DAILY AVERAGE DISCHARGE RATE: Monthly averages of daily effluent dis-
charge for each WWTP, obtained from self-reporting data submitted to TNRCC, were
averaged across the period of January 1997 through December 1998. Because of
weather and usage variations, it was felt that two years of data would likely yield a
more representative average daily discharge than a single year. 1998 is the last year
29Future Growth Projections for the Lake Waco/Bosque River Watershed
for which complete data are available, so the average daily flows were designated as
1998 averages. Average discharges are shown in Table B-2.
(c) DISCHARGE PROJECTIONS: The discharge rate for each WWTP was multiplied
by the decade’s population growth rate for that city to yield the discharge projection.
Two-tenths of the growth rate for 2000-2010 was used for the two year period from
1998 - 2000. Projections are shown in Table B-2.
Table B-2: WWTP Discharge Projections
1998 2000 2010 2020
City Avg Dischg Dischg Dischg Dischg
Clifton 0.303 0.310 0.345 0.372
Crawford 0.009 0.009 0.009 0.009
Hico 0.086 0.087 0.088 0.089
Iredell 0.024 0.025 0.029 0.033
McGregor 0.727 0.739 0.802 0.827
Meridiana 0.157 0.159 0.169 0.227
Stephenville 1.939 2.001 2.322 2.629
Valley Mills 0.101 0.101 0.102 0.103
Waco 0.000 0.000 0.000 0.000
TOTAL 3.345 3.430 3.866 4.289
a. Representatives from Meridian projected increases larger than
those due to population increase alone. That increase and the
resulting different totals are reflected in Table 2.
Cranfills Gap is a small community located on a tributary to Meridian Creek, which
flows to the North Bosque River. Although the town does not currently have a WWTP
and TNRCC has not received a permit application for the proposed WWTP, TIAER
researchers have been informed that funding has been secured for a Cranfills Gap
WWTP. A rough estimate of future wastewater discharges in Cranfills Gap, based on
the current number of water meters and the TWDB projected growth rate for non-
urban areas of Bosque County, yielded less than a one percent change in total dis-
charge of effluent in 2020. In addition, the WWTP would discharge near the headwa-
ters of Meridian Creek, over twelve miles from the North Bosque River, which
substantially reduces impacts to the North Bosque River. Therefore, the potential
WWTP for Cranfills Gap was not included in effluent discharge projections.
30APPENDIX C
Additional Details of Determining
Cow Numbers
TNRCC wastewater discharge permits for dairies designate a maximum allowable
number of cows. Some permits designate milking head; other permits designate total
head, while others simply state a number of head. This discrepancy can result in a
notable difference in total number of cows. Cows lactate an average of 305 days a
year, and are dry the remaining 60 days. Multiplying the number of milking head by
20 percent approximates average number of dry cows. TNRCC permits for all BRW
dairies were examined for wording. Cow numbers on permits designating milking
cows were increased by 20 percent to accommodate dry cows. Cow numbers for per-
mits designating either total head, head, or cows remained as stated for calculation
purposes. This raised the permitted total for the BRW from 67,217 to 70,008 cows.
Note: Dairies with fewer than 200 cows (or 250 if they were in operation prior to 1995)
are not required to have a TNRCC wastewater discharge permit and, unless other-
wise designated, were counted as being "permitted" to have 199 cows (or 249), which
is the regulatory allowable number.
A number of dairies are located on the boundary of the Bosque River watershed, with
acreage in both the Bosque and adjacent watersheds. Whatever proportion of the
dairy’s waste application fields are located in the BRW is also applied to the cows. For
example, if 60 percent of a dairy’s waste application fields are located in the BRW,
then 60 percent of the cows are counted as BRW cows. This procedure was applied to
dairies whose facilities are located in the BRW, with some acreage in adjacent water-
sheds, as well as dairies whose facilities are located in other watersheds, but have
some acreage in the BRW. Dairies that haul manure off their property also are propor-
tioned in this same manner. This adjustment reduced the permitted total for the BRW
in Erath and Hamilton counties from 70,008 to 64,734 cows.
The number of actual cows, as opposed to a maximum allowable or permitted num-
ber of cows, was estimated from TNRCC inspection reports for the years 1997
through 1999 for 67 of the watershed’s 107 dairies, including the two dairies outside
Erath and Hamilton counties. The TNRCC inspection numbers were revised for dair-
ies whose waste application fields lay only partially within the BRW, just as the per-
mitted numbers were adjusted. Thirty-six dairies, plus four out-of-business dairies,
had no TNRCC inspection report on file between 1997 and 1999. The number of
actual cows on the uninspected dairies was estimated by multiplying the number of
permitted cows on those dairies by the ratio of actual-to-permitted cows on the
inspected dairies. This ratio was calculated by dividing the actual TNRCC inspection
total by the adjusted permitted total for the watershed, excluding the two dairies out-
31Future Growth Projections for the Lake Waco/Bosque River Watershed
side Erath and Hamilton counties. The ratio, 0.642, and the other figures are shown in
Table C-1, which is an expanded version of Table 4.
Dairies included on TNRCC’s most current list of permitted dairies, but which are
currently out of business, were not used in calculating the permitted to actual cow
ratio nor in the regression analyses. However, because those dairies could resume
operations, their permitted numbers of cows were included in the total number of
permitted cows in the watershed.
As noted in the text, a review of TNRCC permit files showed that between January to
August 1999, an additional 1,290 cows were permitted in the BRW. These were added
to the total permitted number at the request of the BRAC, in order to more accurately
estimate the cow population in the watershed.
Table C-1: Figures Used in Estimating the Number of BRW Cows in 1998
Permitted Adjusted for Estimated % of Actual/
Maximum Converted to Basin Actual Maximum
# of Dairies
Type of Dairy Allowable Total Boundaries Number Allowable
Inspected Dairies 65 42,062 44,155 42,527 27,289 64.2
Uninspected Dairies 36 22,660 23,358 19,712 12,649
Out-of-Business 4 2,495 2,495 2,495 0
Permitted Dairies
Total in Erath and 105 67,217 70,008 64,734 39,938
Hamilton
Outside Erath and 2 1,050 1,050 1,050 545
Hamilton
Permitted in 1999 1 1,290 1,290 1,290 0
TOTAL 108 69,557 72,348 67,074 40,483
32You can also read