TRANSPORT OF SOLID WASTE - ROAD TRANSPORT VERSUS RAIL TRANSPORT- CASE STUDY CHRISTCHURCH - J-Stage
←
→
Page content transcription
If your browser does not render page correctly, please read the page content below
Proceddings of the Eastern Asia Society for Transportation Studies, Vol.8, 2011

     TRANSPORT OF SOLID WASTE - ROAD TRANSPORT VERSUS RAIL
             TRANSPORT- CASE STUDY CHRISTCHURCH

Jean-Paul H. M. THULL
Senior Lecturer
Transport, Logistics, Urban Planning, Energy & Waste
Department of Environmental Management
Faculty of Environment, Society & Design
Lincoln University, PO Box 84
NZ- 7647 Lincoln, Canterbury, New Zealand
Fax: +64- 3-3253845
E-mail: Jean-Paul.Thull@lincoln.ac.nz

Abstract:
The focus of this study is to analyse the operations of solid waste transport from Christchurch
(New Zealand) to a recently opened regional landfill 70km north of Christchurch by comparing
two scenarios - road and rail transport. The thrust of the research is based on the logistics of
transporting solid waste and identifying the CO2 emissions or in simple terms the energy used by
the two modes. The study takes into consideration solid waste data from 2000-2005 and
extrapolates future waste data to assess the situation in 2015. The modelling looks separately at
road and a combination of rail-road operations by outlining the various planning and logistics
requirements for transporting solid household waste from Christchurch to the new Kate Valley
landfill.

Key Words:       Christchurch Solid Waste, Waste Transport by Road versus Rail, CO2 emissions

1.      SETTING THE SCENE
Solid waste management is a topic of increasing worldwide concern and debate. The two most
common ways of disposal of solid waste is to discharge it to a landfill or incinerate it prior to
dump the ashes to a landfill. However, irrespectively whether it is pre-treated or not, a substantial
amount of waste or residues will end up at a landfill. Surely separating some contents of the
waste like recycling materials and green waste or bio-waste can reduce the original amount of
solid waste but recycling material and green waste or bio-waste need also to be transported. It is
hence often only a cosmetic play with transport figures as green waste transport seems more
acceptable than unsorted solid waste.

The transport of solid waste is often described as waste tourism due to being carted over long
distances. The whole waste issue is usually kept quiet up to the point that the local landfill is
reaching its capacity and the problem requires urgent attention. The minimisation of the overall
costs of discharging waste is often associated with long-distance transport if all close-by landfills
have high dumping fees. World-wide many trucking firms are specialised in solid waste
management prefer as it secures long-term transport contracts as waste is an on-going business
for them. It is also flexible and quick to set up and minimises stakeholder involvement. From a
sustainability point of view, it is often perceived that rail should be given the first option though
the reality is that departure points (usually transfer stations) and the point of destination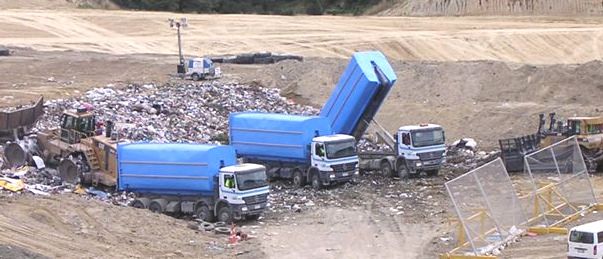
Proceedings of the Eastern Asia Society for Transportation Studies, Vol.8, 2011

(landfills) are usually not connected by rail and thus require additional truck movements to
transfer onto rail. This leads to a combination of road and rail transport, associated with
regulations to comply for both modes, road/rail transfers and in-transit transfer stations that may
impact on the general population as solid waste management operations are always perceived to
generate a negative impact on society. In terms of modal choice it will largely depend on the
country’s transport and energy policies, fuel prices and time line. In many cases, authorities are
looking for interim solutions – that do last usually for a long period – where road transport
becomes the only viable option. It is important to highlight that waste management involve
usually lengthy political decision-making that will give priority to road transport as easy to set up
at the last minute.

2.      RESEARCH OBJECTIVES
This research focuses on a New Zealand case study, analysing the transport of solid waste from
Christchurch, located in the South Island of New Zealand, to Kate Valley, a new landfill operated
approximately 70km north of Christchurch (Figure 1). The closure of the existing landfill in
Christchurch, located in Burwood (approximately 7km northeast of the city) in 2005 required
looking at an efficient mode of transporting solid waste to the new landfill as the distance was
over 70km. Road transport was chosen in the end. This study completed in 2007 investigates
whether road transport in the current form is the best option available for this specific landfill by
taking a holistic approach across the literature.

Figure 1         Canterbury Road Network (Transit NZ, 2006)

This study investigates the current operation of transporting solid waste by road from three
Christchurch Transfer Stations (Parkhouse Road, Metro & Styx Mill) (Figure 2) to Kate Valley
Landfill against a number of other scenarios including rail transport and discusses how
sustainable these are from a triple bottom line point of view. A triple bottom line approach is
defined by Land Care Research (2006) as an impact study taking into consideration economics,
environmental effects and the community.
Proceedings of the Eastern Asia Society for Transportation Studies, Vol.8, 2011

Figure 2         Location of waste transfer stations and route taken by trucks (Schriiffer, 2006)

3.    METHODOLOGY
The methodology was broken down into the following parts:
    •   Review of existing information relating to solid waste data
    •   Data gathering, feasibility and analysis of current operations
    •   Identification of further transport options and assessment of their practical feasibility
    •   Number crunching to compare various options

4.      CHRISTCHURCH SOLID WASTE SITUATION
The introduction of recycling - waste minimisation campaign, contributed to a reduction of solid
waste transported to landfills. The population of Christchurch was around 350,000 in 2005 but in
terms of exact figures of collected solid waste, it was difficult to obtain exact figures from
authorities. The data available were usually displayed in different ways (e.g. waste from
Christchurch, from metropolitan Christchurch, waste discharged at the landfill, waste including
or excluding commercial activities). Hence it became difficult to analyse the data and a number
of assumptions were taken to conduct this study. It was interesting to see though the population
growth on its own was responsible for increased the amount of solid waste (e.g. 15% from 2003-
2004 and 2004 to 2005) (Transwaste Ltd, 2005) as indicated in table 1. Table 1 shows the solid
waste quantities from Christchurch and the surrounding areas discharged at Burwood Landfill,
the previous Christchurch landfill located seven kilometres north east of Christchurch.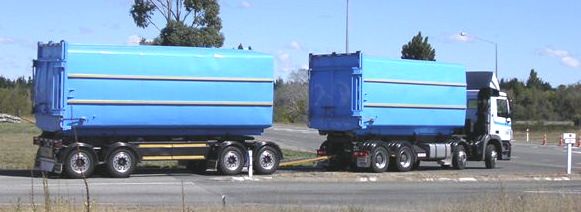
Proceedings of the Eastern Asia Society for Transportation Studies, Vol.8, 2011

Table 1          Christchurch City Council (CCC) Solid Waste & Population data (CCC, 2006a).
                                                   Increase /        Christchurch   Population Increase /
       Year           Total CCC Waste [to]
                                                  Decrease [%]        Population         Decrease
       1999                   230,822                 1.00%            324,300
       2000                   227,423                -2.50%            325,400             1,100
       2001                   215,910                -5.10%            327,200             1,800
       2002                   219,872                 1.80%            332,000             4,800
       2003                   229,981                 4.50%            338,800             6,800
       2004                   264,477               14.90%             344,100             5,300
       2005                   304,148               15.00%             345,857             1,757

The waste increased to 263,000 to in 2004/2005 and 304,148 to in 2005/2006 (CCC, 2005). A
good example is the recycling business – you can achieve 70 to 90% recycling efficiency and the
difference will go to landfill. Hence, depending on recycling market prices, the recycling process
or efficiency will be adjusted to match the market and the rest will end up on landfills. There are
few countries with a clear objective to recycle as much as possible as usually it is not economic.
This is not different in Christchurch and hence, transparency is not given. Having said this, for
the purpose of this research, a number of assumptions were taken. The economic boom in
Christchurch has caused an increase of waste sent to landfills since 2002, despite record volumes
of recycling materials being recovered in the same period

There are currently four waste streams Residential, Household, Commercial Industrial, Council
and Agricultural that are collected in Christchurch and transported to the Kate Valley Landfill
from the three transfer stations. Agricultural waste was though not part of this study. Table 2
below indicates the operation hours of the three transfer stations and an overview of the container
volumes from the transfer stations to Kate Valley. * Styx Mill is restricted by the resource
consent allowing it to operate for eleven hours per day from 7am to 6pm; all waste must be
removed from the transfer station floor every night. This is relevant for the logistics of container
movements later in this study.

Table 2          Percentage of Waste by Transfer Station
        Transfer Station                Opening Hours          Closing Hours           Waste [%]

 Parkhouse                                  5.30am                7.00pm                  45%
 Metro                                      5.30am                7.00pm                  33%
 Styx Mill *                               7.00am*                6.00pm*                 22%
 Solid Waste Total [%]                                                                   100%

The statistics of the solid waste weight quantities per person and per day shows a reduction of
solid waste for the Christchurch population from 1996 onwards with the introduction of kerbside
recycling with a negative trend from 2002/03 onwards.

The solid waste collected in Christchurch shown in Table 3 was approximately 2.25 kilos per
person per day in 1994. This figure dropped to a low of 1.81 kilos per person per day in 2000 and
2001. Since then it has increased each year until 2004 to reach 2.1 kilos / person and day.
Projections for 2005 show this figure has increased to 2.41 kg per person per and day. Table 3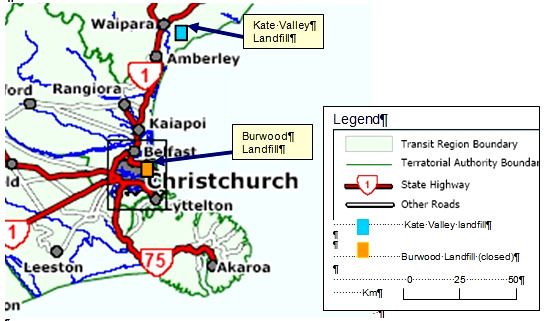
Proceedings of the Eastern Asia Society for Transportation Studies, Vol.8, 2011

shows that the population has increased by 8.9% in the past ten years, while waste quantities have
risen by 11.4%. However the waste quantity per person and day has increased by 2%.

Table 3            Christchurch Solid Waste per kg / per Person / per Day (CCC, 2005a)

        Year              Population         Christchurch Waste Quantity             Kg / per Person / per Day

        1994                302,800                     249,139                                  2.25
        1995                308,800                     240,777                                  2.14
        1996                317,500                     273,000                                  2.36
        1997                321,000                     233,392                                  1.99
        1999                324,300                     230,822                                  1.95
        2001                327,200                     215,910                                  1.81
        2003                338,800                     229,981                                  1.86
        2004                344,100                     264,477                                  2.11
        2005                345,857                     304148                                   2.41

Table 4 below shows the total waste sent to landfill including CCC black rubbish bags in column
C, the percentage increase or decrease from the previous year in column D. The waste from other
local authorities (LA) is in column E. The balance is green waste/kerbside recycling and the
amount of hard fill in columns G, H and I. The last column of figure is the population of
Christchurch for the corresponding year.

Table 4            Actual Christchurch Solid Waste Quantities Sent to Landfill, (CCC, 2005b)
 Year     Rubbish                                                                                             Chch
           Bags       Total CCC                  Other          Total                             Hard      Population
                        Waste                    Local       Refuse sent   Green      Waste      fill and
                      Including     Change     Authorities   to Landfill   Waste    Recycled     Rubble
                       Bags [t]      [%]        Waste [t]        [t]        [t]     at Kerb[t]      [t]
   A         B            C           D            E              F         G           H             I         J
 1994     38,242     249,139       -3.40%      0             249,139       2,640    0            29,823     302,800
 1996     38,707     235,376       -2.30%      0             235,376       22,331   0            33,448     317,500
 1998     38,258     228,582       -3.10%      8,096         236,677       27,536   11,856       19,263     323,000
 1999     38,325     230,822       1.00%       13,084        243,907       32,909   13,219       17,104     324,300
 2000     38,320     227,423       -2.50%      14,990        242,413       34,503   14,374       14,067     325,400
 2001     37,485     215,910       -5.10%      19,254        235,164       30,538   15,686       13,438     327,200
 2002     36,903     219,872       1.80%       21,349        241,221       34,320   17,251       19,797     332,000
 2003     35,878     229,981       4.50%       30,857        260,838       35,179   20,885       14,670     338,800
 2004     34,189     264,477       14.90%      36,001        290,478       31,074   24,044       10,577     344,100

5.     SOLID WASTE PREDICTIONS TOWARDS 2015
This section will look at the waste figures projected from 2004 through to 2015 by the
Christchurch City Council (CCC) and the private waste management company Transwaste. The
estimates by the author are based on previous, current and projected trends in population. It
shows that it is difficult to predict waste quantities as dependent on many external factors.
Proceedings of the Eastern Asia Society for Transportation Studies, Vol.8, 2011
Prediction of Waste for Christchurch by Christchurch City Council
Table 5 shows data from 1994, 2005 and indicates predictions for the future. In 2004 solid waste
was predicted to reduce by 1.1% continuing until 2012, then 2.1% until 2015. The actual figure
increased by fifteen percent from 2004/2005 to 304,148 tonnes. The Christchurch population is
predicted to grow two point five percent to reach 354,642 in 2010 with solid waste reducing by
five point four percent to 287,783. By 2015 the population is predicted to grow at 2.5% to
363,360 with a further solid waste reduction of 0.8%.
Table 5 Predicted Christchurch Solid Waste Quantities to Kate Valley (CCC, 2005c).
Total Total
Year Rubbish CCC Change Other Refuse Green Kerbside Hard Chch
Bags Waste LA* Sent to Waste Recycling fill and Population
Including Waste Landfill Rubble
Bags [t] [%] [t] [t] [t] [t] [t]
A B C D E F G H I J
1994 38,242 249,139 -3.40% 0 249,139 2,640 0 29,823 302,800
2005 39,488 304,148 15.50% 40,501 384,137 35,890 27,777 16,394 345,857
2010 287,783 0.057 354,642
: : : : : : : : : :
2015 265,000 363,360
Table 6 shows the total predicted Christchurch solid waste sent to landfill divided by the
predicted Christchurch population, multiplied by three hundred and sixty five days to obtain the
solid waste predictions per person and per day in the future.
Table 6 Predicted Solid Waste per Person [kg] per Day
Year 2005 2010 2015 2020
Population 345,857 354,642 363,360 372,123
Christchurch Waste Quantity [t] 304,148 287,783 264,123 246,469
Waste per person [kg] and per
2.41 2.22 2.00 1.815
day
Prediction of Waste by Transwaste Ltd
In 2003 Transwaste predicted that the upper bound waste increase would be 0.7% per year in the
next year and one point one percent for the lower bound per year from 2004 to 2012 as shown in
Table 7. The predictions were based on the years 2002/2003, though Transwaste was not able to
foresee the housing and economic boom in both Christchurch and Canterbury, nor the recession
that started in 2008.
Table 7 shows a five years projected waste quantity abstracted from thirty five years but keeping
in mind all unknown (e.g. technology, legislation, economy) and being aware that predictions
will always need to be re-adjusted and operations adapted.Proceedings of the Eastern Asia Society for Transportation Studies, Vol.8, 2011
Table 7 Predicted Waste Quantities to Kate Valley Landfill (Transwaste, 2002).
Landfill Assumed Upper Bound Lower Bound Most Likely [t] Most Likely [t]
Year Year [t] [t] Upper Bound Lower Bound
0.68% / year 1.1% / year 0.5% / Year 1.1% / Year
1 2004 240,000 220,000 240,000 220,000
2 2005 241,632 217,580 238,800 217,580
9 2012 253,053 201,369 230,566 201,369
: : : : : :
25 2028 279,160 N/A 212,797 168,707
35 2038 295,477 N/A 202,393 151,042
Solid Waste in Canterbury
From historical figures provided by Transwaste’s Resource Consent Application in 2003, the
population to predicted solid waste figure was set at:
• 1.56 kg per person and day to landfill lower bound
• 1.95 kg per person and day to landfill upper bound (Transwaste, 2002)
The estimated solid waste to be disposed of in 2004 was predicted to be 240,000 tonnes for
Canterbury. The actual figure published for 2004 was 295,000 tonnes, thus an increase of 55,000
to or 23% above the upper-bound prediction.
Figure 3 below was published on the Christchurch City Council (CCC) website in 2005 as part of
a media release by Transwaste which indicated an actual volume of 2.1 kg of solid waste per
person per day- hence an increase of 0.70 kg on the projected figure of 1.4 kg (Transwaste,
2002). At the time the figures were projected in 2002, no allowance was made for an 8.9%
growth in the population of Christchurch or Canterbury.
Figure 3 Solid Waste Sent to Landfill in Canterbury (Transwaste, 2005)
The 295,000 to of solid waste shown in Figure 3 are 55,000 to above the upper bound figure
projected by Transwaste in its Resource Consent Application and 75,000 to above the lower
bound figure (Transwaste, 2003).Proceedings of the Eastern Asia Society for Transportation Studies, Vol.8, 2011
Estimation of Waste Quantities
The analysis of data produced by the CCC and Transwaste were slightly different to the data
identified by the author. However, in order to proceed with the study, it was important to identify
data that were feasible. The comparison between road and rail looked at 2005-2006 data of
304,148 tonnes but concentrated on the 2015 prediction estimation of 265,000 tonnes of solid
waste per year.
Estimation of Waste Quantities by Author
The figures for 2004/2005 in table 8 are the actual solid waste quantities provided by the
Christchurch City Council (CCC, 2005d), whereas 2015 is estimated by the author.
Table 8 Estimated Waste Quantities in kg per person and day by author.
Year Christchurch Waste Christchurch
Christchurch Waste [kg] per person per day
Amount [t] Population
1995 240,777 308,800 2.14 kg
1999 243,907 324,300 2.06 kg
2004 264,477 344,100 2.11 kg
2005 304,148 345,857 2.41 kg
2015 265,000 363,360 2.00 kg
The quantity of solid waste for 2015 is estimated by the author on a realistic approach of
2kg/person and a target that could be set government. The waste predication per person and day
shows that prior to the introduction of recycling in early 2001/2002 the amount of waste per
person sent to landfill was lower than the amount for 2005 and the projected amount for 2010.
The Ministry for the Environment’s Solid Waste Analysis Protocol (SWAP) classification system
estimated that the quantity of solid waste sent to landfill in New Zealand in 2004 was equivalent
to 2.09 kg per person per day (MfE, 2006).
6. ROAD TRANSPORT
This section focuses on the transport operation from the three Christchurch Transfer Stations to
the Kate Valley, including specifications of the truck and trailer units used.
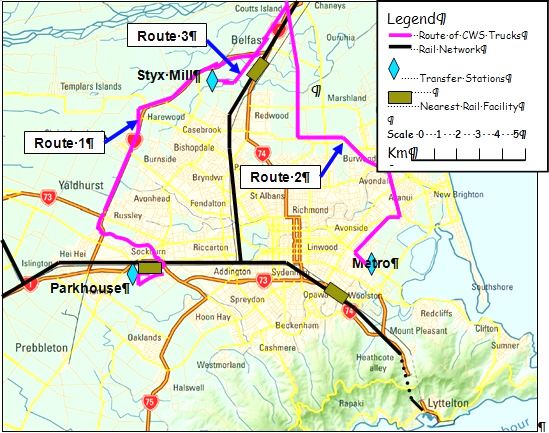
Figure 4 Mercedes Truck & Trailer Unit Figure 5 Trucks at Kate Valley
The NZ regulations currently allow a maximum gross weight of 44 tonnes for a standard truck
and trailer configuration. The transport operation in 2006 used:Proceedings of the Eastern Asia Society for Transportation Studies, Vol.8, 2011
• 3 Mercedes trucks operated by META, one based at each transfer station, each fitted with a
hydraulic operated hook and arm
• 12 long haul Mercedes truck and trailer units operated by Canterbury Waste Services (CWS)
• 4 Mercedes trucks operated by CWS based at the landfill.
The solid waste sent to Kate Valley from the three transfer stations is based on a population of
363,360 in Christchurch (CCC, 2004d) (see Table 9) and a waste quantity of 264,477 tonnes in
2004/2005 which equates to a quantity per capita of two kilos per day and per person.
Table 9 Waste Collection by Transfer Station for various periods (CCC, 2005e).
Waste Quantity per Year [tonne]
Transfer Stations Waste Quantity [%]
2004/2005 [t] 2005/2006 [t] Prediction for 2015 [t]
Parkhouse 45% 119,015 136,867 119,250
Metro 33% 87,277 100,369 87,450
Styx Mill 22% 58,185 66,913 58,300
100% 264,477 304,148 265,000
The next table (Table 10) outlines the truck, trailer and container specifications including
payloads, with 2 options for containers: A compacted closed containers and B non compacted
open top containers, maximum payload allowances and the hydraulic operated hook and arm
lifting system.
Table 10 Solid Waste Weight Variations Trucked to Kate Valley (META, 2005)
Truck & Trailer Specifications Minimum Payload [t] Maximum Payload [t] Variation [t]
Truck (tare) 12.8 12.7 120 kg
Trailer (tare) 4.6 4
Closed containers (2) 6.6 6.6
Total Empty Weight (tare) 24 23.3 700 kg
Allowed Gross Weight 44 44
Solid Waste Payload Total 20 20.7 700 kg
*Max Overloading Allowance [t] 1.5 1.5
*Includes a 1.5 tonnes Overloading Allowance by Land Transport New Zealand (LTNZ).
Container Options
The currently used containers are fully closed and are designed to take compacted waste. They
carry a payload of 20.4 tonnes due to their tare weight of approx 3.3 to each. There is an option of
using open top containers in which the waste is non-compacted. They are constructed from
lighter steel plate and hence allow a bigger payload of approximately 22.4 tonnes. This higher
payload comes with the disadvantage of potential smell developing over time on hot summer
days should a filled container stay in transit for a certain time. The debate about the relevance
whether household waste should be compacted for transport is not relevant as compacted
household waste can be difficult to get out of containers at the landfill. The volume of containers
is not restricted to a certain size like it is the case in Germany (e.g. 25m3 container to reduceProceedings of the Eastern Asia Society for Transportation Studies, Vol.8, 2011
vehicle height to fit under bridges). So really the only reason for compacting the waste was that
the equipment was already existent at the three transfer stations.
The Commercial Vehicle Investigation Unit (CVIU) confirmed that the CWS truck and trailer
units are generally speaking 45 tonnes and thus 500 kg under the tolerated limit of 45.5 tonnes
but 1 tonne above the official limit.
Maximum Payload Allowance
By taking a median payload figure for closed containers (Option A) of 20.4 tonnes and adding 1
tonne (1.5 tonnes being the legal overweight allowance), the 21.4 tonnes will also be the basis of
later calculations for option A, as it is close to the current practice. A proposal to use open top
containers would lift the 22.4 tonnes to 23.4 tonnes as option B.
Return Trips to Kate Valley for 2006
This section looks at the number of return trips to Kate Valley in 2005/2006 year and provides
predictions for return trips in 2015. The routes are shown in figure 3 and the distances are for
Parkhouse (route 1) 83km, Metro (route 2) 81km and Styx Mill (route 3) 68km. The route from
Belfast to Kate Valley via the northern motorway on SH1 is fifty five kilometres to the
intersection of SH1 and SH7. From there it is an additional nine kilometres on the Mt Cass Road
to reach the Kate Valley Landfill site. The return trip from the transfer stations to Kate Valley is
based on an average three hour trip turn around time to travel the approximately one hundred and
forty kilometre trip. This includes both picking up of the full container and dropping off of the
empty container.
Table 11 below shows the current transfer stations hours of operation and the solid waste amount
of 304,148 tonnes. Included are the number of truck and trailer trips to Kate Valley per week and
per annum using closed containers and a payload of 20.4 tonnes and 21.4 tonnes.
Table 11
\
Modelling of annual trips for Closed containers for 2006 (payloads of 20.4t/21.4t)
Transfer Hours Waste Trips per Trips per Trips per
2005/2006 Trips per a at
Station Open [%] Week at annum at Week at
Waste [t] 20.4[t]
20.4[t] 21.4[t] 21.4[t]
Parkhouse 13.5 45% 136,867 6,709 129 6,396 123
Metro 13.5 33% 100,369 4,920 95 4,690 90
Styx Mill 11 22% 66,913 3,280 63 3,127 60
Total 100% 304,148 14,909 287 14,213 273
By increasing the closed container payload from 20.4 tonnes and 21.4 tonnes (see Table 11) the
saving in the number of trips to Kate Valley is 696 per annum. By taking an average of the three
trips (A, B C from Table 23 of 77 kilometres) the saving is 107,184 kilometres.
The amount of solid waste sent to Kate Valley in the year 2005 / 2006 by using open top
containers is 304,148 tonnes per annum based using open top containers and a payload of 22.4
tonnes and 23.4 tonnes as shown below in Table 12. Using the lower payload of each container
type a comparison using the 20.4 tonne payload for closed container trips and 22.4 tonne payload
for open top container trips a the saving is 1,331 trips or 204,974 kilometres per annum can be
achieved.Proceedings of the Eastern Asia Society for Transportation Studies, Vol.8, 2011
Table 12 Modelling of annual trips for Open Top Containers for payloads of 22.4t/23.4t
2005 Trips per Trips per Trips per
Transfer Hours Waste Trips per Week
/2006 annum at annum at Week at
Station Open [%] at 22.4[t]
Waste [t] 22.4[t] 23.4[t] 23.4[t]
Parkhouse 13.5 45% 136,867 6,110 118 5,849 112
Metro 13.5 33% 100,369 4,481 86 4,289 82
Styx Mill 11 22% 66,912 2,987 57 2,860 55
Total 100% 304,148 13,578 261 12,998 250
Predicted Return Trips in 2015
This next section outlines a similar scenario but adding a totally new option to the decision-
making process that is not in favour of rail transport. The New Zealand government enabled a
two year trial lifting overall vehicle weight from 44t to 53t. A similar trial was conducted in
Germany (Gig liner). The German trial was not implemented whereas the New Zealand trial is
getting granted for some routes and some companies. CWS was able to conduct a trial over the
last year but has not yet obtained an official go-ahead. However, this new option will be part of
the 2015 evaluation as likely to be implemented after a successful trial – this will lift the payload
from 20.4to to 28.4to or with some tolerance to approximately 29 to (Option C).
Table 13 looks at the number of return trips by taking the 2015 predictions into account and
comparing the closed and open top containers. Table 13 outlines clearly that option C is by far
more efficient than the original option A: reduction of trips of 27%.
Table 13 Number of Predicted Return Trips to Kate Valley for Year 2015
Closed Container Open Container Closed Containers
(A)s (B)s (C)
Trips Trips Trips
Trips
Transfer Waste Predicted per per per Trips Trips per
Hours per
Station [%] 2015 annum Week Week per Week at
Open annum
Waste [t] at at at annum 29[t]
at
21.4[t] 21.4[t] 23.4[t] at 29[t]
23.4[t]
Parkhouse 13.5 45% 119,250 5,572 108 5,097 98 4,112 79
Metro 13.5 33% 87,450 4,086 79 3,738 53 3,016 58
Styx Mill 11 22% 58,300 2,724 53 2,492 48 2,011 39
Total 100% 265,000 12,383 240 11,327 199 9,139 176
7. RAIL TRANSPORT
From a triple bottom line point of view, rail is usually perceived as the obvious choice whenever
possible. This case study requires a combination of road/rail operation, with trucking waste from
the transfer stations to the next rail transfer station, railing the containers to Glasnevin (3km north
of Amberley and transferring back to road for the last road section to the landfill. This option
involves additional handling of the waste containers over the present system. Land purchase
would be required at Glasnevin to build a rail/road container transfer handling facility. This
would be used to store the wagons/containers while awaiting transport to Kate Valley. The
containers would be unloaded at Kate valley and left in the container park to be emptied on to the
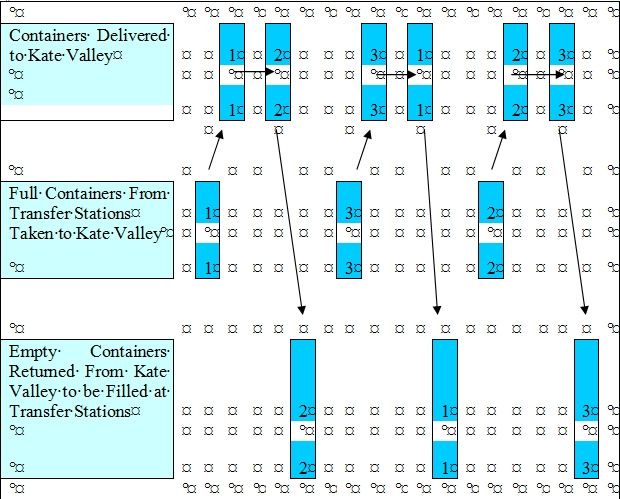
landfill by specific trucks only operating on the landfill. Empty containers would be loaded on toProceedings of the Eastern Asia Society for Transportation Studies, Vol.8, 2011 the truck and trailer units and returned to Glasnevin where they would be loaded on to the rail wagons for the return trip to Christchurch. Kiwirail has locomotives and wagons able to handle option. By using the UK/UKA class of flat deck wagon and a combination of different locomotives, the maximum numbers of containers able to be transported per trip is one hundred using the combination of the DX and DFT locomotives, however the most efficient use of a locomotive is using one DX as it is able to take up to sixty containers per trip. The proposed rail scenario put forward for transporting Christchurch’s solid waste maybe able to be duplicated by other councils in Canterbury to take advantage of the rail system to transport their solid waste to Kate Valley. This would mean up to three or four trains per day could possibly be required. However, this research project is limited to the three Christchurch Transfer Stations. 8. CONTAINER OPERATION The transport mode will dictate the number of containers required at each transfer station. From the transfer stations the full containers are taken to Kate Valley by CWS truck and trailer unit where they are unloaded from the truck and trailer units. Empty containers are picked and returned to the transfer stations as shown below in Figure 6 and the cycle begins again. Figure 6 Container Movements from the Transfer Stations to Kate Valley & Return Table 14 provides the number of containers required for a daily operation in relation to the number of truck and trailer units and return trips. The number of container required will depend on a number of factors that have been modelled in the main study. The parameters looked at 6 or 7 days operations, closed or open top containers, various payloads (including 1.5t tolerance). Table 15 outlines the scenarios for all transfer stations by detailing Parkhouse transfer station as an example taking a payload of 21.4t.
Proceedings of the Eastern Asia Society for Transportation Studies, Vol.8, 2011

Table 14         Number of Containers Required for the Transport System Needs
                                                                     Number of Return Trips to Kate Valley
 Number of Truck & Trailer Units Required per Transfer                1           2      3        4          5
                       Station
                          1                                           4            6      6      6           6
                          2                                           8           12     12      12          12
                          3                                           12          18     18      18          18
                          4                                           16          24     24      24          24
                          5                                           20          30     30      30          30
                          6                                           24          36     36      36          36
                          7                                           28          42     42      42          42

Table 15         Container number per transfer station with closed containers & 21.4 tonne Payload
  Waste per Annum [t]           2015         Truck and Trailer / Trip [t]
        119,250                                     21.4
 Return Trips per Week                 7 Day Operation                            6 Day Operation
          107                    15.3->15                                 17.8->18
    Number of Trips            3 Trips / Day      4 Trips / Day        3 Trips / Day         4 Trips / Day
                                     5                 3.8                    6                   4.5
   Number of Trucks                  5                  4                     6                    5
                                 5 Trucks           4 Trucks              6 Trucks             5 Trucks
                                  3 Trips            4 Trips               3 Trips              4 Trips
  Number of Containers
                                    30                 24                    36                   30
  20% extra allowance                6                  5                     7                    6
             Parkhouse              36                 29                    43                   36
   Total
                Metro               29                 22                    36                   22
 containers
                Styx                14                 14                    22                   14
  TOTAL Containers                  79                 65                    101                  72
Table 15 clearly outlines that 4 trips a day reduce significantly the number of required containers

Container requirements for rail transport
Table 16     Container number for rail transport and 21.4 t Payload Closed Container 2015
 265,000 [t] per annum 21.4[t] per Truck and Trailer / Trip Closed Containers
  Transfer     Waste per                    Waste per Day      Waste per      Container            Container
                            Waste per
   Station     Annum [t]                  6 Day Operation     Day 7 Day      Numbers 6             Numbers 7
                              Week[t]
                                                 [t]         Operation [t]     Day Op               Day Op
 Parkhouse       119,250          2,293               382                  328          36             31
 Metro           87,450           1,682               280                  240          26             22
 Styx Mill*      58,300           1,121               187                  160         17              15
                                                      849                  728         79              68
 20% Allowance for Peak Periods & Repairs                                              16              14
 Total Numbers of Container Required                                                   95              82
 Set 2 Total Number of Containers (at Glasnevin)                                       79              68
 Total Container Numbers                                                               174            150
Proceedings of the Eastern Asia Society for Transportation Studies, Vol.8, 2011
Two sets of containers will be required for the rail operation, set A to be at the transfer stations in
Christchurch being loaded while set B to be at Glasnevin being unloaded. An allowance of 20%
was made in the calculation for peak periods where the number of containers required increases
and for ongoing repairs of the container fleet.
• Return trip to Kate Valley
Currently CWS uses approx 140 containers for their operations. The number of truck & trailers
required is shown in table 17. The calculations are based on a 6 day operations.
Table 17 Number of truck & trailer required for 6 days operations & 21.4to payload
Return
Number of Truck & Trips Operation Truck & Trailer 3 Truck & Trailer 4
Trips per
Trailer required /annum Days Return Trips Return Trips
Day
Parkhouse 5,572 311 18 6 5
Metro 4,086 311 14 5 4
Styx Mill * 2,724 311 9 3 3
12,383 41 14** 12**
9. CONCLUSION
Table 18 and 19 show the annual fuel consumption for both solely road transport and rail/road
combination for closed containers (Option A) and 20.4t payload.
Table 18 Annual fuel consumption for road transport
Truck fuel consumption 57 litres per 100 kilometres
Transfer Station Total Road [km] Trip Numbers Total Distance [km]
Total Litres of Fuel Used
Parkhouse 83 6,709 556,847 317,403
Metro 81 4,920 398,520 227,156
Styx Mill 68 3,208 218,144 124,342
Totals 14,837 1,173,511 668,901
One Way 1,173,511 668,901
Total Return Trips Kilometres and Fuel Used 2,347,022 1,337,803
Table 19 Annual fuel consumption for combined rail/road transport
Rail Transport Payload 20.4 [t]
Total
Total Fuel Road Total 6 Day Rail Total Fuel
Road Fuel Rail
Road at .61 Trips Rail Rail Litres [l]
/ Trip [l] Fuel
/ km [km] Trips One
[l]
Way
Parkhouse 12.2 7.442 6,709 49,928 76 140 437.5 61,250 111,178
Metro 15.4 9.394 4,920 46,218 79 103 437.5 45,063 91,281
Styx Mill 12.3 7.503 3,208 24,070 58 69 437.5 30,188 54,257
Totals 14,837 120,216 312 437.5 136,500 256,716
Fuel Litres One Way 256,716
Total Fuel Litres Used 513,432Proceedings of the Eastern Asia Society for Transportation Studies, Vol.8, 2011
It is pretty obvious through comparing table 18 and 19 that the rail option is the more sustainable
one in terms of energy consumption. This gap could though be reduced by allowing a much
higher payload (53 to truck & trailer units) as indicated earlier in the study as option C but this
scenario was not calculated as not passed by New Zealand Parliament.
Comparison of Fuel Use between Road and Rail Transport
An increase of payload from 20.4 tonne to 22.4 tonne has a potential saving is 114,347 litres per
annum. Comparing road and road/rail mix indicates a potential saving of 824,371 litres per
annum. A comparison with 22.4 tonne payload using open top containers for both road and rail
shows a potential saving using rail of 730,502 litres per annum as indicated in table 20. The fuel
saving using a rail option is over sixty one percent. That equates to a saving of 14,900 trips per
year with rail.
Table 20 Comparative fuel consumption analysis
Container Payloa Road Fuel Used Rail Fuel Used Fuel Saving Fuel Saving
s d Litres Litres Litres [%]
Closed 20.4[t] 1,337,803 513,432 824,371 62
Open Top 22.4 [t] 1,223,456 492,954 730,502 60
Difference 114,347 20,478 93,869
Using a triple bottom line perspective, the benefits of rail are shown in table 21.
Table 21 Benefits of using Rail
Heading Topic Outcome
Economic Operational Costs Rail offers reduced operating costs
Environmental Energy Consumption Rail uses over 50% less energy than road
Emissions Rail produced 10% to 20% the levels of road
Community Accidents Rail is less than 0.5% of the equivalent of road
Noise & Vibration Rail would reduce noise & vibration (improve life quality)
Congestion 1 train carries the payload of 50 truck and trailer units
In conclusion, rail transport using closed container or open top containers would deliver a sixty
percent fuel saving over road transport. Rail is likely to have less impact on local communities,
except for a few landowners next to Glasnevin and produces fewer emissions. Accident rates are
likely to be lower but not proven. However, in rush hours and especially in the outskirts of the
city there will be reduced congestion and less frustrated motorists trying to pass the truck &
trailer units as a principle but probably not because of their driving capacities as CWS drivers are
highly trained and monitored. It is also highly likely that trucks will contribute to increased road
damage in extreme weather conditions. Option C with higher payload has not yet been properly
assessed though it is likely that considering just the economics in a holistic way will give
advantage to road transport as the number of trips will be able to get reduced by around 35%.
Option C could though not be transported by existing rail wagons as the payload is too high.
ACKNOWLEDGEMENT: I wish to thank Bryan Schriiffer, postgraduate student at Lincoln
University, who checked the practical side of the existing transport operations and assembled
some basics under my supervision.Proceedings of the Eastern Asia Society for Transportation Studies, Vol.8, 2011
REFERENCES
CCC (2005a). Christchurch City Council. (2005).Community outcomes and council plans. New Zealand:
February 28, 2005 from http://66.102.7.104/search?q=cache:JMp2FU12APcJ:archived.ccc.govt.nz/ltccp/2004-
14/Vol2_09_refuseminimisation.pdf+Christchurch+Solid+Waste+per+kg+/+per+Person+/+per+Day+,CCC&hl=en&
gl=nz&ct=clnk&cd=1
CCC (2005b). Christchurch City Council. (2005).Solid and Hazardous Waste Management plan 2004. New
Zealand: July 15, 2005 from
http://www.ccc.govt.nz/Waste/managementplan/SOLIDWASTEACTIONPLAN2004Part2.pdf
CCC (2005c). Christchurch City Council. (2006). Canterbury Waste Sub-Committee. New Zealand: retrieved
February 14, 2006 from archived.ccc.govt.nz/council/proceedings/1999/february/CantJointStandingCommittee.pdf
CCC (2005d). Christchurch City Council. (2005). Rubbish and Recycling Stats and Facts for Christchurch. New
Zealand: Retrieved September 12, 2005 from
www.ccc.govt.nz/Waste/Recycling/SolidWasteAndRecyclingStatisticsForChristchurch.pdf
CCC (2005e). Christchurch City Council. (2005). Waste. New Zealand: retrieved February 27, 2006 from
http://66.102.7.104/search?q=cache:CT8kJTffbfcJ:www.mfe.govt.nz/publications/waste/waste-management-nz-
oct05/waste-management-
nz.pdf+CCC,+Christchurch+solid+waste+current+and+predictions+for+2015,+CCC&hl=en&gl=nz&ct=clnk&cd=8
CCC (2006). Christchurch City Council. (2006). Waste Management. New Zealand: Retrieved March 29, 2006
from http://www.ccc.govt.nz/reports/2003/EnvironmentalTrendsReport/17WasteMan agement.pdf
Land Care Research, (2006). Land Care Research. (2006). Annual report, waste audits. New Zealand:
Retrieved February 14, 2006
http://www.landcareresearch.co.nz/publications/annualreport_0203/supporting_info/Waste_Audits.doc
MfE (2006). Ministry of the Environment. Waste Legislation. New Zealand: Retrieved February 12, 2006 from
http://mfe.resultspage.com/search?p=Q&ts=c2&w=waste+legislation
Schriiffer, B. (2006). Transport of Christchurch Solid Waste – Road Transport Versus Rail Transport,
dissertation Bryan Schriiffer, Lincoln University, New Zealand, 2006,
Transit NZ (2006). Transit New Zealand. (2006). Region No11 Canterbury. New Zealand: Retrieved June 16,
2006 from http://www.transit.govt.nz/content_files/maps/PDF/Canterbury.pdf
Transwaste (2002). Christchurch City Council. (2005). Appendix V, Waste Quantities. May 2005. New Zealand:
Retrieved November 7, 2005 from
http://www.ccc.govt.nz/Waste/Landfill/KateValley/4%20Appendices/Appendix%20V%20Waste%20Quantities%20
Final%20Apr%2002.pdf
Transwaste (2003). Transwaste Canterbury Ltd. (2003) The Draft 2003 Financial Plan and Programme
(Annual Plan). Plans for Trading Activities. New Zealand: Transwaste Canterbury Ltd. Retrieved. October 2,
2004 from http://archived.ccc.govt.nz/annualplan/2003/draft/transwaste_canterbury_limited.pdf
Transwaste (2005). Christchurch City Council. (2005). News from Transwaste Canterbury. May 2005. New
Zealand: Retrieved November 7, 2005 from
www.ccc.govt.nz/.../KateValley/4%20Appendices/Appendix%20V%20Waste%20Quantities%20Final%20Apr%200
2.pdfYou can also read