Neural States in Tourism Travel Videos - MDPI
←
→
Page content transcription
If your browser does not render page correctly, please read the page content below
Proceedings

Neural States in Tourism Travel Videos †
Pablo Ruiz 1,*, Raquel Tinoco-Egas 2 and Carlos Cevallos 1,3

                                          1 Departamento de Ingeniería Mecánica, Escuela Politécnica Nacional, Quito 170525, Ecuador;
                                            ccevallo@ulb.ac.be
                                          2 Facultad de Ciencias Empresariales, Universidad Técnica de Machala, Machala 70212, Ecuador;

                                            rmtinoco@utmachala.edu.ec
                                          3 Neuropsychology and Functional Neuroimaging Research Unit, Center for Research in Cognition and

                                            Neurosciences, Université Libre de Bruxelles, 1050 Brussels, Belgium
                                          * Correspondence: pablo.ruiz01@epn.edu.ec
                                          † Presented at the 1st International Electronic Conference on Brain Sciences, 10–25 November 2020;
                                            Available online: https://iecbs.sciforum.net/.

                                          Abstract: In marketing, there are many methods to relate reactions to products to customer prefer-
                                          ence. Current electroencephalography (EEG) signal analysis in the neuromarketing field focuses
                                          mainly on correlations between selected electrodes and hemisphere-based analysis on single scalp
                                          measures. The present study shows microstate analysis of brain EEG signals in goal-oriented videos.
                                          We measured a 16 channel EEG with an Emotiv EPOC+ device. We used two oriented videos from
                                          the Ecuadorian Government to publicize Ecuador as a tourist destination. We used a Topographic
                                          Atomize and Agglomerate Hierarchical Clustering (TAAHC) microstate analysis for the duration
                                          of the EEG as the participants watched each video. We picked the four predominant, in total time
                                          and repeatability, microstate maps that represent more than 50% of the entire recording time. We
                                          also show, in time, how topographies are represented along the video, which in a later step could
                                          be correlated with the images observed in the videos. We show the existing relations between the
                                          existing microstates. A microstate analysis of brain signal behavior across time might be a valid
                                          methodology and useful tool to analyze videos with marketing purposes.

                                          Keywords: microstate; EEG; neuromarketing; video; Emotiv

Citation: Ruiz, P.; Tinoco-Egas, R.;
Cevallos, C. Neural States in
                                          1. Introduction
Tourism Travel Videos. Proceedings
2021, 71, 6. https://doi.org/10.3390/
                                                There are a variety of emerging methods that the tourism industry uses to advertise
IECBS-08465
                                          [1]: Near Field Communication (NFC) posters [2], advertising in web platforms [3,4], vid-
                                          eos [5,6] and video games [7,8]. These methods mainly make use of audiovisual media to
Published: 18 November 2020               be attractive [9–11]. There is a neural measurable response from the user based on visual
                                          information [12,13]. One of the most used methods to gather consumer opinions is to con-
Publisher’s Note: MDPI stays neu-         duct surveys or questionnaires based on the advertising object [14] as well as institute
tral with regard to jurisdictional        psychophysiological measures [15–18]. EEG analysis helps in the analysis of consumer
claims in published maps and institu-     behavior [19] that could predict the advertising preference of the customer and gain in-
tional affiliations.                      sights from brain behavior [3–7,20]. Another way to analyze EEG signals is to recognize
                                          the main undergoing process using topographical stability analysis; this process is called
                                          Microstate [21]. This method has been proven to aid in understanding disorders such as
                                          resting-state and neuropsychiatric diseases [22–25].
Copyright: © 2020 by the authors. Li-
                                                The aim of this work is to show how new methodologies can aid in the exploration
censee MDPI, Basel, Switzerland.
This article is an open access article
                                          of brain scalp topographies from tourist videos using a portable EEG device. The results
distributed under the terms and con-      may provide information which focuses on key details found in the audiovisual stimuli,
ditions of the Creative Commons At-       presented as videos. This study provides knowledge about the sequences of the mi-
tribution (CC BY) license (http://crea-   crostates and their relationship with visual data within tourist videos.
tivecommons.org/licenses/by/4.0/).

Proceedings 2021, 71, 6. https://doi.org/10.3390/IECBS-08465                                                   www.mdpi.com/journal/proceedings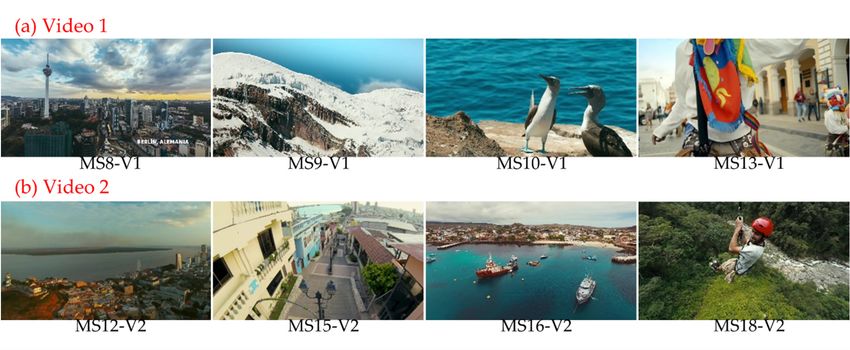
Proceedings 2021, 71, 6 2 of 6
2. Materials and Methods
One healthy male participated as a volunteer in the present methodological study.
The participant did not have any history of psychiatric or neurological disease; also, he did
not take medication that could influence the results of the experiment. The subject was in-
structed to watch the two tourist videos of Ecuador made publicly available in social media.
EEG data was recorded using an Emotiv EPOC+ device with 16-electrodes (2 refer-
ence electrodes) distributed according to international 10–20 location. Data was recorded
from the EEG device at 2048 Hz and hardware down sampled to 128 Hz, with a bandwidth
of 0.2–45 Hz referenced to the mastoids. EEG signals were captured simultaneously when
the user was watching the videos. We removed muscle activity and eye artifacts, with a 1
Hz high-pass filter and independent component analysis (ICA) through EEGLAB Matlab
[26] toolbox in both videos. We used microstates segmentation to analyze EEG signals
with Cartool software, which works through 2 clustering methods, K-Means and Topo-
graphic AAHC [27]. K-Means is a partitioning method in which the user is required to
specify the number of microstate classes [28], while TAAHC belongs is a form of hierar-
chical clustering which starts with all EEG samples, then removes the worst clusters [29]
and selects the best clustering sequence. After EEG segmentation, we correlated the most
representative microstates with the most representative images from the videos. Finally,
to represent relations to each microstate in the sequence, we used the software Circos
which can represent the size, connections and relations between microstates [30].
3. Results
3.1. EEG Microstates Segmentation
There are 19 and 23 scalp topographies, for the first and second video, respectively.
The most representative maps were elected according to cumulative time and repetitions
in the records; there were four maps, which represent 73.74% for the first video and 64.69%
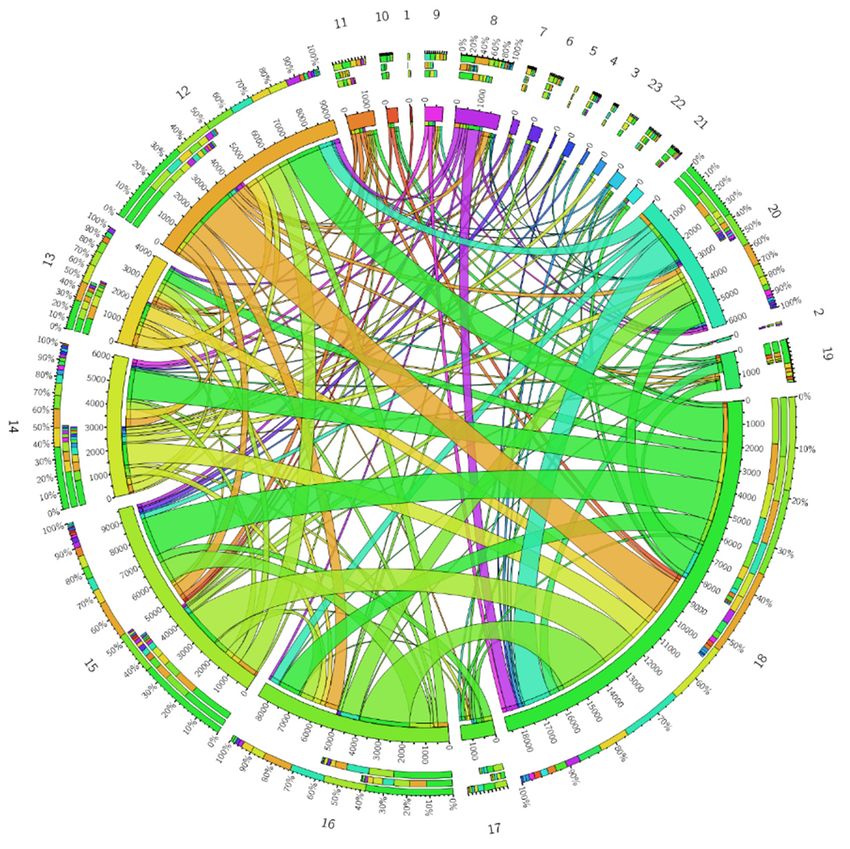
for the second video (Figure 1). A video consists of a set of images which represent the
video. We chose one image for each microstate of the videos and observed the most re-
petitive object of each image as illustrated in Figure 2. For video 1 we observed mostly
sky in MS8-V1, mountains in MS9-V1, water in MS10-V1 and people in MS13-V1. In the
case of video 2 we observed mostly sky in MS12-V2, edifications in MS15-V2, water in
MS16-V2 and people in MS18-V2.
Figure 1. EEG microstate maps by the signals captured with Emotiv EPOC+ device: (a) The first panel includes the most
representative maps in video 1 according to the number of repetitions and the time present: MS8-V1, MS9-V1, MS10-V1,
MS13-V1; (b) The second panel includes the most representative maps in video 2 according to the number of repetitions
and the time present: MS12-V2, MS15-V2, MS16-V2, MS18-V2.
Proceedings 2021, 71, 6                                                                                                         3 of 6

      Figure 2. Images of tourist videos extracted as frames: (a) The first panel includes the most representative images of each
      principal topography in Video S1; (b) The second panel includes the most representative images of each principal topog-
      raphy in Video S2.

                                 3.2. Relation between Microstates
                                      To show how the microstates are related to each other, we observed the sequences
                                 and used the Circos software to illustrate and map a network of sequences for each mi-
                                 crostate of the two videos (see Figures A1 and A2). We can also observe how much time
                                 is occupied by the most predominant topographies illustrated in Figure 1 and their rela-
                                 tions with the others. The width of each band between both topographies represents the
                                 time elapsed until the sequence continues and the weight (number of repetitions) for this
                                 sequence.

                                 4. Discussion
                                       Microstate analysis studies brain states in a functional manner [31]. These “atoms of
                                 thought” may indicate the relationships between presented images from goal-oriented
                                 videos to undergoing neural processes. This methodology suggests that due to the high
                                 duration time of each predominant microstate (four per each video), these can be repre-
                                 sented by the most repetitive figure finding in the same video. However, these images
                                 were not always coincident with this microstate, which suggests that this kind of behavior,
                                 represented by microstates and their high duration time, could be due to the participant’s
                                 emotions and interest in the video, described by Becker H. et al. in their study [32].
                                       The study presented here provides the necessary information on how to develop re-
                                 search focused on finding principal brain activitiy and their stable times to establish rela-
                                 tions between microstates and images captured in videos. This representation of relation-
                                 ships in Circos is a great opportunity to observe widely how many microstates exist when
                                 someone watches videos or performs daily activities. On the other side, to complement
                                 this study, it is necessary to discover participant opinion using questionnaires or surveys
                                 which will allow the researcher to show the relationship between emotions, images, and
                                 microstates.

                                 Supplementary Materials: The following are available online at https://www.youtube.com/
                                 watch?v=Rm-ZA7eTW8s, Video S1: Ecuador tu lugar en el mundo (Ecuador a tu manera);
                                 https://www.youtube.com/watch?v=Tw1bBmdA3ew, Video S2: Ecuador tu lugar en el mundo
                                 (Ecuador a tu aire).
                                 Institutional Review Board Statement: The study was conducted according to the guidelines of the
                                 Declaration of Helsinki, and approved (exempted) by the Institutional Review Board of Claremont
                                 Graduate University (protocol code: 3122 approved april the 2nd 2018).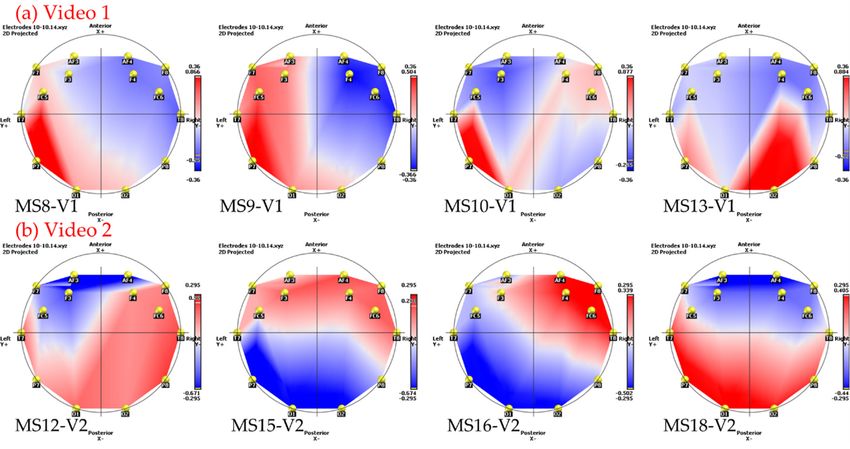
Proceedings 2021, 71, 6                                                                                                 4 of 6

                          Informed Consent Statement: Informed consent was obtained from all subjects involved in the
                          study
                          Data Availability Statement: All data is publicly available https://doi.org/10.6084/m9.figshare.
                          13140395, https://doi.org/10.6084/m9.figshare.13140383.
                          Acknowledgments: The authors would like to thank Paul J. Zak from Claremont Graduate Univer-
                          sity for supporting the project and Jennifer Borja for secretarial assistance. This work was funded
                          by Universidad Técnica de Machala (Ecuador), Université Libre de Bruxelles (Belgium) and Escuela
                          Politécnica Nacional (Ecuador).
                          Conflicts of Interest: The authors declare no conflict of interest.

                          Appendix A

                          Figure A1. Relation between microstates of video 1. The figure shows each relation between mi-
                          crostates, their time lapse in the record and how many relations exist.
Proceedings 2021, 71, 6 5 of 6
Figure A2. Relation between microstates of video 2. The figure shows each relation between mi-
crostates, their time lapse in the record and how many relations exist.
References
1. Stankov, U.; Gretzel, U. Tourism 4.0 technologies and tourist experiences: A human-centered design perspective. Inf. Technol.
Tour. 2020, 22, 477–488, doi:10.1007/s40558-020-00186-y.
2. Naraparaju, S.; Jalapati, P.; Nara, K. Smart poster for tourism promotion through NFC technology. In Studies in Computational
Intelligence; Springer: Berlin, Germany, 2019; Volume 771, pp. 507–519.
3. Reino, S.; Hay, B. The Use of YouTube as a Tourism Marketing Tool. In Proceedings of the 42nd Annual Travel & Tourism
Research Association Conference, London, ON, Canada, 19–21 June 2011.
4. Fatanti, M.N.; Suyadnya, I.W. Beyond User Gaze: How Instagram Creates Tourism Destination Brand? Procedia-Soc. Behav. Sci.
2015, 211, 1089–1095, doi:10.1016/j.sbspro.2015.11.145.
5. Shani, A.; Chen, P.-J.; Wang, Y.; Hua, N. Testing the impact of a promotional video on destination image change: Application
of China as a tourism destination. Int. J. Tour. Res. 2010, 12, 116–133, doi:10.1002/jtr.738.
6. Stankov, U.; Kennell, J.; Morrison, A.M.; Vujičić, M.D. The view from above: The relevance of shared aerial drone videos for
destination marketing. J. Travel Tour. Mark. 2019, 36, 808–822, doi:10.1080/10548408.2019.1575787.
7. Cipolla-Ficarra, F.V.; Cipolla-Ficarra, M.; Harder, T. Realism and cultural layout in tourism and video games multimedia
systems. In Proceedings of the 2008 ACM International Conference on Multimedia, with Co-Located Symposium and
Workshops (MM’08), Vancouver, BC, Canada, 27–31 October 2008; 2008, pp. 15–22.
8. Dubois, L.-E.; Gibbs, C. Video game–induced tourism: A new frontier for destination marketers. Tour. Rev. 2018, 73, 186–198,
doi:10.1108/tr-07-2017-0115.
9. O’Brien, M. The audiovisual action plan: A new audiovisual policy for Ireland. Cult. Trends 2019, 28, 417–428,
doi:10.1080/09548963.2019.1681670.
10. Liestøl, G.; Ritter, C.S.; Ibrus, I. Audiovisual Industries and Tourism: Forms of Convergence. In Emergence of Cross-Innovation
Systems; Emerald Publishing Limited: Bingley, UK, 2019; pp. 165–172.
11. Di Cesare, F.; La Salandra, A.A.; Craparotta, E. Films and Audiovisual Potentiality in Tourism Destination Promotion: A
European Perspective. Tour. Rev. Int. 2020, 16, 101–111.
12. Ecebolla, A.-M.; Epetieau, M.; Ecevallos, C.; Eleroy, A.; Edan, B.; Echeron, G. Long-Lasting Cortical Reorganization as the Result
of Motor Imagery of Throwing a Ball in a Virtual Tennis Court. Front. Psychol. 2015, 6, 1869, doi:10.3389/fpsyg.2015.01869.
13. Leroy, A.; Cevallos, C.; Cebolla, A.-M.; Caharel, S.; Dan, B.; Echeron, G. Short-term EEG dynamics and neural generators evoked
by navigational images. PLoS ONE 2017, 12, e0178817, doi:10.1371/journal.pone.0178817.
14. Alamäki, A.; Pesonen, J.; Dirin, A. Triggering effects of mobile video marketing in nature tourism: Media richness perspective.
Inf. Process. Manag. 2019, 56, 756–770, doi:10.1016/j.ipm.2019.01.003.Proceedings 2021, 71, 6 6 of 6
15. Alejandro, V. Generación de emociones en la intención de compra. Rev. Ciencias Soc. 2019, 3, 218–229.
16. Li, S.; Walters, G.; Packer, J.; Scott, N. Using skin conductance and facial electromyography to measure emotional responses to
tourism advertising. Curr. Issues Tour. 2016, 21, 1761–1783, doi:10.1080/13683500.2016.1223023.
17. Hadinejad, A.; Moyle, B.D.; Scott, N.; Kralj, A. Emotional responses to tourism advertisements: The application of FaceReader™.
Tour. Recreat. Res. 2018, 44, 131–135, doi:10.1080/02508281.2018.1505228.
18. Beck, J.; Egger, R. Emotionalise Me: Self-reporting and Arousal Measurements in Virtual Tourism Environments. In Information
and Communication Technologies in Tourism 2018; Springer: Basel, Switzerland, 2018; pp. 3–15.
19. Tinoco-Egas, R. Fundamentos del neuromarketing desde la neurociencia del consumidor para la generación de confianza.
Redmarka Rev. Mark. Appl. 1970, 1, 29–40, doi:10.17979/redma.2016.01.016.4870.
20. Hsu, L.; Chen, Y.-J. Neuromarketing, subliminal advertising, and hotel selection: An EEG study. Australas. Mark. J. (AMJ) 2020,
doi:10.1016/j.ausmj.2020.04.009.
21. Koenig, T.; Lehmann, D. Microstates in Language-Related Brain Potential Maps Show Noun–Verb Differences. Brain Lang. 1996,
53, 169–182, doi:10.1006/brln.1996.0043.
22. Damborská, A.; Tomescu, M.I.; Honzírková, E.; Barteček, R.; Hořínková, J.; Fedorová, S.; Ondruš, Š.; Michel, C.M. EEG Resting-
State Large-Scale Brain Network Dynamics Are Related to Depressive Symptoms. Front. Psychiatry 2019, 10, 548,
doi:10.3389/fpsyt.2019.00548.
23. Michel, C.M.; Koenig, T. EEG microstates as a tool for studying the temporal dynamics of whole-brain neuronal networks: A
review. NeuroImage 2018, 180, 577–593, doi:10.1016/j.neuroimage.2017.11.062.
24. D’Croz-Baron, D.F.; Baker, M.; Michel, C.M.; Karp, T. EEG Microstates Analysis in Young Adults With Autism Spectrum
Disorder During Resting-State. Front. Hum. Neurosci. 2019, 13, 173, doi:10.3389/fnhum.2019.00173.
25. Murray, M.M.; Brunet, D.; Michel, C.M. Topographic ERP Analyses: A Step-by-Step Tutorial Review. Brain Topogr. 2008, 20,
249–264, doi:10.1007/s10548-008-0054-5.
26. Delorme, A.; Makeig, S. EEGLAB: An open source toolbox for analysis of single-trial EEG dynamics including independent
component analysis. J. Neurosci. Methods 2004, 134, 9–21, doi:10.1016/j.jneumeth.2003.10.009.
27. Brunet, D.; Murray, M.M.; Michel, C.M. Spatiotemporal Analysis of Multichannel EEG: CARTOOL. Comput. Intell. Neurosci.
2011, 2011, 1–15, doi:10.1155/2011/813870.
28. Lloyd, S. Least squares quantization in PCM. IEEE Trans. Inf. Theory 1982, 28, 129–137, doi:10.1109/tit.1982.1056489.
29. Poulsen, A.T.; Pedroni, A.; Langer, N.; Hansen, L.K. Microstate EEGlab toolbox: An introductory guide. bioRxiv 2018,
doi:10.1101/289850.
30. Krzywinski, M.; Schein, J.; Birol, I.; Connors, J.; Gascoyne, R.; Horsman, D.; Jones, S.J.; Marra, M.A. Circos: An information
aesthetic for comparative genomics. Genome Res. 2009, 19, 1639–1645, doi:10.1101/gr.092759.109.
31. Lehmann, D.; Pascual-Marqui, R.D.; Michel, C. EEG microstates. Scholarpedia 2009, 4, 7632, doi:10.4249/scholarpedia.7632.
32. Becker, H.; Fleureau, J.; Guillotel, P.; Wendling, F.; Merlet, I.; Albera, L. Emotion Recognition Based on High-Resolution EEG
Recordings and Reconstructed Brain Sources. IEEE Trans. Affect. Comput. 2017, 11, 244–257, doi:10.1109/taffc.2017.2768030.You can also read