A statistical study of COVID-19 pandemic in Egypt - De Gruyter
←
→
Page content transcription
If your browser does not render page correctly, please read the page content below
Demonstratio Mathematica 2021; 54: 233–244
Research Article
Taha Radwan*
A statistical study of COVID-19 pandemic
in Egypt
https://doi.org/10.1515/dema-2021-0028
received March 29, 2021; accepted June 1, 2021
Abstract: The spread of the COVID-19 started in Wuhan on December 31, 2019, and a powerful outbreak of
the disease occurred there. According to the latest data, more than 165 million cases of COVID-19 infection
have been detected in the world (last update May 19, 2021). In this paper, we propose a statistical study of
COVID-19 pandemic in Egypt. This study will help us to understand and study the evolution of this pan-
demic. Moreover, documenting of accurate data and taken policies in Egypt can help other countries to deal
with this epidemic, and it will also be useful in the event that other similar viruses emerge in the future.
We will apply a widely used model in order to predict the number of COVID-19 cases in the coming period,
which is the autoregressive integrated moving average (ARIMA) model. This model depicts the present
behaviour of variables through linear relationship with their past values. The expected results will enable
us to provide appropriate advice to decision-makers in Egypt on how to deal with this epidemic.
Keywords: statistical model, pandemic, COVID-19, coronavirus, time series analysis
MSC 2020: 37M10, 62M10, 62P10, 65C20
1 Introduction
The spread of the COVID-19 started in Wuhan on December 31, 2019, and a powerful outbreak of the disease
occurred there. According to the latest data, more than 165 million cases of COVID-19 infection have been
detected in the world (last update May 19, 2021). As the epidemic grows, patients with positive diagnosis are
only considered. COVID-19 pandemic is new for all people. This pandemic has caused huge losses in the
economy and human lives, as well as the occurrence of many social and political changes around the world.
It is known that viruses do not replicate outside the living organism. However, various environmental
changes may play a role in its spread or decline, and this role is still mysterious. The main route of
transmission of COVID-19 is person-to-person through direct contact with patient or through droplet spread
from patient by sneezing or coughing, in addition to touching contaminated surfaces [1–3].
To date, little is known about roles of viruses in the environment, although it is believed that it could
influence global bio-geo-chemical cycles and drive microbial evolution by natural selection by exchange of
the genetic information between hosts [4]. On the other hand, the role of environmental conditions in the
outbreaks of viral diseases is not well-recognized yet. However, there is a belief that some environmental
parameters such as sunlight, temperature, humidity, and pollution could have direct or indirect effect on
the outbreak of some indoor or airborne viruses [5].
* Corresponding author: Taha Radwan, Department of Mathematics, College of Science and Arts, Qassim University, Ar Rass,
Saudi Arabia, e-mail: t.radwan@qu.edu.sa; Department of Mathematics and Statistics, Faculty of Management Technology and
Information Systems, Port Said University, Port Said, Egypt, e-mail: taha_ali_2003@hotmail.com
Open Access. © 2021 Taha Radwan, published by De Gruyter. This work is licensed under the Creative Commons Attribution 4.0
International License.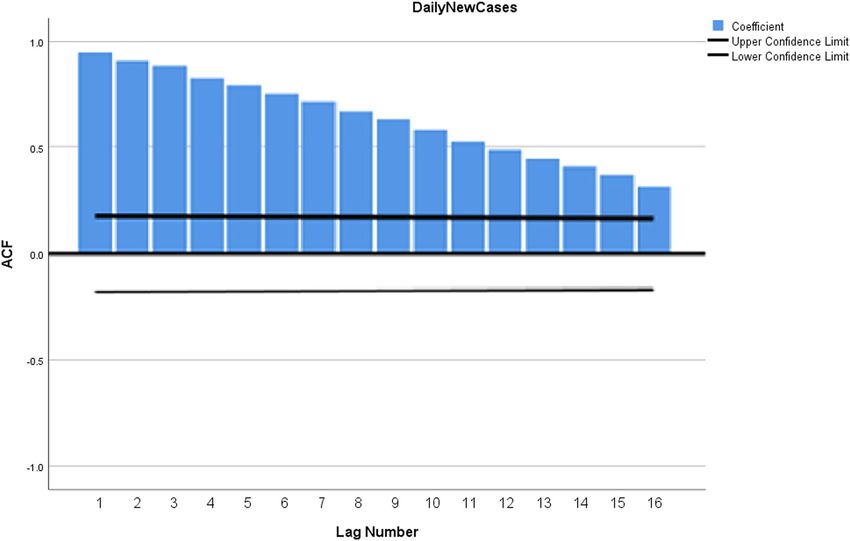
234 Taha Radwan
The measures taken by the world are unprecedented for more than a century. This is because the
emerging virus is very infectious and dangerous, especially for the elderly, and it is not secret that the
world’s decision-makers are not young in general and have not been able to feel safe with this virus.
Many scientists in various disciplines have gone to their best efforts to limit the spread of this pan-
demic. In fact, we need medical, pharmacy, and biological studies in the first place; statistics in order to
give us some statistical models to be able to predict the infected cases in the coming period; and also
researchers to give us information about epidemics throughout history and how our ancestors dealt with it.
In addition to sociologists and psychologists, it is also important that geologists and meteorologists
participate.
In order to find anti-epidemic drugs for COVID-19, we need to carry out many in-depth studies on
immunological modulators and supportive therapies that are a promising path toward developing new
strategies to first mitigate the spread of the virus and put an end to the devastating consequences for health
throughout the world. There are many clinical trials to produce results guaranteed by many scientific
authorities. There are many mathematical and statistical research in this field that provide a clear approach
to extracting text and a screen to summarize accurate information in order to assist current clinical
trials [6–10].
In this paper, we provide a statistical study of COVID-19 pandemic in Egypt. We try to understand and
study the evolution of the virus by performing this study. The main result of this paper is proposing a sta-
tistical model using autoregressive integrated moving average (ARIMA) model that enables us to forecast
the infected cases in Egypt in the coming period. The expected results evaluated using the proposed model
will enable us to provide appropriate advice to decision-makers in Egypt on how to deal with this epidemic
in the coming period. In addition, documenting of accurate data can help other countries to deal with the
epidemic, and it will also be useful in the event that other similar viruses emerge in the future.
2 Model description
We will apply a widely used model in order to predict the number of COVID-19 cases in the coming period,
which is the ARIMA model [11–14]. It is also called the Box-Jenkins model. This model depicts the present
behaviour of variables through linear relationship with their past values. The ARIMA model consists of two
parts [15]. The first part is an integrated component (I) that represents the order of differencing (d) that must
be made to the series to achieve stability. The second part of ARIMA model is an ARMA model. The ARMA
model also consists of two parts, which are auto regressive (AR) model and moving average (MA) model.
The AR model depicts the correlation within the time series between the current values and some of
their past values. The output of AR, with time τ and order parameter p, can be given by formulae (1) and (2).
z τ = −a1z τ − 1 − a2z τ − 2 − ⋯ − apz τ − p + ε, (1)
where
z −1 = 1 − a1z −1 + ⋯ + apz −p . (2)
The MA model represents the duration of the influence of random shocks. The output z (τ ) of MA, with
time τ and weights Bq , can be given by formulae (3) and (4).
z τ = B1ε τ − 1 + B2ε τ − 2 + ⋯ + Bqε τ − q + ε, (3)
where
B(z −1) = 1 − B1z −1 + ⋯ + Bqz −p . (4)
Combining AR and MA models gives us the output of ARMA model by formula (5).
z τ = −a1z τ − 1 − a2z τ − 2 − ⋯ − apz τ − p + ε + B1ε τ − 1 + B2ε τ − 2 + ⋯ + Bqε τ − q . (5)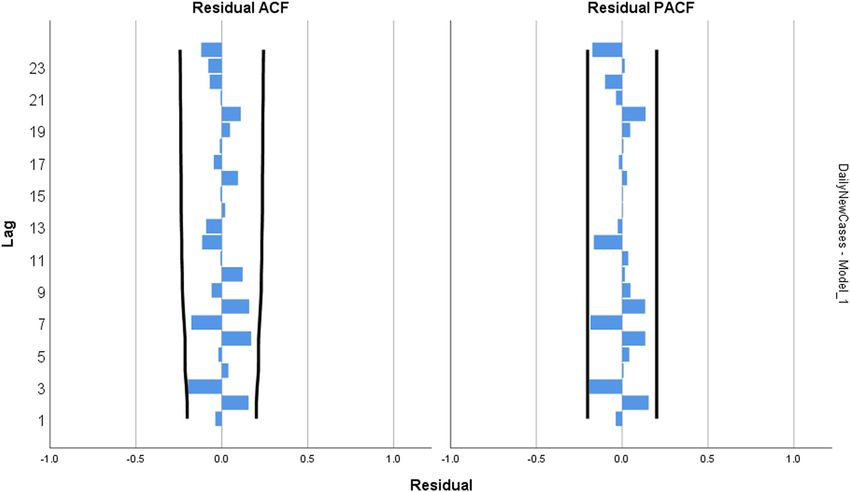
A statistical study of COVID-19 pandemic in Egypt 235
The most general model is the ARIMA model, in which the differences are made at least once. ARIMA
model has many successful examples of prediction for many different fields [16]. The output of ARIMA
model can be given by formula (6).
z τ = (1 − z τ − d ) − a1z τ − 1 − ⋯ − apz τ − p + ε + B1ε τ − 1 + ⋯ + Bqε τ − q . (6)
ARIMA model is based on three components p, d, and q for AR, the order of differencing, and MA,
respectively.
3 Model performance measures
Some of the common precision functions for measuring the performance of ARIMA model are given below.
3.1 Bayesian information criterion (BIC)
The Schwarz criterion or BIC is a criterion for selecting a model from a limited set of models [17]. This
criterion depends on the likelihood function. BIC is closely related to the Akaike information criterion
(AIC) [18].
BIC will be used to choose the best model for estimation; the best model has a lowest value of BIC.
In this paper, the parameters of ARIMA model were chosen based on the value of BIC, which is given
by (7) [19].
−2 ⋅ ln(Pr{∣ }) ≈ BIC = {ln } − 2 ⋅ ln( ) , (7)
where is the observed data, is the number of observations, is the number of free parameters
required to estimate, Pr{∣ } is the likelihood of the parameters, and is the maximized value of the like-
lihood function.
3.2 Autocorrelation function (ACF)
The ACF describes the correlation between zt and z τ − . This function is defined as follows:
Cov(z τ , z τ − )
ACF( ) = . (8)
Var(z )
3.3 Partial autocorrelation function (PACF)
The PACF describes the simple correlation between zt and z τ − minus the part explained by the intervening
lags. This function is defined as follows:
ρ = Corr(z τ − E.{z τ∣z τ − 1 , z τ − 2 , … , z τ − + 1} , z τ − ) , (9)
where E.{z τ∣z τ − 1 , z τ − 2 , … , z τ − + 1} is the minimum mean-squared error predictor of z τ by z τ − 1 , z τ − 2, … , z τ − + 1.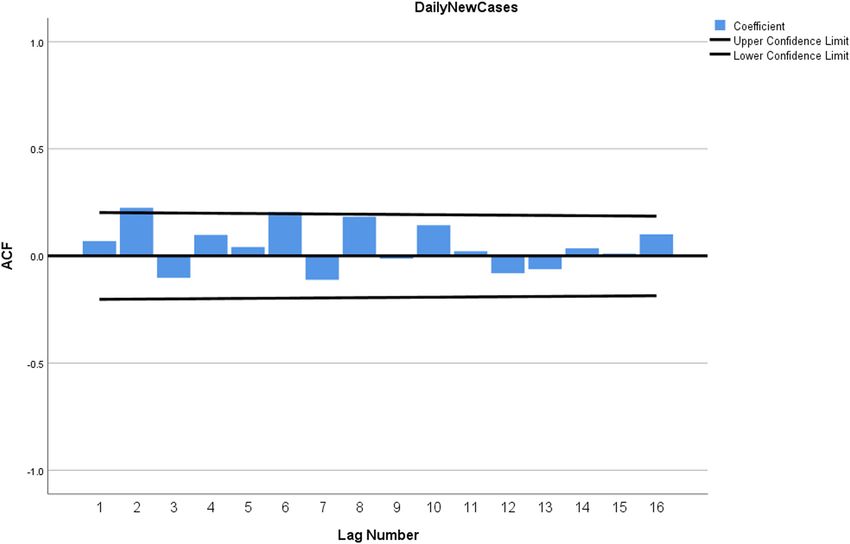
236 Taha Radwan
3.4 Root mean square error (RMSE)
∑l= 1( yl − y͠ l )2 (10)
RMSE = ,
where yl is the actual value and y͠ l is the predicted value.
3.5 Mean absolute error (MAE)
∑l= 1∣yl − y͠ l∣
MAE = . (11)
3.6 Coefficient of determination
1
∑ (y
l=1 l
− y͠ l )2
R2 = 1 − 1
, (12)
∑ (y
l=1 l
− yl )2
where
∑l= 1yl
yl = . (13)
3.7 Mean absolute percentage error (MAPE)
y͠ l − yl
∑l= 1 y͠ l (14)
MAPE = .
4 Data analysis
First, we checked the stationary of the time series of daily new cases of COVID-19 in Egypt (original series)
by the graphs of the series, ACF, and augmented Dickey-Fuller (ADF) test.
The time series of daily new cases of COVID-19 in Egypt is graphed in Figure 1, and it shows that the
series’ behaviour is unstable, which indicates its growth. And so the ACF of original series in Figure 2 shows
that the series behaviour is unstable, as the ACF for this series do not fade away quickly at high lags.
Furthermore, we performed the ADF test in order to test the stationary of this series. The ADF test assumes
that the null hypothesis is non-stationary of the time series and that the alternative hypothesis is the
stationary of the time series.
The result of ADF test was non-stationary of the original series, in which the p-value was more than 5%
( p = 0.8143). Therefore, the series needs to be transformed to achieve stationary.
After making the first difference for the original series, the graph of the differenced series in Figure 3
shows that the series’ behaviour is stationary. And so ACF and PACF of the differenced series in Figures 4
and 5 are characterized by alternate signs of the correlations and fade with increasing the lags. This
indicates that the differenced series is stationary and there is no sign of seasonality. Furthermore, the result
of ADF test shows that the differenced series are stationary, in which the p-value was less than 5%
( p = 0.0000).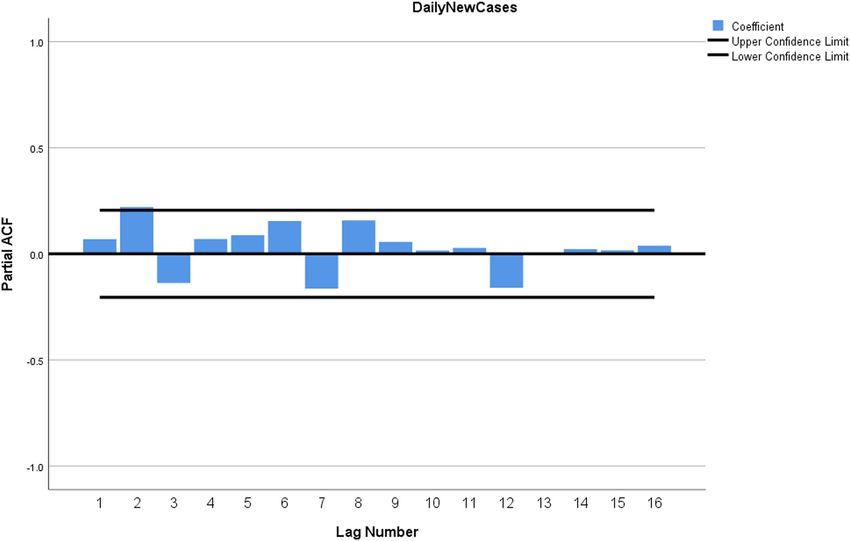
A statistical study of COVID-19 pandemic in Egypt 237
Figure 1: The original series.
Figure 2: ACF of the original series.
Now we can choose the appropriate ARIMA model using the BIC criterion, especially after fulfilling the
stationarity condition of the series, which achieved at the 1st difference.
By analysing the data using the SPSS 26, we found that the ARIMA (1,1,1) model is the best suitable
model, as it has the lowest value of BIC. Therefore, we propose the ARIMA (1,1,1) model for forecasting
the COVID-19 cases in the coming period.238 Taha Radwan
Figure 3: The differenced series.
Figure 4: ACF of the differenced series.
Figure 6 displays the residuals of ACF and PACF of the proposed model, and from this figure we notice
that the coefficients of ACF and PACF fall within the confidence intervals, which means that the residuals
are purely random changes, and hence the proposed model is fit for forecasting the COVID-19 cases in the
coming period. The model fit statistics of ARIMA (1,1,1) are given in Table 1.A statistical study of COVID-19 pandemic in Egypt 239
Figure 5: PACF of the differenced series.
Figure 6: The residual of ACF and PACF of ARIMA (1,1,1).
The model parameters of ARIMA (1,1,1) are given in Table 2. The coefficients of AR, MA, and constant
models are 0.887, 0.806, and 5.514, respectively. Therefore, the formula of the proposed model can be given
as follows.
z τ = 0.887z τ − 1 + 0.806ε τ − 1 + 5.514. (15)240 Taha Radwan
Table 1: Model fit statistics of ARIMA (1,1,1)
R2 RMSE MAPE MAE Normalized BIC
0.995 14.868 1.285 9.361 5.542
Table 2: Model parameters of ARIMA (1,1,1)
Estimate SE t Sig.
Constant 5.514 2.539 2.172 0.032
AR Lag 1 0.887 0.178 4.98 0.000
Difference 1
MA Lag 1 0.806 0.231 3.485 0.001
5 Results and discussion
On January 26, 2020, Egypt banned all flights between Egypt and China. The first infection case of COVID-19
in Egypt was recorded in a Chinese person on February 14, 2020, and he was sent to quarantine at the health
centre. On March 7, 2020, the Egyptian government imposed various forms of closures for schools, universi-
Table 3: Comparison between the actual and ARIMA (1,1,1) values with 95% confidence interval
Date Actual ARIMA(1,1,1) Lower confidence limits Upper confidence limits
April 20, 2021 855 860 831 890
April 21, 2021 861 866 837 896
April 22, 2021 872 878 848 907
April 23, 2021 884 890 861 920
April 24, 2021 912 920 890 949
April 25, 2021 953 963 934 993
April 26, 2021 991 1,003 973 1,033
April 27, 2021 1,003 1,014 985 1,044
April 28, 2021 1,011 1,021 992 1,051
April 29, 2021 1,003 1,011 982 1,041
April 30, 2021 1,021 1,030 1,000 1,059
May 01, 2021 1,032 1,041 1,011 1,070
May 02, 2021 1,051 1,060 1,031 1,090
May 03, 2021 1,078 1,088 1,059 1,118
May 04, 2021 1,090 1,100 1,070 1,129
May 05, 2021 1,102 1,111 1,082 1,141
May 06, 2021 1,110 1,119 1,089 1,148
May 07, 2021 1,125 1,134 1,104 1,164
May 08, 2021 1,132 1,140 1,111 1,170
May 09, 2021 1,138 1,146 1,116 1,175
May 10, 2021 1,150 1,158 1,128 1,187
May 11, 2021 1,180 1,189 1,160 1,219
May 12, 2021 1,187 1,196 1,166 1,225
May 13, 2021 1,193 1,201 1,172 1,231
May 14, 2021 1,197 1,205 1,175 1,234
May 15, 2021 1,203 1,210 1,181 1,240
May 16, 2021 1,201 1,207 1,178 1,237
May 17, 2021 1,188 1,193 1,163 1,222
May 18, 2021 1,169 1,172 1,142 1,201
May 19, 2021 1,160 1,162 1,133 1,192A statistical study of COVID-19 pandemic in Egypt 241
ties, mosques, most gathering places, and transportation between cities and countries, in order to alleviate
the spread of this epidemic. The daily new cases of COVID-19 in Egypt from February 15, 2020, to May 19,
2021, are graphed in Figure 1. All data were obtained from the Ministry of Health and Population Egypt [20].
Because of the lack of awareness of the citizens, the number of infections increased until it reached its
highest value in June 2020 (1,774 cases on June 19, 2020). Therefore, the Egyptian government took more
measures, such as paying a fine, in case of non-compliance with the precautionary measures. In addition to
the high temperature that reduces the spread of the virus in the months of July, August, and September
2020, and as a result, the number of infections decreased in this period.
Table 4: The prediction results of COVID-19 in Egypt using ARIMA (1,1,1)
Date ARIMA(1,1,1) Lower Confidence limits Upper confidence limits
May 20, 2021 1,165 1,121 1,208
May 21, 2021 1,168 1,112 1,223
May 22, 2021 1,171 1,105 1,237
May 23, 2021 1,174 1,099 1,250
May 24, 2021 1,178 1,093 1,263
May 25, 2021 1,182 1,088 1,276
May 26, 2021 1,186 1,083 1,289
May 27, 2021 1,190 1,079 1,302
May 28, 2021 1,195 1,075 1,314
May 29, 2021 1,199 1,072 1,327
May 30, 2021 1,204 1,069 1,339
May 31, 2021 1,208 1,066 1,351
June 01, 2021 1,213 1,063 1,363
June 02, 2021 1,218 1,061 1,375
June 03, 2021 1,223 1,059 1,387
June 04, 2021 1,228 1,058 1,399
June 05, 2021 1,233 1,056 1,410
June 06, 2021 1,238 1,055 1,422
June 07, 2021 1,244 1,054 1,433
June 08, 2021 1,249 1,053 1,445
June 09, 2021 1,254 1,052 1,456
June 10, 2021 1,259 1,052 1,467
June 11, 2021 1,265 1,051 1,478
June 12, 2021 1,270 1,051 1,489
June 13, 2021 1,275 1,051 1,500
June 14, 2021 1,281 1,051 1,511
June 15, 2021 1,286 1,051 1,521
June 16, 2021 1,291 1,051 1,532
June 17, 2021 1,297 1,051 1,542
June 18, 2021 1,302 1,052 1,553
June 19, 2021 1,308 1,052 1,563
June 20, 2021 1,313 1,053 1,574
June 21, 2021 1,319 1,053 1,584
June 22, 2021 1,324 1,054 1,594
June 23, 2021 1,330 1,055 1,604
June 24, 2021 1,335 1,056 1,614
June 25, 2021 1,340 1,057 1,624
June 26, 2021 1,346 1,058 1,634
June 27, 2021 1,351 1,059 1,644
June 28, 2021 1,357 1,060 1,654
June 29, 2021 1,362 1,062 1,663
June 30, 2021 1,368 1,063 1,673242 Taha Radwan
Figure 7: The actual and predicted number of Daily COVID-19 cases in Egypt from April 20, 2021, to June 30, 2021.
In October 2020, the Egyptian government allowed the students to attend schools and universities in
conjunction with low temperatures that increase the spread of the virus, which led to an increase in the
number of infections again until it reached its peak on January 1, 2021 (1,418 cases).
Therefore, the Egyptian government canceled the attendance of students in schools and universities
and replaced it with distance education. As a result, the number of infections decreased to 509 cases on
February 6, 2021.
In this paper, we try to provide assistance to decision-makers in Egypt by proposing the ARIMA (1,1,1)
model to predict the number of COVID-19 cases in the coming period. The comparison between the actual
and estimated values (using the proposed model) in Table 3 confirms the good compatibility of this model
and its ability to predict cases of COVID-19 in the coming period. Table 4 and Figure 7 show the expected
confirmed cases using the proposed model from May 20, 2021, to June 31, 2021. As shown in Table 4, the
expected results using the proposed model show that the trend of COVID-19 cases will increase during the
coming period, as the number of daily cases in Egypt is expected to increase from 1,160 cases on May 19,
2021, to 1,368 cases on June 31, 2021, with average 1,230 cases. Also, the total number of COVID-19 cases is
expected to increase from 249,238 cases on May 19, 2021, to 302,137 cases on June 31, 2021, with average
275,570 cases.
6 Conclusion
In this paper, we presented a statistical study of COVID-19 pandemic in Egypt. An ARIMA (1,1,1) model has
been proposed for forecasting the COVID-19 cases in the coming period. The expected results using the
proposed model show that the trend of COVID-19 cases is increasing during the coming period, as the
number of daily cases in Egypt is expected to increase from 1,160 cases on May 19, 2021, to 1,368 cases on
June 31, 2021, with average 1,230 cases. Also, the total number of COVID-19 cases is expected to increase
from 249,238 cases on May 19, 2021, to 302,137 cases on June 31, 2021, with average 275,570 cases. Therefore,A statistical study of COVID-19 pandemic in Egypt 243
we strongly advice decision-makers in Egypt to take the necessary measures towards reducing the spread of
COVID-19 pandemic, such as obligating citizens to take precautionary measures, imposing more restrictions
on places of high-density gatherings, isolating infected cases, and other measures recommended by the
World Health Organization.
The future work of this research is a statistical study of COVID-19 pandemic in some Middle Eastern
countries and compare the results between them to find out the most influencing factors on the spread of
this epidemic. In addition, other models and techniques will be used to obtain accurate data to predict the
infected cases of COVID-19.
Acknowledgements: The author would like to thank Prof. Khaled Zennir from Department of Mathematics,
College of Science and Arts, Qassim University, Ar Rass, Saudi Arabia, for his help and support to present
this paper.
Conflict of interest: The author declares that there is no conflict of interests regarding the publication of this
paper.
References
[1] H. A. Rothan and S. N. Byrareddy, The epidemiology and pathogenesis of coronavirus disease (COVID-19) outbreak,
J. Autoimmun. 109 (2020), 102433, DOI: https://doi.org/10.1016/j.jaut.2020.102433.
[2] K. Zennir and B. Feng, One spatial variable thermoelastic transmission problem in viscoelasticity located in the second
part, Math. Methods Appl. Sci. 41 (2018), no. 16, 6895–6906, DOI: https://doi.org/10.1002/mma.5201.
[3] S. Zitouni, A. Ardjouni, K. Zennir, and R. Amiar, Well-posedness and decay of solution for a transmission problem in the
presence of infinite history and varying delay, Nonlinear Stud. 25 (2018), 445–465.
[4] F. Rohwer, D. Prangishvili, and D. Lindell, Roles of viruses in the environment, Environ Microbiol. 11 (2009), no. 11,
27712774, DOI: https://doi.org/10.1111/j.1462-2920.2009.02101.x.
[5] J. W. Tang, The effect of environmental parameters on the survival of airborne infectious agents, J. R. Soc. Interface 6
(2009), no. 6, S737–S746, DOI: https://doi.org/10.1098/rsif.2009.0227.focus.
[6] M. A. Al-Qaness, A. A. Ewees, H. Fan, and M. Abd El Aziz, Optimization method for forecasting confirmed cases of COVID-19
in China, J. Clin. Med. 9 (2020), no. 3, 674, DOI: https://doi.org/10.3390/jcm9030674.
[7] B. Ivorra, M. R. Ferrández, M. Vela-Pérez, and A. Ramos, Mathematical modeling of the spread of the coronavirus disease
2019 (COVID-19) taking into account the undetected infections: the case of China, Commun. Nonlinear Sci. Numer. Simul.
88 (2020), 105303, DOI: https://doi.org/10.1016/j.cnsns.2020.105303.
[8] R. Tosepu, J. Gunawan, D. S. Effendy, L. O. A. I. Ahmad, H. Lestari, H. Bahar, et al., Correlation between weather and
Covid-19 pandemic in Jakarta, Indonesia, Sci. Total Environ. 725 (2020), 138436, https://doi.org/10.1016/j.scitotenv.
2020.138436.
[9] R. Gupta and S. K. Pal, Trend analysis and forecasting of Covid-19 outbreak in India, MedRxiv, 2020, https://doi.org/10.
1101/2020.03.26.20044511.
[10] V. Papastefanopoulos, P. Linardatos, and S. Kotsiantis, COVID-19: A comparison of time series methods to forecast
percentage of active cases per population, Appl. Sci. 10 (2020), no. 11, 3880, DOI: https://doi.org/10.3390/app10113880.
[11] L. Fang, D. Wang, and G. Pan, Analysis and estimation of COVID-19 spreading in Russia based on ARIMA model, SN Compr.
Clin. Med. 2 (2020), no. 12, 2521–2527, DOI: https://doi.org/10.1007/s42399-020-00555-y.
[12] Z. Malki, E.-S. Atlam, A. Ewis, G. Dagnew, A. R. Alzighaibi, G. ELmarhomy, et al., ARIMA models for predicting the end of
COVID-19 pandemic and the risk of second rebound, Neural. Comput. Appl. 33 (2021), no. 7, 2929–2948, DOI: https://
doi.org/10.1007/s00521-020-05434-0.
[13] R. Katoch and A. Sidhu, An application of ARIMA model to forecast the dynamics of COVID-19 epidemic in India, Glob. Bus.
Rev. (2021), 0972150920988653, DOI: https://doi.org/10.1177/0972150920988653.
[14] D. H. Lee, Y. S. Kim, Y. Y. Koh, K. Y. Song, and I. H. Chang, Forecasting COVID-19 confirmed cases using empirical data
analysis in Korea, Healthcare 9 (2021), no. 3, 254, DOI: https://doi.org/10.3390/healthcare9030254.
[15] G. E. Box, G. M. Jenkins, G. C. Reinsel, and G. M. Ljung, Time Series Analysis: Forecasting and Control, John Wiley and
Sons, 2015.
[16] S. I. Alzahrani, I. A. Aljamaan, and E. A. Al-Fakih, Forecasting the spread of the COVID-19 pandemic in Saudi Arabia using
ARIMA prediction model under current public health interventions, J. Infect. Public Health. 13 (2020), no. 7, 914–919,
DOI: https://doi.org/10.1016/j.jiph.2020.06.001.244 Taha Radwan
[17] G. Schwarz, Estimating the dimension of a model, Ann. Statist. 6 (1978), no. 2, 461–464, https://doi.org/10.1214/aos/
1176344136.
[18] H. Akaike, On entropy maximization principle, in: P. R. Krishnaiah (ed.), Applications of Statistics, North-Holland,
Amsterdam, 1977, pp. 27–41.
[19] E. P. Clement, Using Normalized Bayesian Information Criterion (bic) to improve Box-Jenkins model building, Am. J. Math.
Stat. 4 (2014), no. 5, 214–221.
[20] https://www.worldometers.info/coronavirus/.You can also read